Architecture
Pigsty’s modular architecture — declarative composition, on-demand customization, flexible deployment.
Pigsty uses a modular architecture with a declarative interface. You can freely combine modules like building blocks as needed.
Modules
Pigsty uses a modular design with six main default modules: PGSQL, INFRA, NODE, ETCD, REDIS, and MINIO.
PGSQL: Self-healing HA Postgres clusters powered by Patroni, Pgbouncer, HAproxy, PgBackrest, and more.INFRA: Local software repo, Nginx, Grafana, Victoria, AlertManager, Blackbox Exporter—the complete observability stack.NODE: Tune nodes to desired state—hostname, timezone, NTP, ssh, sudo, haproxy, docker, vector, keepalived.ETCD: Distributed key-value store as DCS for HA Postgres clusters: consensus leader election/config management/service discovery.REDIS: Redis servers supporting standalone primary-replica, sentinel, and cluster modes with full monitoring.MINIO: S3-compatible simple object storage that can serve as an optional backup destination for PG databases.
You can declaratively compose them freely. If you only want host monitoring, installing the INFRA module on infrastructure nodes and the NODE module on managed nodes is sufficient.
The ETCD and PGSQL modules are used to build HA PG clusters—installing these modules on multiple nodes automatically forms a high-availability database cluster.
You can reuse Pigsty infrastructure and develop your own modules; REDIS and MINIO can serve as examples. More modules will be added—preliminary support for Mongo and MySQL is already on the roadmap.
Note that all modules depend strongly on the NODE module: in Pigsty, nodes must first have the NODE module installed to be managed before deploying other modules.
When nodes (by default) use the local software repo for installation, the NODE module has a weak dependency on the INFRA module. Therefore, the admin/infrastructure nodes with the INFRA module complete the bootstrap process in the deploy.yml playbook, resolving the circular dependency.
Standalone Installation
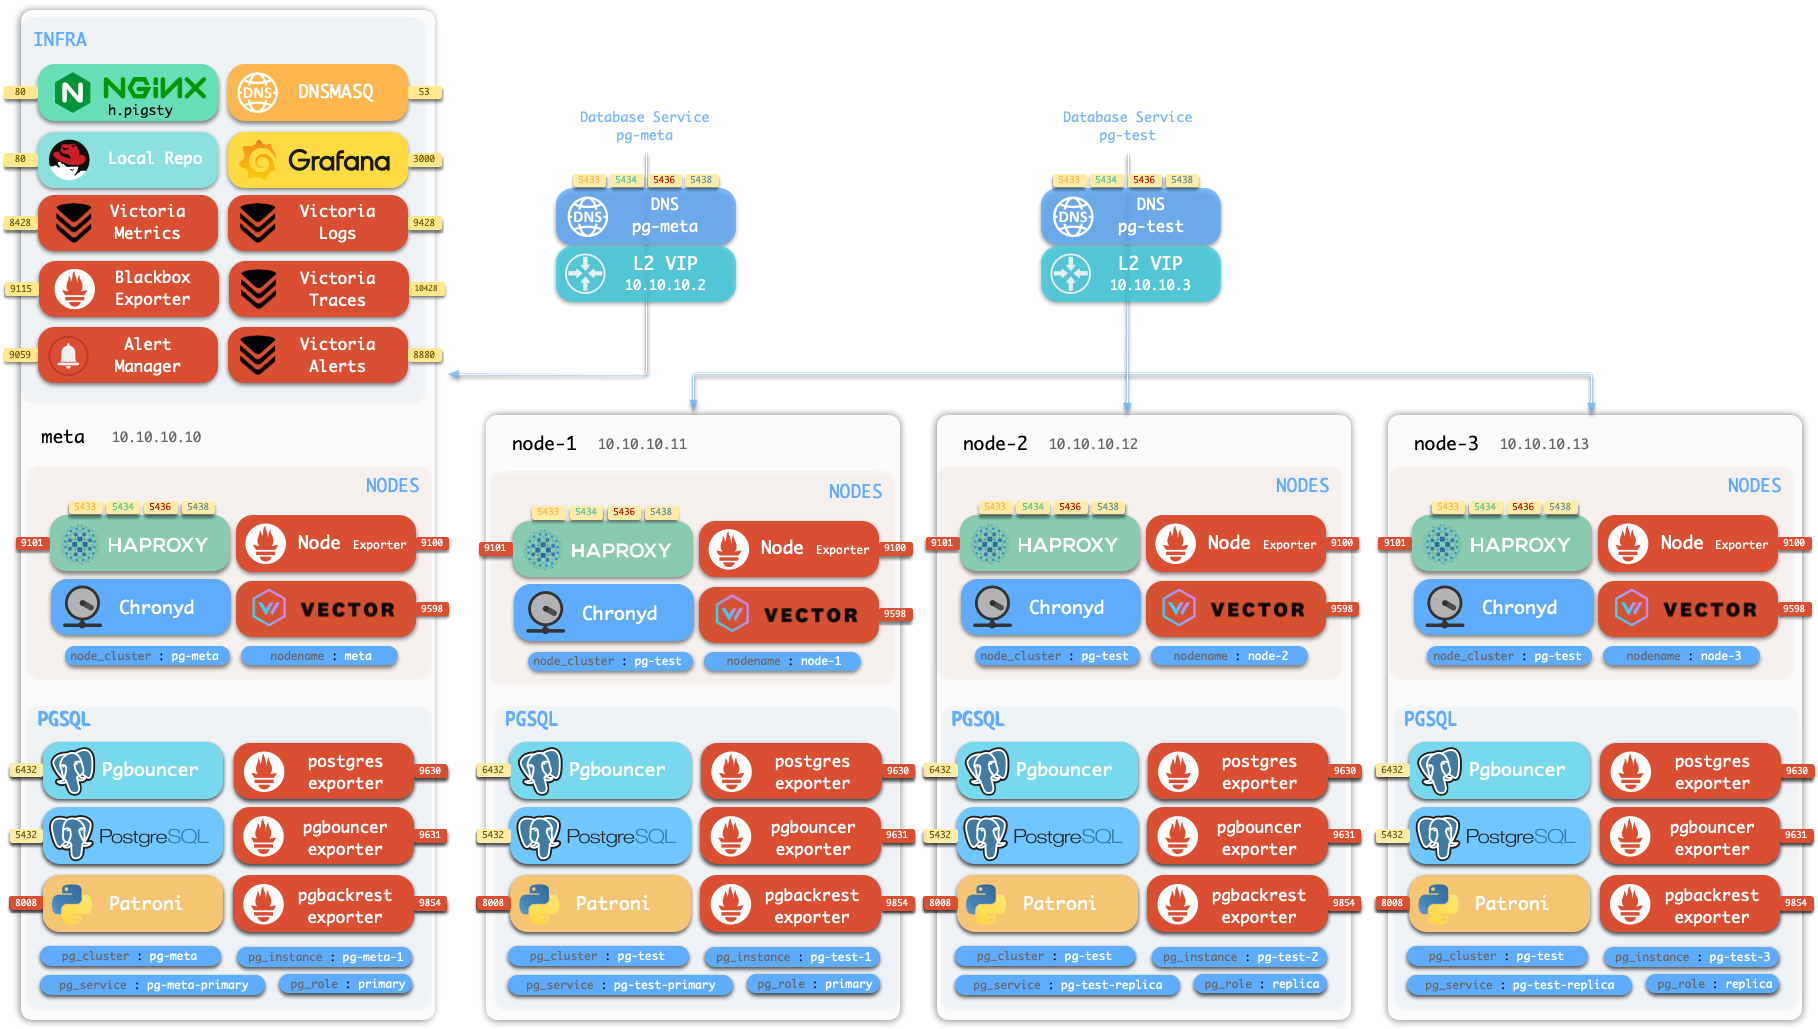
By default, Pigsty installs on a single node (physical/virtual machine). The deploy.yml playbook installs INFRA, ETCD, PGSQL, and optionally MINIO modules on the current node,
giving you a fully-featured observability stack (Prometheus, Grafana, Loki, AlertManager, PushGateway, BlackboxExporter, etc.), plus a built-in PostgreSQL standalone instance as a CMDB, ready to use out of the box (cluster name pg-meta, database name meta).
This node now has a complete self-monitoring system, visualization tools, and a Postgres database with PITR auto-configured (HA unavailable since you only have one node). You can use this node as a devbox, for testing, running demos, and data visualization/analysis. Or, use this node as an admin node to deploy and manage more nodes!
Monitoring
The installed standalone meta node can serve as an admin node and monitoring center to bring more nodes and database servers under its supervision and control.
Pigsty’s monitoring system can be used independently. If you want to install the Prometheus/Grafana observability stack, Pigsty provides best practices!
It offers rich dashboards for host nodes and PostgreSQL databases.
Whether or not these nodes or PostgreSQL servers are managed by Pigsty, with simple configuration, you immediately have a production-grade monitoring and alerting system, bringing existing hosts and PostgreSQL under management.

HA PostgreSQL Clusters
Pigsty helps you own your own production-grade HA PostgreSQL RDS service anywhere.
To create such an HA PostgreSQL cluster/RDS service, you simply describe it with a short config and run the playbook to create it:
pg-test:
  hosts:
    10.10.10.11: { pg_seq: 1, pg_role: primary }
    10.10.10.12: { pg_seq: 2, pg_role: replica }
    10.10.10.13: { pg_seq: 3, pg_role: replica }
  vars: { pg_cluster: pg-test }
$ bin/pgsql-add pg-test # Initialize cluster 'pg-test'
In less than 10 minutes, you’ll have a PostgreSQL database cluster with service access, monitoring, backup PITR, and HA fully configured.
Hardware failures are covered by the self-healing HA architecture provided by patroni, etcd, and haproxy—in case of primary failure, automatic failover executes within 30 seconds by default.
Clients don’t need to modify config or restart applications: Haproxy uses patroni health checks for traffic distribution, and read-write requests are automatically routed to the new cluster primary, avoiding split-brain issues.
This process is seamless—for example, in case of replica failure or planned switchover, clients experience only a momentary flash of the current query.
Software failures, human errors, and datacenter-level disasters are covered by pgbackrest and the optional MinIO cluster. This provides local/cloud PITR capabilities and, in case of datacenter failure, offers cross-region replication and disaster recovery.
1 - Nodes
A node is an abstraction of hardware/OS resources - physical machines, bare metal, VMs, or containers/pods.
A node is an abstraction of hardware/OS resources. It can be a physical machine, bare metal, virtual machine, or container/pod.
Any machine running a Linux OS with systemd and standard CPU/memory/disk/network resources can be treated as a node.
Nodes can have modules installed. Pigsty has several node types, distinguished by which modules are deployed:
In a singleton Pigsty deployment, multiple roles converge on one node: it serves as the regular node, admin node, infra node, ETCD node, and database node simultaneously.
Regular Node
Nodes managed by Pigsty can have modules installed. The node.yml playbook configures nodes to the desired state.
A regular node may run the following services:
| Component | Port | Description | Status |
|---|
node_exporter | 9100 | Host metrics exporter | Enabled |
haproxy | 9101 | HAProxy load balancer (admin port) | Enabled |
vector | 9598 | Log collection agent | Enabled |
docker | 9323 | Container runtime support | Optional |
keepalived | n/a | L2 VIP for node cluster | Optional |
keepalived_exporter | 9650 | Keepalived status monitor | Optional |
Here, node_exporter exposes host metrics, vector sends logs to the collection system, and haproxy provides load balancing. These three are enabled by default.
Docker, keepalived, and keepalived_exporter are optional and can be enabled as needed.
ADMIN Node
A Pigsty deployment has exactly one admin node—the node that runs Ansible playbooks and issues control/deployment commands.
This node has ssh/sudo access to all other nodes. Admin node security is critical; ensure access is strictly controlled.
During single-node installation and configuration, the current node becomes the admin node.
However, alternatives exist. For example, if your laptop can SSH to all managed nodes and has Ansible installed, it can serve as the admin node—though this isn’t recommended for production.
For instance, you might use your laptop to manage a Pigsty VM in the cloud. In this case, your laptop is the admin node.
In serious production environments, the admin node is typically 1-2 dedicated DBA machines. In resource-constrained setups, INFRA nodes often double as admin nodes since all INFRA nodes have Ansible installed by default.
INFRA Node
A Pigsty deployment may have 1 or more INFRA nodes; large production environments typically have 2-3.
The infra group in the inventory defines which nodes are INFRA nodes. These nodes run the INFRA module with these components:
| Component | Port | Description |
|---|
nginx | 80/443 | Web UI, local software repository |
grafana | 3000 | Visualization platform |
victoriaMetrics | 8428 | Time-series database (metrics) |
victoriaLogs | 9428 | Log collection server |
victoriaTraces | 10428 | Trace collection server |
vmalert | 8880 | Alerting and derived metrics |
alertmanager | 9093 | Alert aggregation and routing |
blackbox_exporter | 9115 | Blackbox probing (ping nodes/VIPs) |
dnsmasq | 53 | Internal DNS resolution |
chronyd | 123 | NTP time server |
ansible | - | Playbook execution |
Nginx serves as the module’s entry point, providing the web UI and local software repository.
With multiple INFRA nodes, services on each are independent, but you can access all monitoring data sources from any INFRA node’s Grafana.
Note: The INFRA module is licensed under AGPLv3 due to Grafana.
As an exception, if you only use Nginx/Victoria components without Grafana, you’re effectively under Apache-2.0.
ETCD Node
The ETCD module provides Distributed Consensus Service (DCS) for PostgreSQL high availability.
The etcd group in the inventory defines ETCD nodes. These nodes run etcd servers on two ports:
| Component | Port | Description |
|---|
etcd | 2379 | ETCD key-value store (client port) |
etcd | 2380 | ETCD cluster peer communication |
MINIO Node
The MINIO module provides optional backup storage for PostgreSQL.
The minio group in the inventory defines MinIO nodes. These nodes run MinIO servers on:
| Component | Port | Description |
|---|
minio | 9000 | MinIO S3 API endpoint |
minio | 9001 | MinIO admin console |
PGSQL Node
Nodes with the PGSQL module are called PGSQL nodes. Node and PostgreSQL instance have a 1:1 deployment—one PG instance per node.
PGSQL nodes can borrow identity from their PostgreSQL instance—controlled by node_id_from_pg, defaulting to true, meaning the node name is set to the PG instance name.
PGSQL nodes run these additional components beyond regular node services:
| Component | Port | Description | Status |
|---|
postgres | 5432 | PostgreSQL database server | Enabled |
pgbouncer | 6432 | PgBouncer connection pool | Enabled |
patroni | 8008 | Patroni HA management | Enabled |
pg_exporter | 9630 | PostgreSQL metrics exporter | Enabled |
pgbouncer_exporter | 9631 | PgBouncer metrics exporter | Enabled |
pgbackrest_exporter | 9854 | pgBackRest metrics exporter | Enabled |
vip-manager | n/a | Binds L2 VIP to cluster primary | Optional |
{{ pg_cluster }}-primary | 5433 | HAProxy service: pooled read/write | Enabled |
{{ pg_cluster }}-replica | 5434 | HAProxy service: pooled read-only | Enabled |
{{ pg_cluster }}-default | 5436 | HAProxy service: primary direct connection | Enabled |
{{ pg_cluster }}-offline | 5438 | HAProxy service: offline read | Enabled |
{{ pg_cluster }}-<service> | 543x | HAProxy service: custom PostgreSQL services | Custom |
The vip-manager is only enabled when users configure a PG VIP.
Additional custom services can be defined in pg_services, exposed via haproxy using additional service ports.
Node Relationships
Regular nodes typically reference an INFRA node via the admin_ip parameter as their infrastructure provider.
For example, with global admin_ip = 10.10.10.10, all nodes use infrastructure services at this IP.
Parameters that reference ${admin_ip}:
Typically the admin node and INFRA node coincide. With multiple INFRA nodes, the admin node is usually the first one; others serve as backups.
In large-scale production deployments, you might separate the Ansible admin node from INFRA module nodes.
For example, use 1-2 small dedicated hosts under the DBA team as the control hub (ADMIN nodes), and 2-3 high-spec physical machines as monitoring infrastructure (INFRA nodes).
Typical node counts by deployment scale:
| Scale | ADMIN | INFRA | ETCD | MINIO | PGSQL |
|---|
| Single-node | 1 | 1 | 1 | 0 | 1 |
| 3-node | 1 | 3 | 3 | 0 | 3 |
| Small prod | 1 | 2 | 3 | 0 | N |
| Large prod | 2 | 3 | 5 | 4+ | N |
2 - PGSQL Architecture
PostgreSQL module component interactions and data flow.
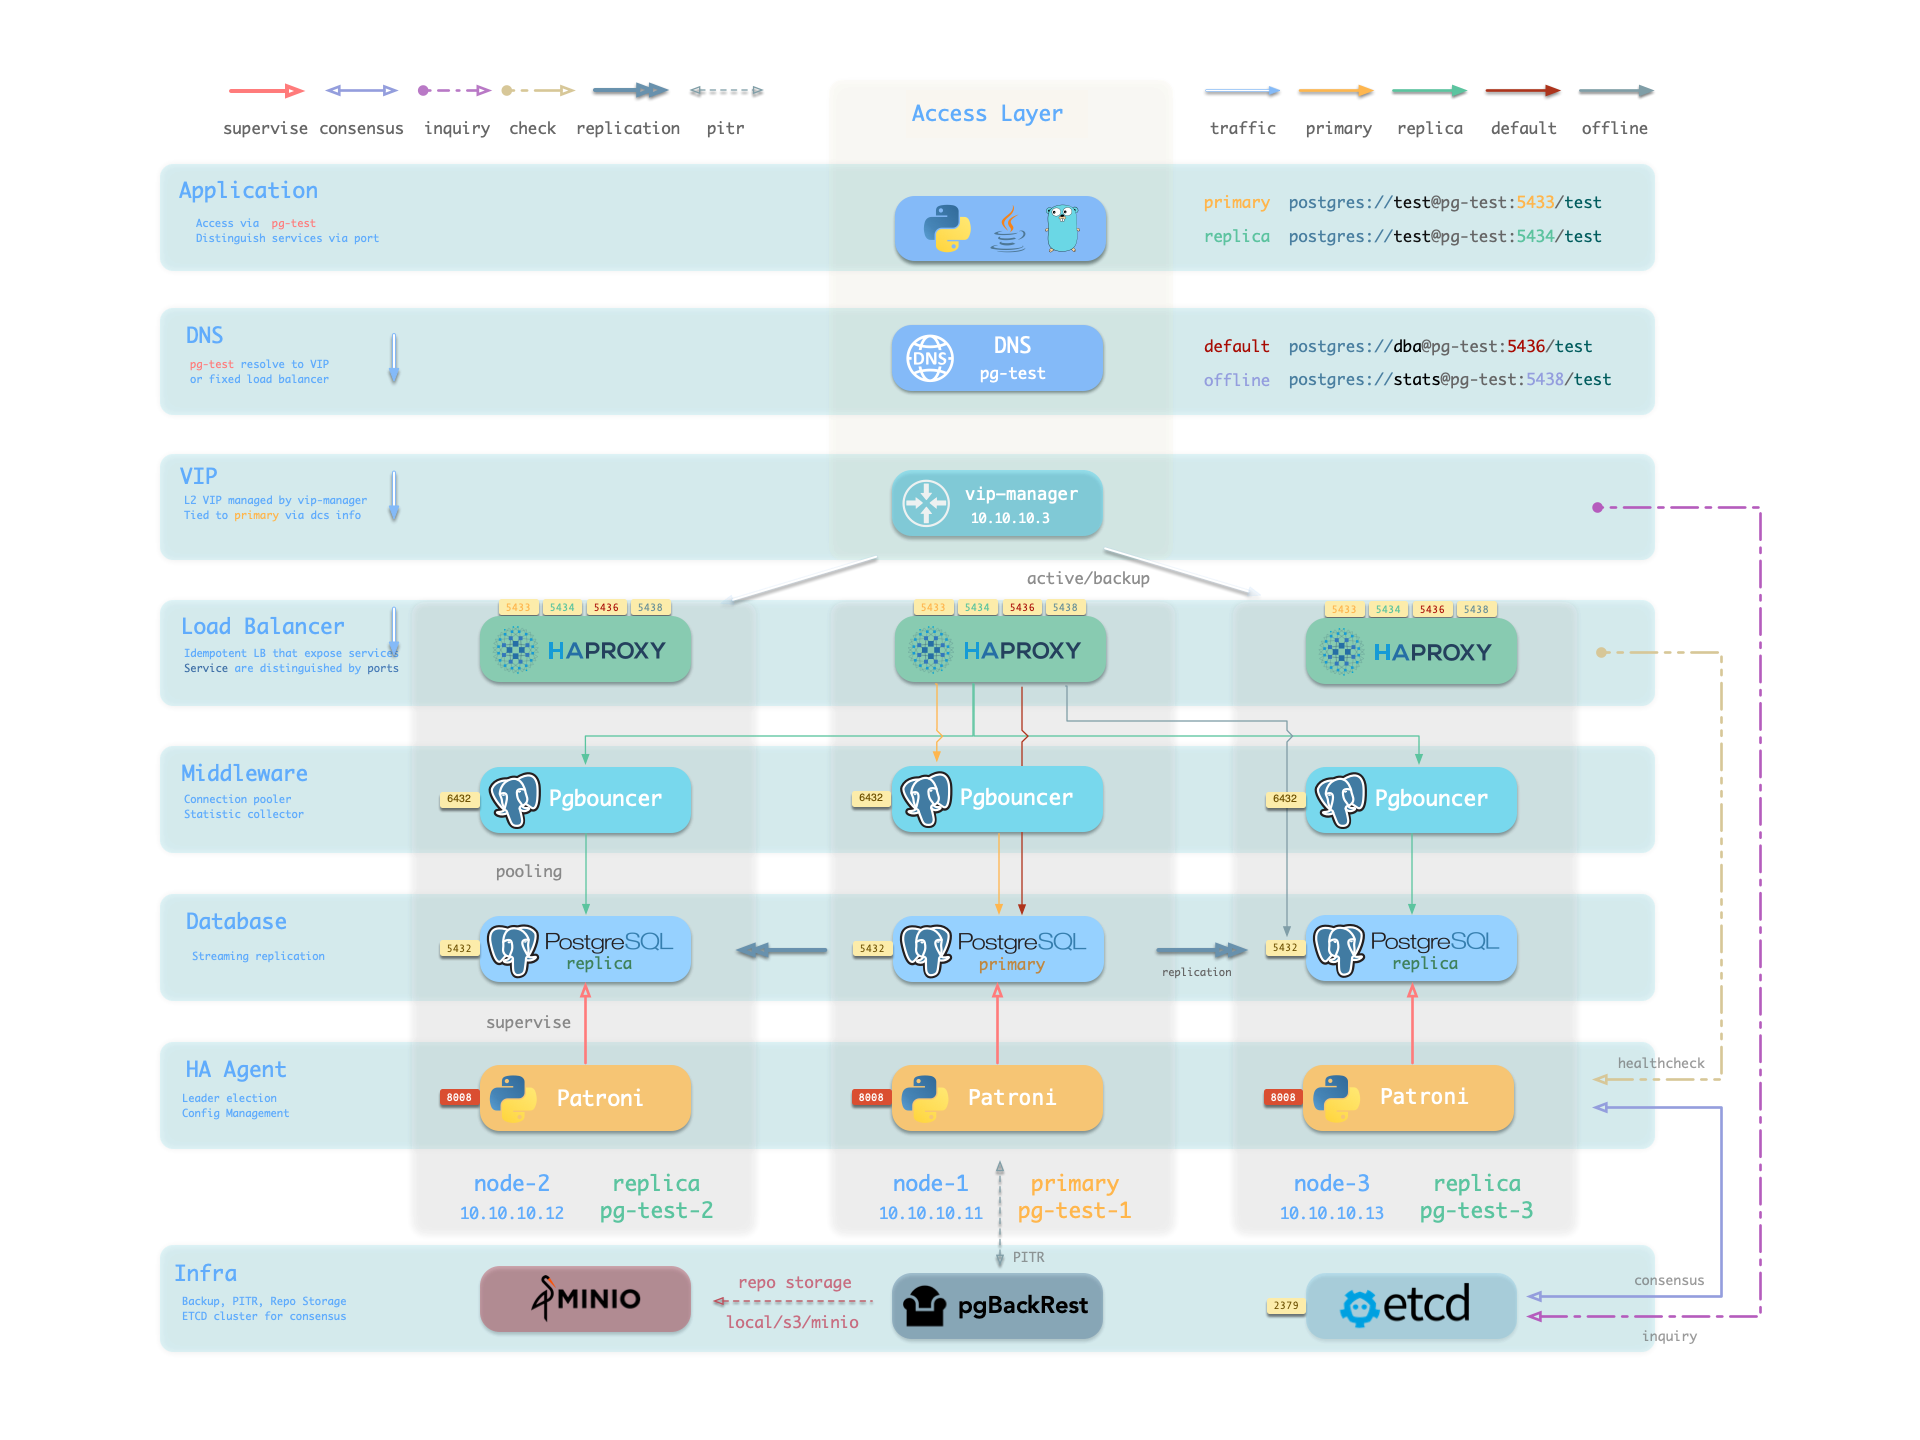
The PGSQL module organizes PostgreSQL in production as clusters—logical entities composed of a group of database instances associated by primary-replica relationships.
Each cluster is an autonomous business unit consisting of at least one primary instance, exposing capabilities through services.
There are four core entities in Pigsty’s PGSQL module:
- Cluster: An autonomous PostgreSQL business unit serving as the top-level namespace for other entities.
- Service: A named abstraction that exposes capabilities, routes traffic, and exposes services using node ports.
- Instance: A single PostgreSQL server consisting of running processes and database files on a single node.
- Node: A hardware resource abstraction running Linux + Systemd environment—can be bare metal, VM, container, or Pod.
Along with two business entities—“Database” and “Role”—these form the complete logical view as shown below:
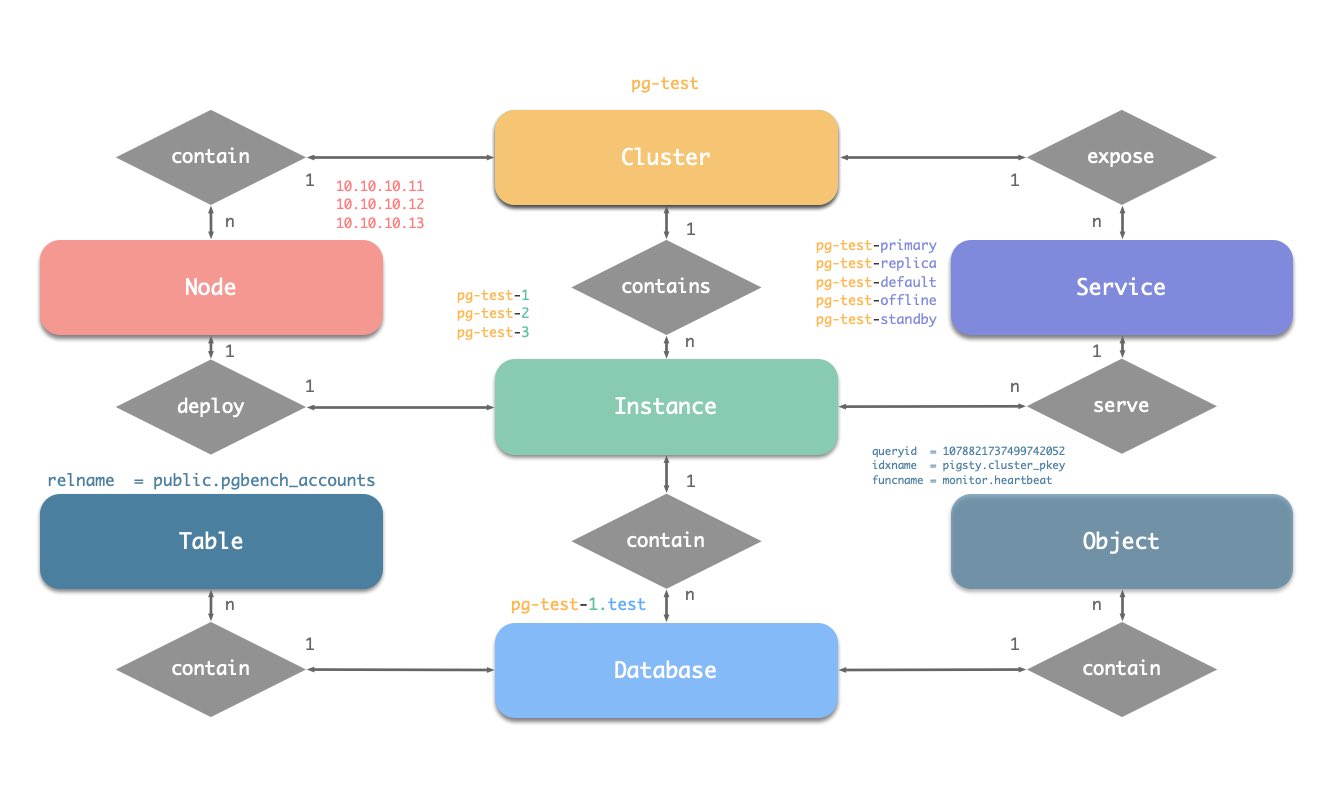
Naming Conventions (following Pigsty’s early constraints)
- Cluster names should be valid DNS domain names without any dots, regex:
[a-zA-Z0-9-]+ - Service names should be prefixed with the cluster name and suffixed with specific words:
primary, replica, offline, delayed, connected by -. - Instance names are prefixed with the cluster name and suffixed with a positive integer instance number, connected by
-, e.g., ${cluster}-${seq}. - Nodes are identified by their primary internal IP address; since databases and hosts are deployed 1:1 in the PGSQL module, hostnames typically match instance names.
3 - INFRA Arch
Infrastructure architecture, components and functionality in Pigsty.
Running production-grade, highly available PostgreSQL clusters typically requires a comprehensive set of infrastructure services (foundation) for support, such as monitoring and alerting, log collection, time synchronization, DNS resolution, and local software repositories.
Pigsty provides the INFRA module to solve this problem — it’s an optional module, but we strongly recommend enabling it.
Overview
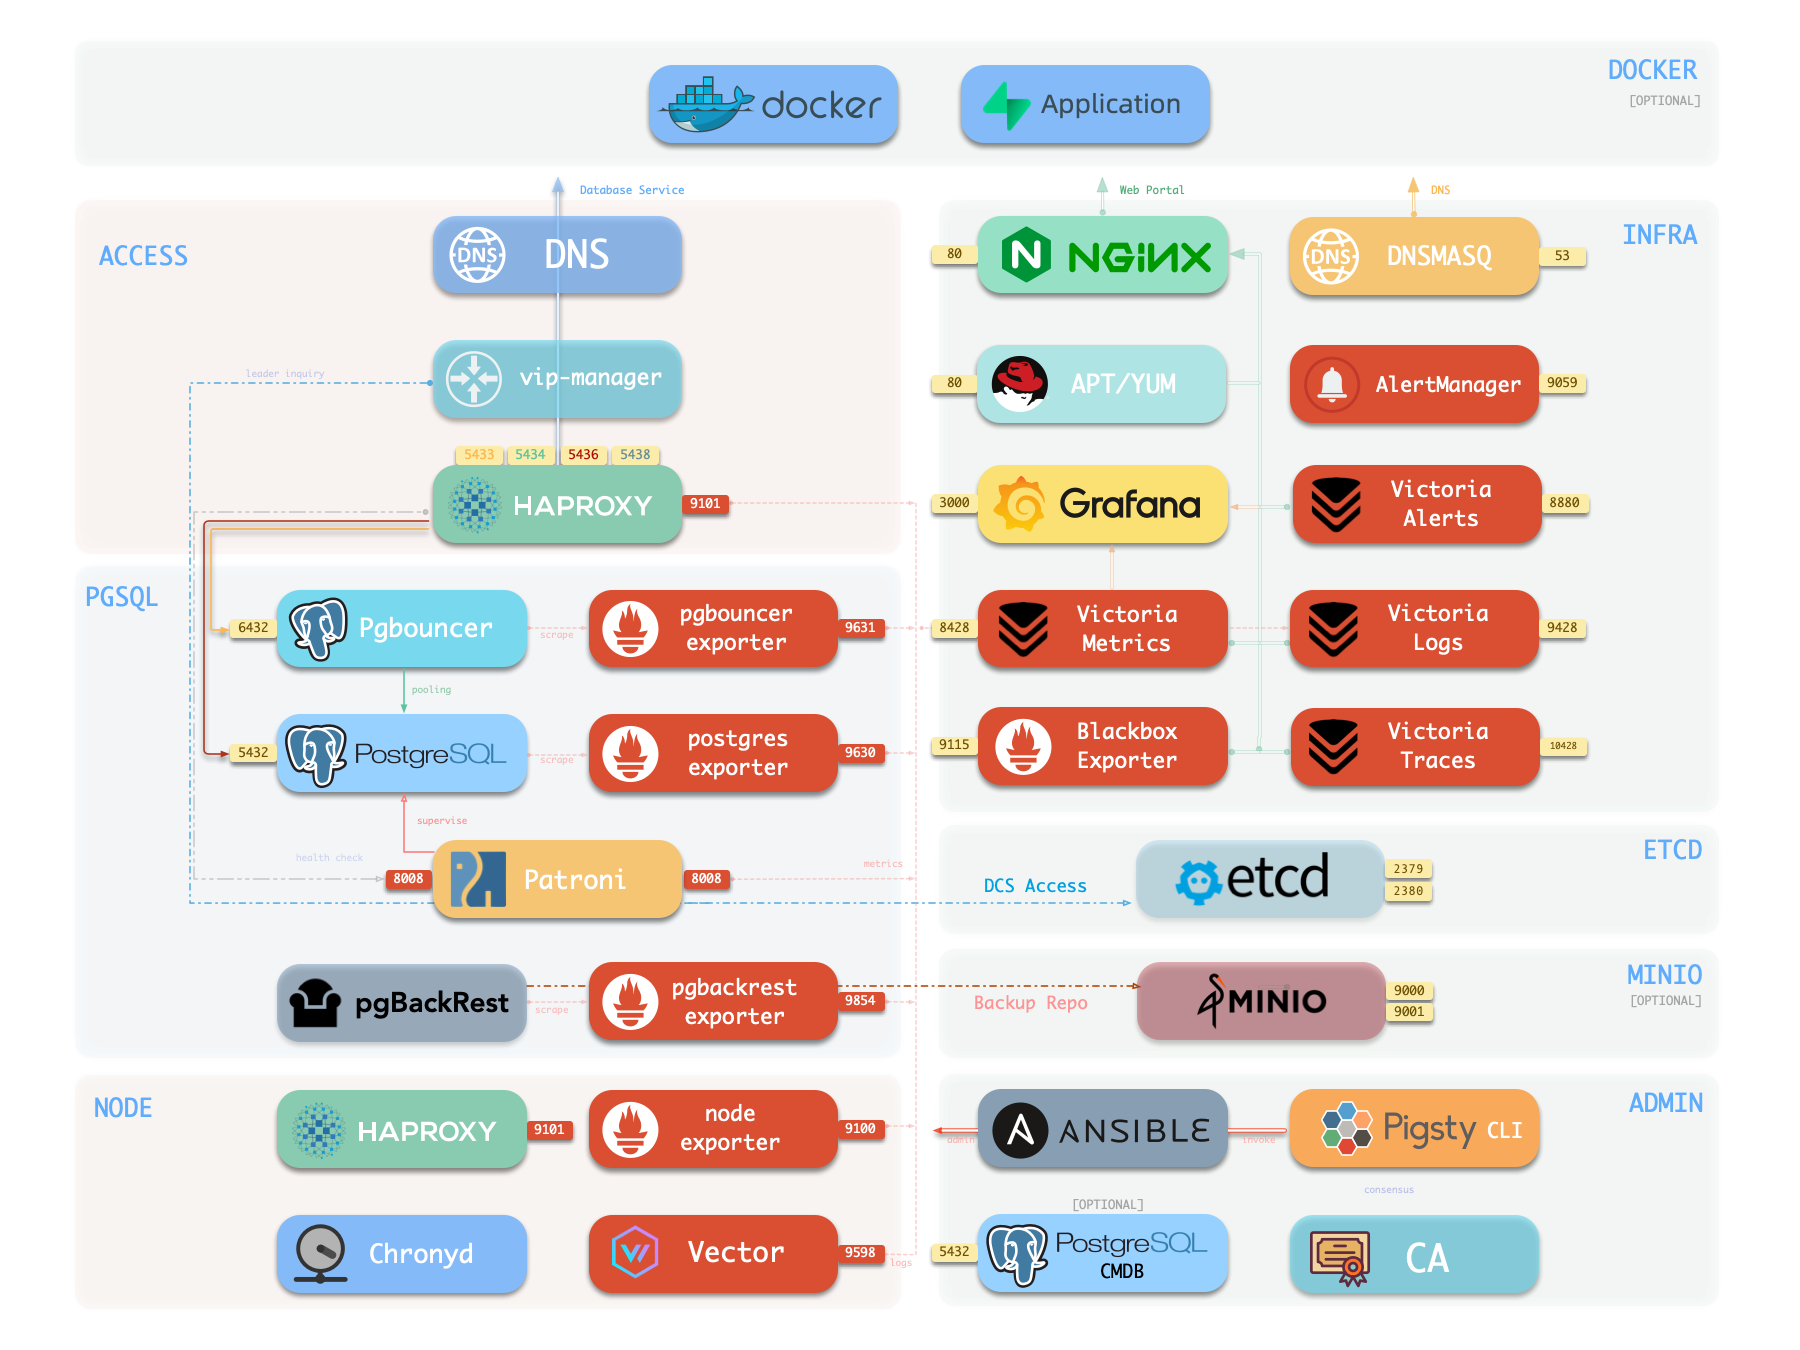
The diagram below shows the architecture of a single-node deployment. The right half represents the components included in the INFRA module:
| Component | Type | Description |
|---|
| Nginx | Web Server | Unified entry for WebUI, local repo, reverse proxy |
| CA | Certificate | Issues encryption certificates within the environment |
| Grafana | Visualization | Presents metrics, logs, and traces; hosts dashboards, reports, and custom data apps |
| VictoriaMetrics | Time Series DB | Scrapes all metrics, Prometheus API compatible, provides VMUI query interface |
| VictoriaLogs | Log Platform | Centralized log storage; all nodes run Vector by default, pushing logs here |
| VictoriaTraces | Tracing | Collects slow SQL, service traces, and other tracing data |
| VMAlert | Alert Engine | Evaluates alerting rules, pushes events to Alertmanager |
| AlertManager | Alert Manager | Aggregates alerts, dispatches notifications via email, Webhook, etc. |
| BlackboxExporter | Blackbox Probe | Probes reachability of IPs/VIPs/URLs |
| DNSMASQ | DNS Service | Provides DNS resolution for domains used within Pigsty [Optional] |
| Chronyd | Time Sync | Provides NTP time synchronization to ensure all nodes have consistent time [Optional] |
Nginx
Nginx is the access entry point for all WebUI services in Pigsty, using ports 80 / 443 for HTTP/HTTPS by default. Live Demo
Infrastructure components with WebUIs can be exposed uniformly through Nginx, such as Grafana, VictoriaMetrics (VMUI), AlertManager,
and HAProxy console. Additionally, local yum/apt repo and other static resources are served internally via Nginx.
Nginx configures local web servers or reverse proxy servers based on definitions in infra_portal.
infra_portal:
  home : { domain: i.pigsty }
By default, it exposes Pigsty’s admin homepage: i.pigsty. You can expose more services; see Nginx Management for details.
Pigsty allows rich customization of Nginx as a local file server or reverse proxy, with self-signed or real HTTPS certificates.
For more information, see: Tutorial: Nginx—Expose Web Services via Proxy and Tutorial: Certbot—Request and Renew HTTPS Certificates

Local Software Repository
Pigsty creates a local software repository on the Infra node during installation to accelerate subsequent software installations. Live Demo
This repository defaults to the /www/pigsty directory,
served by Nginx, mounted at the /pigsty path, accessible via ports 80/443.
http://<admin_ip>/pigsty / http://i.pigsty/pigsty
Pigsty supports offline installation, which essentially pre-copies a prepared local software repository to the target environment.
When Pigsty performs production deployment and needs to create a local software repository, if it finds the /www/pigsty/repo_complete marker file already exists locally, it skips downloading packages from upstream and uses existing packages directly, avoiding internet downloads.
For more information, see: Config: INFRA - REPO
Grafana
Grafana is the core component of Pigsty’s monitoring system, used for visualizing metrics, logs, and various information. Demo
It listens on port 3000 by default, accessible via IP:3000 or http://g.pigsty.
Pigsty provides pre-built Dashboards based on VictoriaMetrics/Logs/Traces, with one-click drill-down and roll-up via URL jumps for rapid troubleshooting.
Grafana can also serve as a low-code visualization platform, so ECharts, victoriametrics-datasource, victorialogs-datasource plugins are installed by default, with Vector/Victoria datasources registered uniformly as vmetrics-*, vlogs-*, vtraces-* for easy custom dashboard extension.
For more information, see: Config: INFRA - GRAFANA.
Victoria Observability Suite
Pigsty v4.0 uses VictoriaMetrics components to replace Prometheus/Loki, providing a unified observability platform:
- VictoriaMetrics: Listens on port
8428 by default, accessible via http://p.pigsty or https://i.pigsty/vmetrics/ for VMUI, compatible with PromQL, remote read/write protocols, and Alertmanager API. - VMAlert: Runs alerting rules on port
8880, sends events to Alertmanager. - VictoriaLogs: Listens on port
9428 by default, searchable via https://i.pigsty/vlogs/. Node-side Vector pushes system logs, PostgreSQL logs, etc. structured here. - VictoriaTraces: Listens on port
10428, provides Jaeger-compatible interface for slow SQL and trace analysis. - Alertmanager: Listens on port
9059, accessible via http://a.pigsty or https://i.pigsty/alertmgr/ for alert routing and notification management. - Blackbox Exporter: Listens on port
9115 by default, responsible for ICMP/TCP/HTTP blackbox probing.
For more information, see: Config: INFRA - VICTORIA and Config: INFRA - PROMETHEUS.
Ansible
Pigsty installs Ansible on the meta node by default. Ansible is a popular ops tool with declarative config style and idempotent playbook design, greatly reducing system maintenance complexity.
DNSMASQ
DNSMASQ provides DNS resolution within the environment; domains from other modules are registered with the DNSMASQ service on INFRA nodes.
DNS records are placed in the /etc/hosts.d/ directory on all INFRA nodes by default.
For more information, see: Config: INFRA - DNS and Tutorial: DNS—Configure Domain Resolution
Chronyd
NTP service synchronizes time across all nodes in the environment (optional).
For more information, see: Config: NODES - NTP
Others
A standard Pigsty deployment includes an INFRA module that provides services for managed nodes and database clusters:
The INFRA module is not mandatory for HA PostgreSQL—for example, in slim install mode, the Infra module is not installed.
However, the INFRA module provides essential supporting services for running production-grade HA PostgreSQL clusters; it’s strongly recommended to enable it for the complete Pigsty DBaaS experience.
If you already have your own infrastructure (Nginx, local repo, monitoring system, DNS, NTP), you can disable the INFRA module and modify config to use existing infrastructure.
| Component | Port | Default Domain | Description |
|---|
| Nginx | 80/443 | i.pigsty | Web portal, local repo |
| Grafana | 3000 | g.pigsty | Visualization platform |
| VictoriaMetrics | 8428 | p.pigsty | Time series DB (VMUI, Prometheus compatible) |
| VictoriaLogs | 9428 | - | Log database (receives Vector push) |
| VictoriaTraces | 10428 | - | Trace / slow SQL storage |
| VMAlert | 8880 | - | Metrics computation, alerting rules |
| AlertManager | 9059 | a.pigsty | Alert aggregation and dispatch |
| BlackboxExporter | 9115 | - | Blackbox monitoring probes |
| DNSMasq | 53 | - | DNS server |
| Chronyd | 123 | - | NTP time server |