This is the multi-page printable view of this section. .
Module: INFRA
- 1: Configuration
- 2: Parameters
- 3: Playbook
- 4: Monitoring
- 5: Metrics
- 6: FAQ
- 7: Administration
Configuration | Administration | Playbooks | Monitoring | Parameters
Overview
Each Pigsty deployment includes infrastructure components that serve managed nodes and database clusters:
| Component | Port | Description |
|---|---|---|
| Nginx | 80/443 | Web service portal, local repo, and unified entry point |
| Grafana | 3000 | Visualization platform for monitoring dashboards and data apps |
| VictoriaMetrics | 8428 | Time-series database with VMUI, compatible with Prometheus API |
| VictoriaLogs | 9428 | Centralized log database, receives structured logs from Vector |
| VictoriaTraces | 10428 | Tracing and event storage for slow SQL / request tracing |
| VMAlert | 8880 | Alert rule evaluator, triggers alerts based on VictoriaMetrics metrics |
| AlertManager | 9059 | Alert aggregation and dispatch, receives notifications from VMAlert |
| BlackboxExporter | 9115 | ICMP/TCP/HTTP blackbox probing |
| DNSMASQ | 53 | DNS server for internal domain resolution |
| Chronyd | 123 | NTP time server |
| PostgreSQL | 5432 | CMDB and default database |
| Ansible | - | Runs playbooks, orchestrates all infrastructure |
In Pigsty, the PGSQL module uses some services on INFRA nodes, specifically:
- Database cluster/host node domains depend on DNSMASQ on INFRA nodes for resolution.
- Installing software on database nodes uses the local yum/apt repo hosted by Nginx on INFRA nodes.
- VictoriaMetrics on INFRA nodes collects and stores database cluster and node metrics. Access them through VMUI / PromQL.
- Vector collects database and node runtime logs and sends them to VictoriaLogs on INFRA nodes. Search these logs in Grafana.
- VMAlert evaluates alert rules based on metrics in VictoriaMetrics and forwards events to Alertmanager.
- Users initiate management of database nodes from Infra/Admin nodes using Ansible or other tools:
- Execute cluster creation, scaling, instance/cluster recycling
- Create business users, databases, modify services, HBA changes;
- Execute log collection, garbage cleanup, backup, inspections, etc.
- Database nodes sync time from the NTP server on INFRA/ADMIN nodes by default
- If no dedicated cluster exists, the HA component Patroni uses etcd on INFRA nodes as the HA DCS.
- If no dedicated cluster exists, the backup component pgbackrest uses MinIO on INFRA nodes as an optional centralized backup repository.
Nginx
Nginx provides access to all Pigsty WebUI services. It uses port 80 on the admin node by default.
Nginx exposes infrastructure WebUIs, including Grafana, VictoriaMetrics (VMUI), AlertManager, and HAProxy traffic management pages. It also serves static files, including yum/apt repositories.
Nginx exposes built-in Web services through subpaths under i.pigsty by default. The infra_portal configuration also lets Nginx route requests to upstream components by domain name.
If you use other domains or public domains, you can modify them here:
Pigsty strongly recommends using domain names to access Pigsty UI systems rather than direct IP+port access, for these reasons:
- Domains simplify HTTPS encryption and centralize access through Nginx. They also simplify request auditing and authentication integration.
- Some components only listen on 127.0.0.1 by default, so they can only be accessed through Nginx proxy.
- Domain names are easier to remember and provide additional configuration flexibility.
Without internet domains or local DNS, add static resolution records on the client. Use /etc/hosts on MacOS/Linux or C:\Windows\System32\drivers\etc\hosts on Windows.
Nginx configuration parameters are at: Configuration: INFRA - NGINX
Local Software Repository
Pigsty creates a local software repository during installation to accelerate subsequent software installation.
Nginx serves this repository. Its default directory is /www/pigsty, and its URL is http://i.pigsty/pigsty.
A Pigsty offline bundle is a compressed prebuilt RPM/APT repository directory. The current source uses SOW to create repositories. If /www/pigsty/repo_complete exists, Pigsty treats the local repository as complete and skips upstream downloads. This file contains SHA-256 checksums. It is not an empty marker.
The repo definition file is at /www/pigsty.repo, accessible by default via http://${admin_ip}/pigsty.repo
You can also use the file local repo directly without Nginx:
Local repository configuration parameters are at: Configuration: INFRA - REPO
Victoria Observability Suite
Pigsty v4 replaces Prometheus/Loki with the VictoriaMetrics family. These components provide integrated monitoring, logging, and tracing:
- VictoriaMetrics listens on port
8428by default. Access VMUI athttps://i.pigsty/vmetrics/. Its API is compatible with Prometheus. You can also configure a dedicated domain ininfra_portal. - VMAlert evaluates alert rules in
/infra/rules/*.yml, listens on port8880, and sends alert events to Alertmanager. - VictoriaLogs listens on port
9428. Query logs throughhttps://i.pigsty/vlogs/. All nodes run Vector by default to send structured system logs, PostgreSQL logs, and other logs to VictoriaLogs. - VictoriaTraces listens on port
10428for slow SQL / Trace collection. Grafana accesses it as a Jaeger datasource. - Alertmanager listens on port
9059. Manage alert notifications athttps://i.pigsty/alertmgr/. To use a dedicated domain, configurea.pigstyininfra_portal. Configure SMTP, Webhook, or another receiver to send notifications. - Blackbox Exporter listens on port
9115by default for Ping/TCP/HTTP probing, accessible viahttps://i.pigsty/blackbox/.
For more information, see: Configuration: INFRA - VICTORIA and Configuration: INFRA - PROMETHEUS.
Grafana
Grafana is the core of Pigsty’s WebUI. It listens on port 3000 by default. Access it through https://i.pigsty/ui/ or directly at IP:3000. To use a dedicated domain, configure g.pigsty in infra_portal.
Pigsty includes preconfigured VictoriaMetrics / Logs / Traces datasources: vmetrics-*, vlogs-*, and vtraces-*. It also includes many dashboards with URL-based navigation to help locate problems quickly.
Grafana also serves as a general low-code visualization platform. Pigsty installs plugins such as ECharts and victoriametrics-datasource by default. Use these plugins to build monitoring dashboards or inspection reports.
Grafana configuration parameters are at: Configuration: INFRA - GRAFANA.
Ansible
Pigsty installs Ansible on the meta node by default. Ansible uses declarative configuration and idempotent playbooks. These features reduce system maintenance complexity.
DNSMASQ
DNSMASQ provides DNS resolution services within the environment. Domain names from other modules are registered with the DNSMASQ service on INFRA nodes.
DNS records are placed by default in the /etc/dnsmasq.d/pigsty/ directory on all INFRA nodes.
DNSMASQ configuration parameters are at: Configuration: INFRA - DNS
Chronyd
NTP service synchronizes time across all nodes in the environment (optional)
NTP configuration parameters are at: Configuration: NODES - NTP
PostgreSQL
Pigsty’s metadata database (CMDB) usually runs on PostgreSQL, listening on port 5432 by default. It stores Pigsty metadata and backs several built-in applications.
For details, see the PGSQL module and Configuration: INFRA - META.
Configuration
To install INFRA on a node, add it to the infra inventory group. Assign an instance number with infra_seq.
Then use the infra.yml playbook to initialize the INFRA module on the nodes.
Administration
Here are some administration tasks related to the INFRA module:
Install/Uninstall Infra Module
infra-rm.yml has no deletion safeguard. Without tags, it removes infra_data, nginx_data, nginx_home (default: /www), and /var/lib/grafana.
If you only need to stop services or deregister targets, use tags. See Playbooks for the complete removal scope.
Manage Local Software Repository
You can use the following playbook subtasks to manage the local yum repo on Infra nodes:
The most commonly used commands are:
Manage Infrastructure Components
You can use the following playbook subtasks to manage various infrastructure components on Infra nodes:
Other commonly used tasks include:
Playbooks
Pigsty provides three playbooks related to the INFRA module:
infra.yml: Initialize pigsty infrastructure on infra nodesinfra-rm.yml: Remove infrastructure components from infra nodesdeploy.yml: Deploy the NODE, INFRA, ETCD, MINIO, and PGSQL core chain in one pass
infra.yml
The INFRA module playbook infra.yml initializes pigsty infrastructure on INFRA nodes
Executing this playbook completes the following tasks
- Configure meta node directories and environment variables
- Download and build a local software repository to accelerate subsequent installation. (If using offline package, skip download phase)
- Add the current meta node as a regular node under Pigsty management
- Deploy infrastructure components including VictoriaMetrics/Logs/Traces, VMAlert, Grafana, Alertmanager, Blackbox Exporter, etc.
This playbook executes on INFRA nodes by default
- Pigsty uses the current node executing this playbook as Pigsty’s INFRA node and ADMIN node by default.
- During configuration, Pigsty marks the current node as the Infra/Admin node. It replaces
10.10.10.10in templates with the current node’s primary IP address. - Besides initiating management and hosting infrastructure, this node is no different from a regular managed node.
- In single-node installation, ETCD is also installed on this node to provide DCS service
Notes about this playbook
- This playbook is idempotent. Repeated execution wipes infrastructure components on meta nodes.
- To preserve historical monitoring data, first set
vmetrics_clean,vlogs_clean,vtraces_cleantofalse. - If
/www/pigsty/repo_completeexists, the playbook skips internet downloads. Full execution takes about 5-8 minutes, depending on machine configuration. - Downloading directly from upstream internet sources without offline package may take 10-20 minutes depending on your network conditions.

infra-rm.yml
The INFRA module playbook infra-rm.yml removes pigsty infrastructure from INFRA nodes
Common subtasks include:
Full execution has no deletion safeguard and removes infra_data, nginx_data, nginx_home (default: /www), and /var/lib/grafana. Back up any data you need before running it.
deploy.yml
The deploy.yml playbook deploys the NODE, INFRA, ETCD, MINIO, and PGSQL core chain on all nodes in one pass. Optional modules such as Docker, Redis, Kafka, native MySQL, JUICE, and VIBE require their own playbooks.
This playbook is described in more detail in Playbook: One-Time Installation.
Monitoring
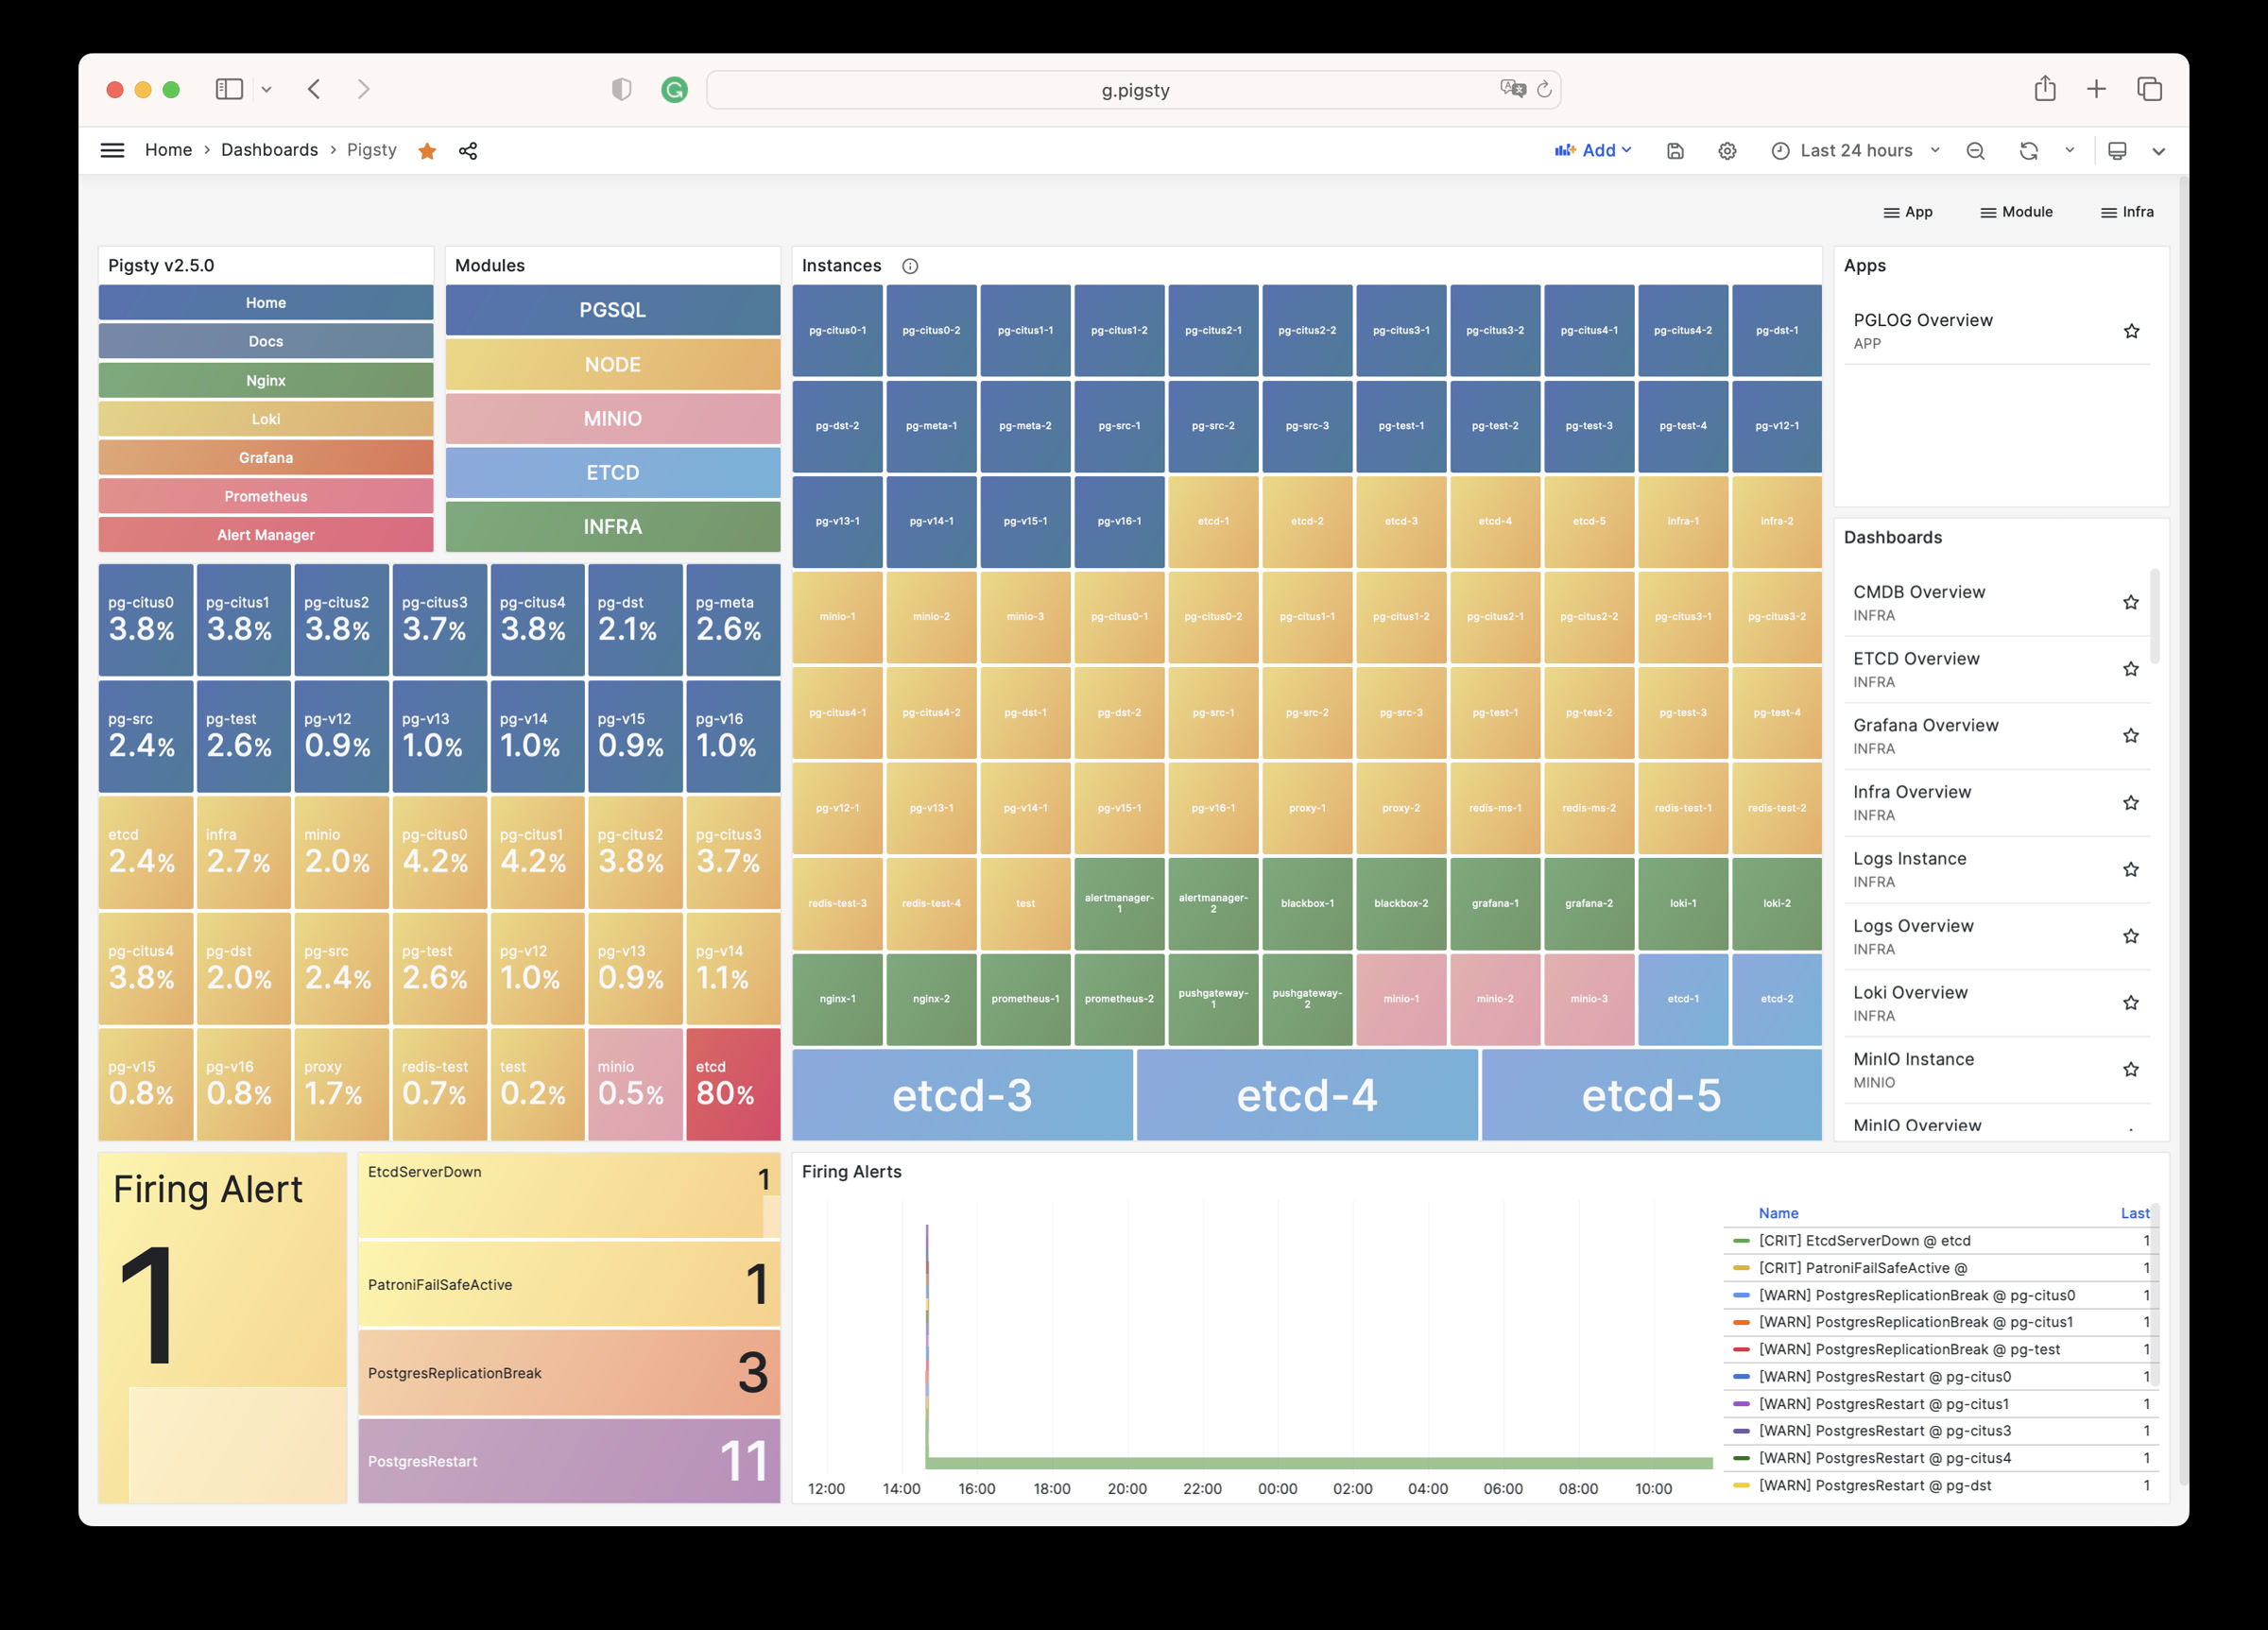
Pigsty Home: Pigsty monitoring system homepage
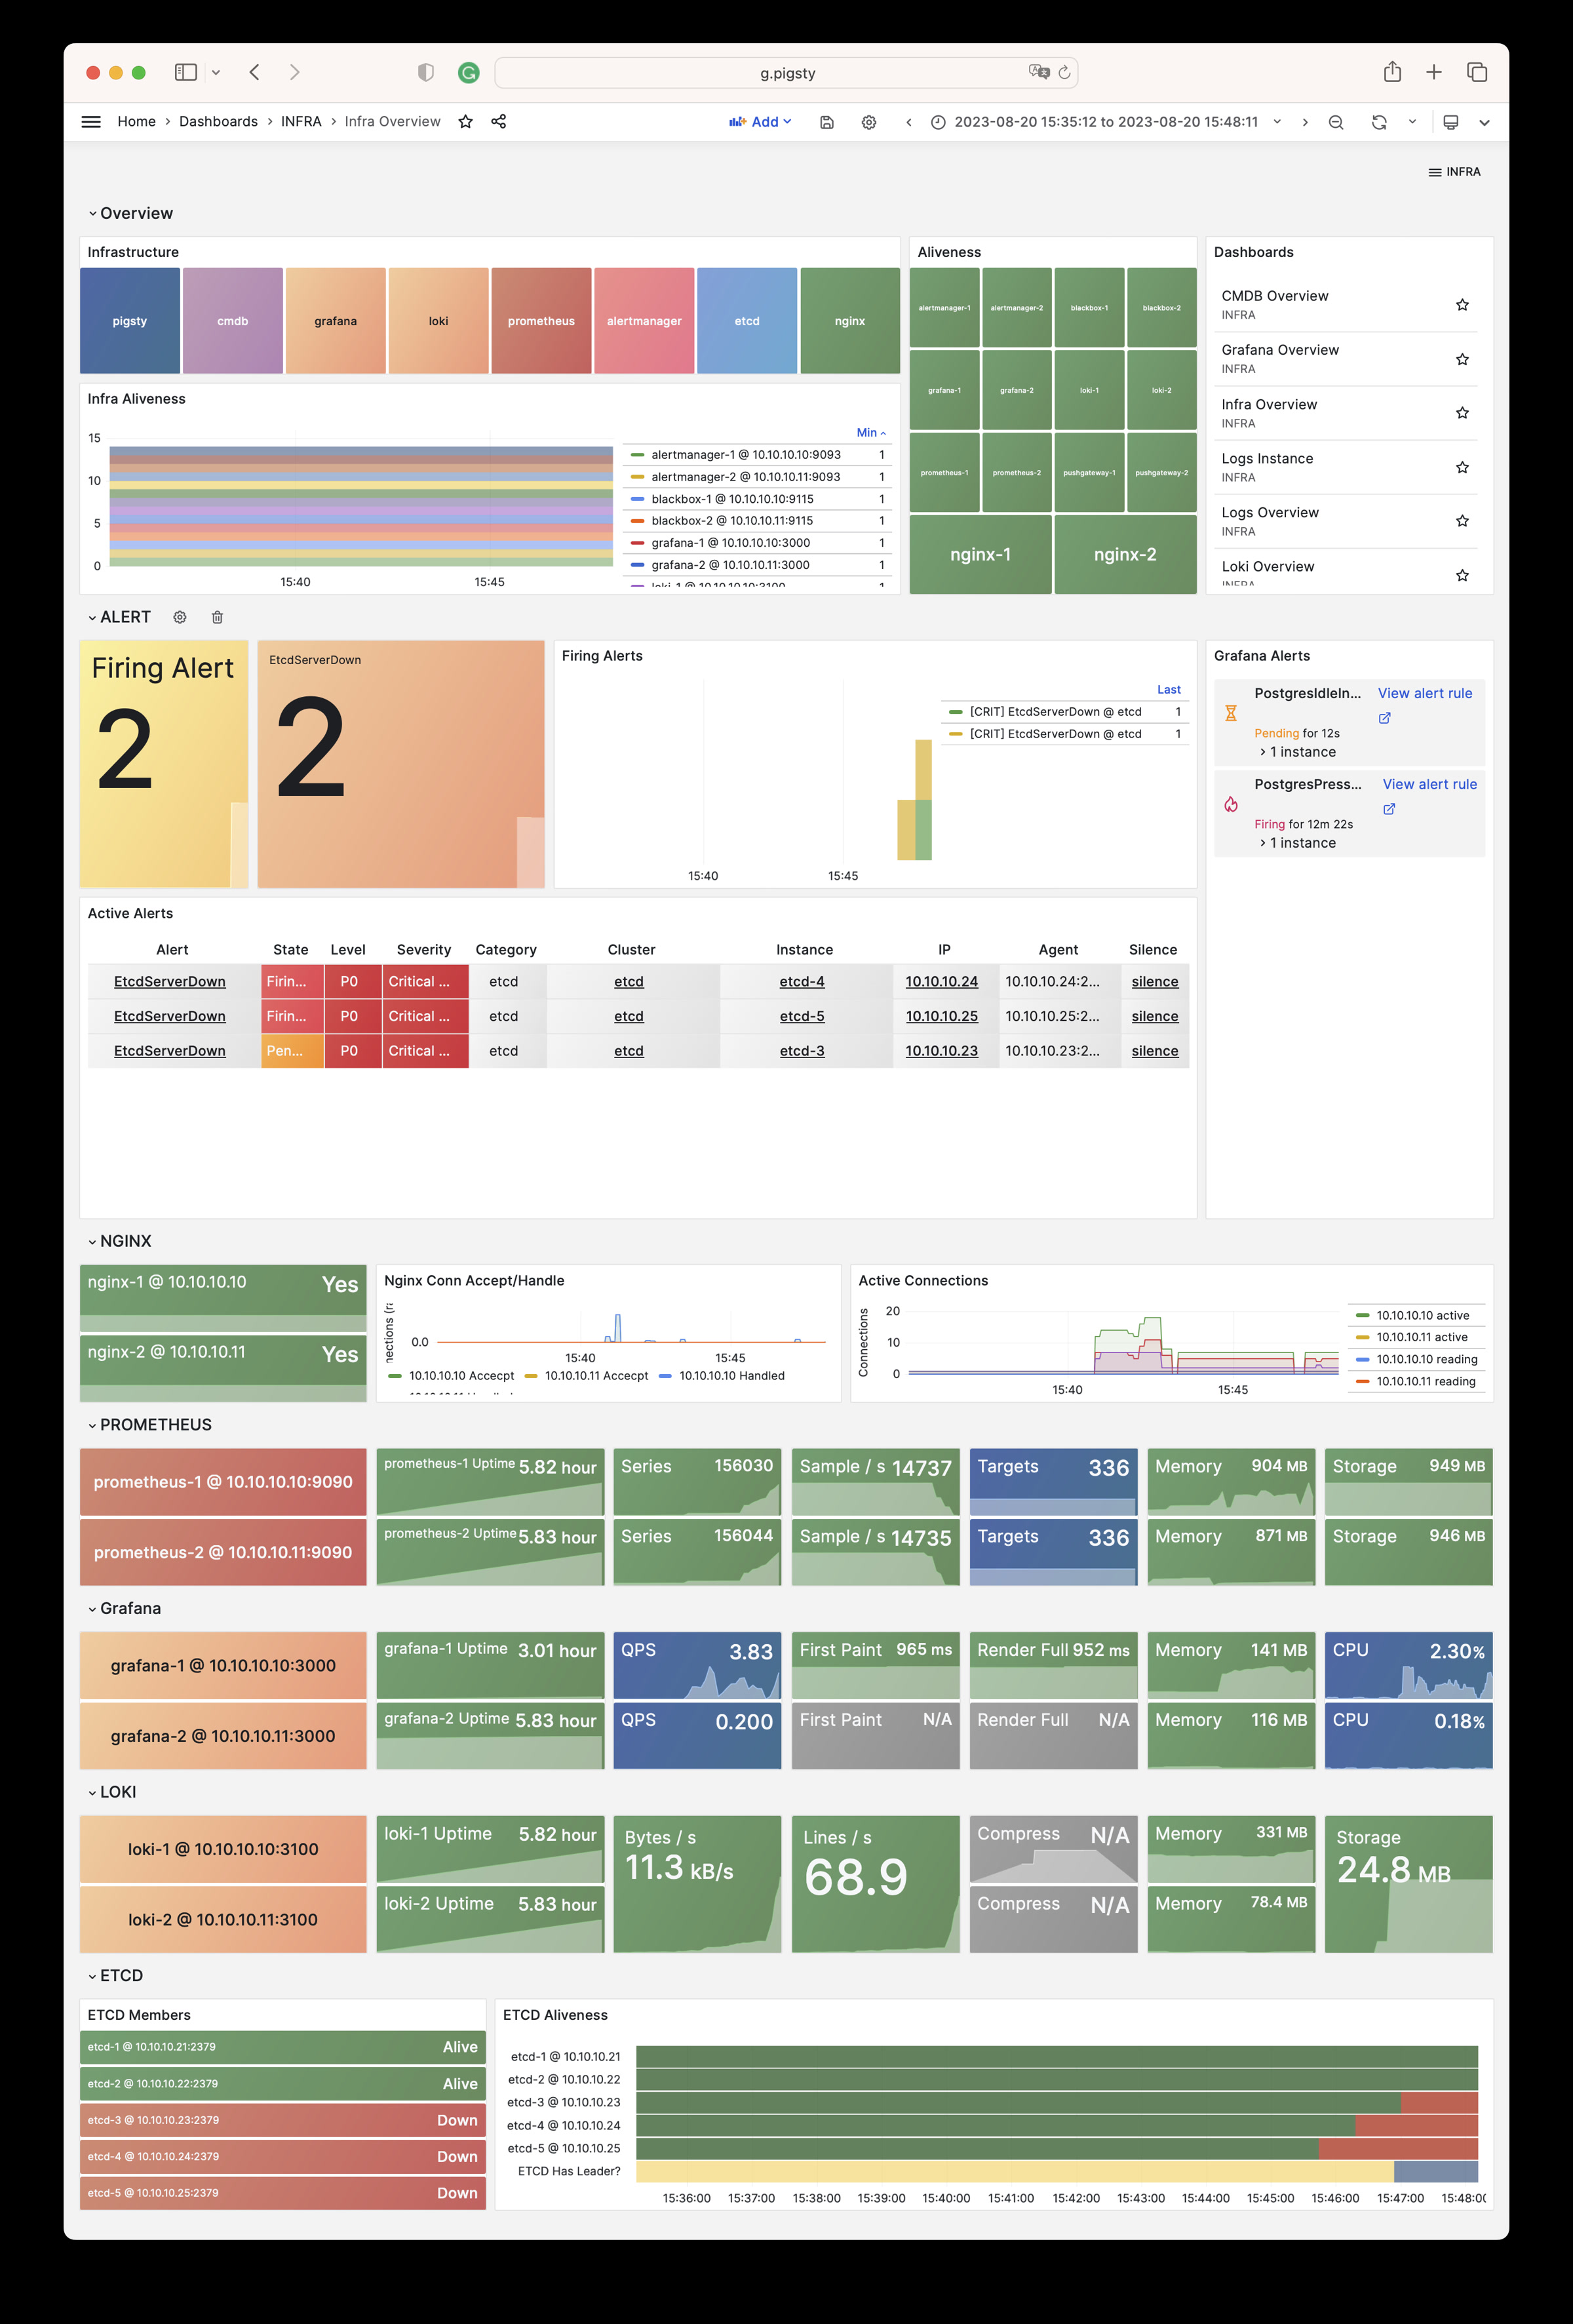
INFRA Overview: Pigsty infrastructure self-monitoring overview
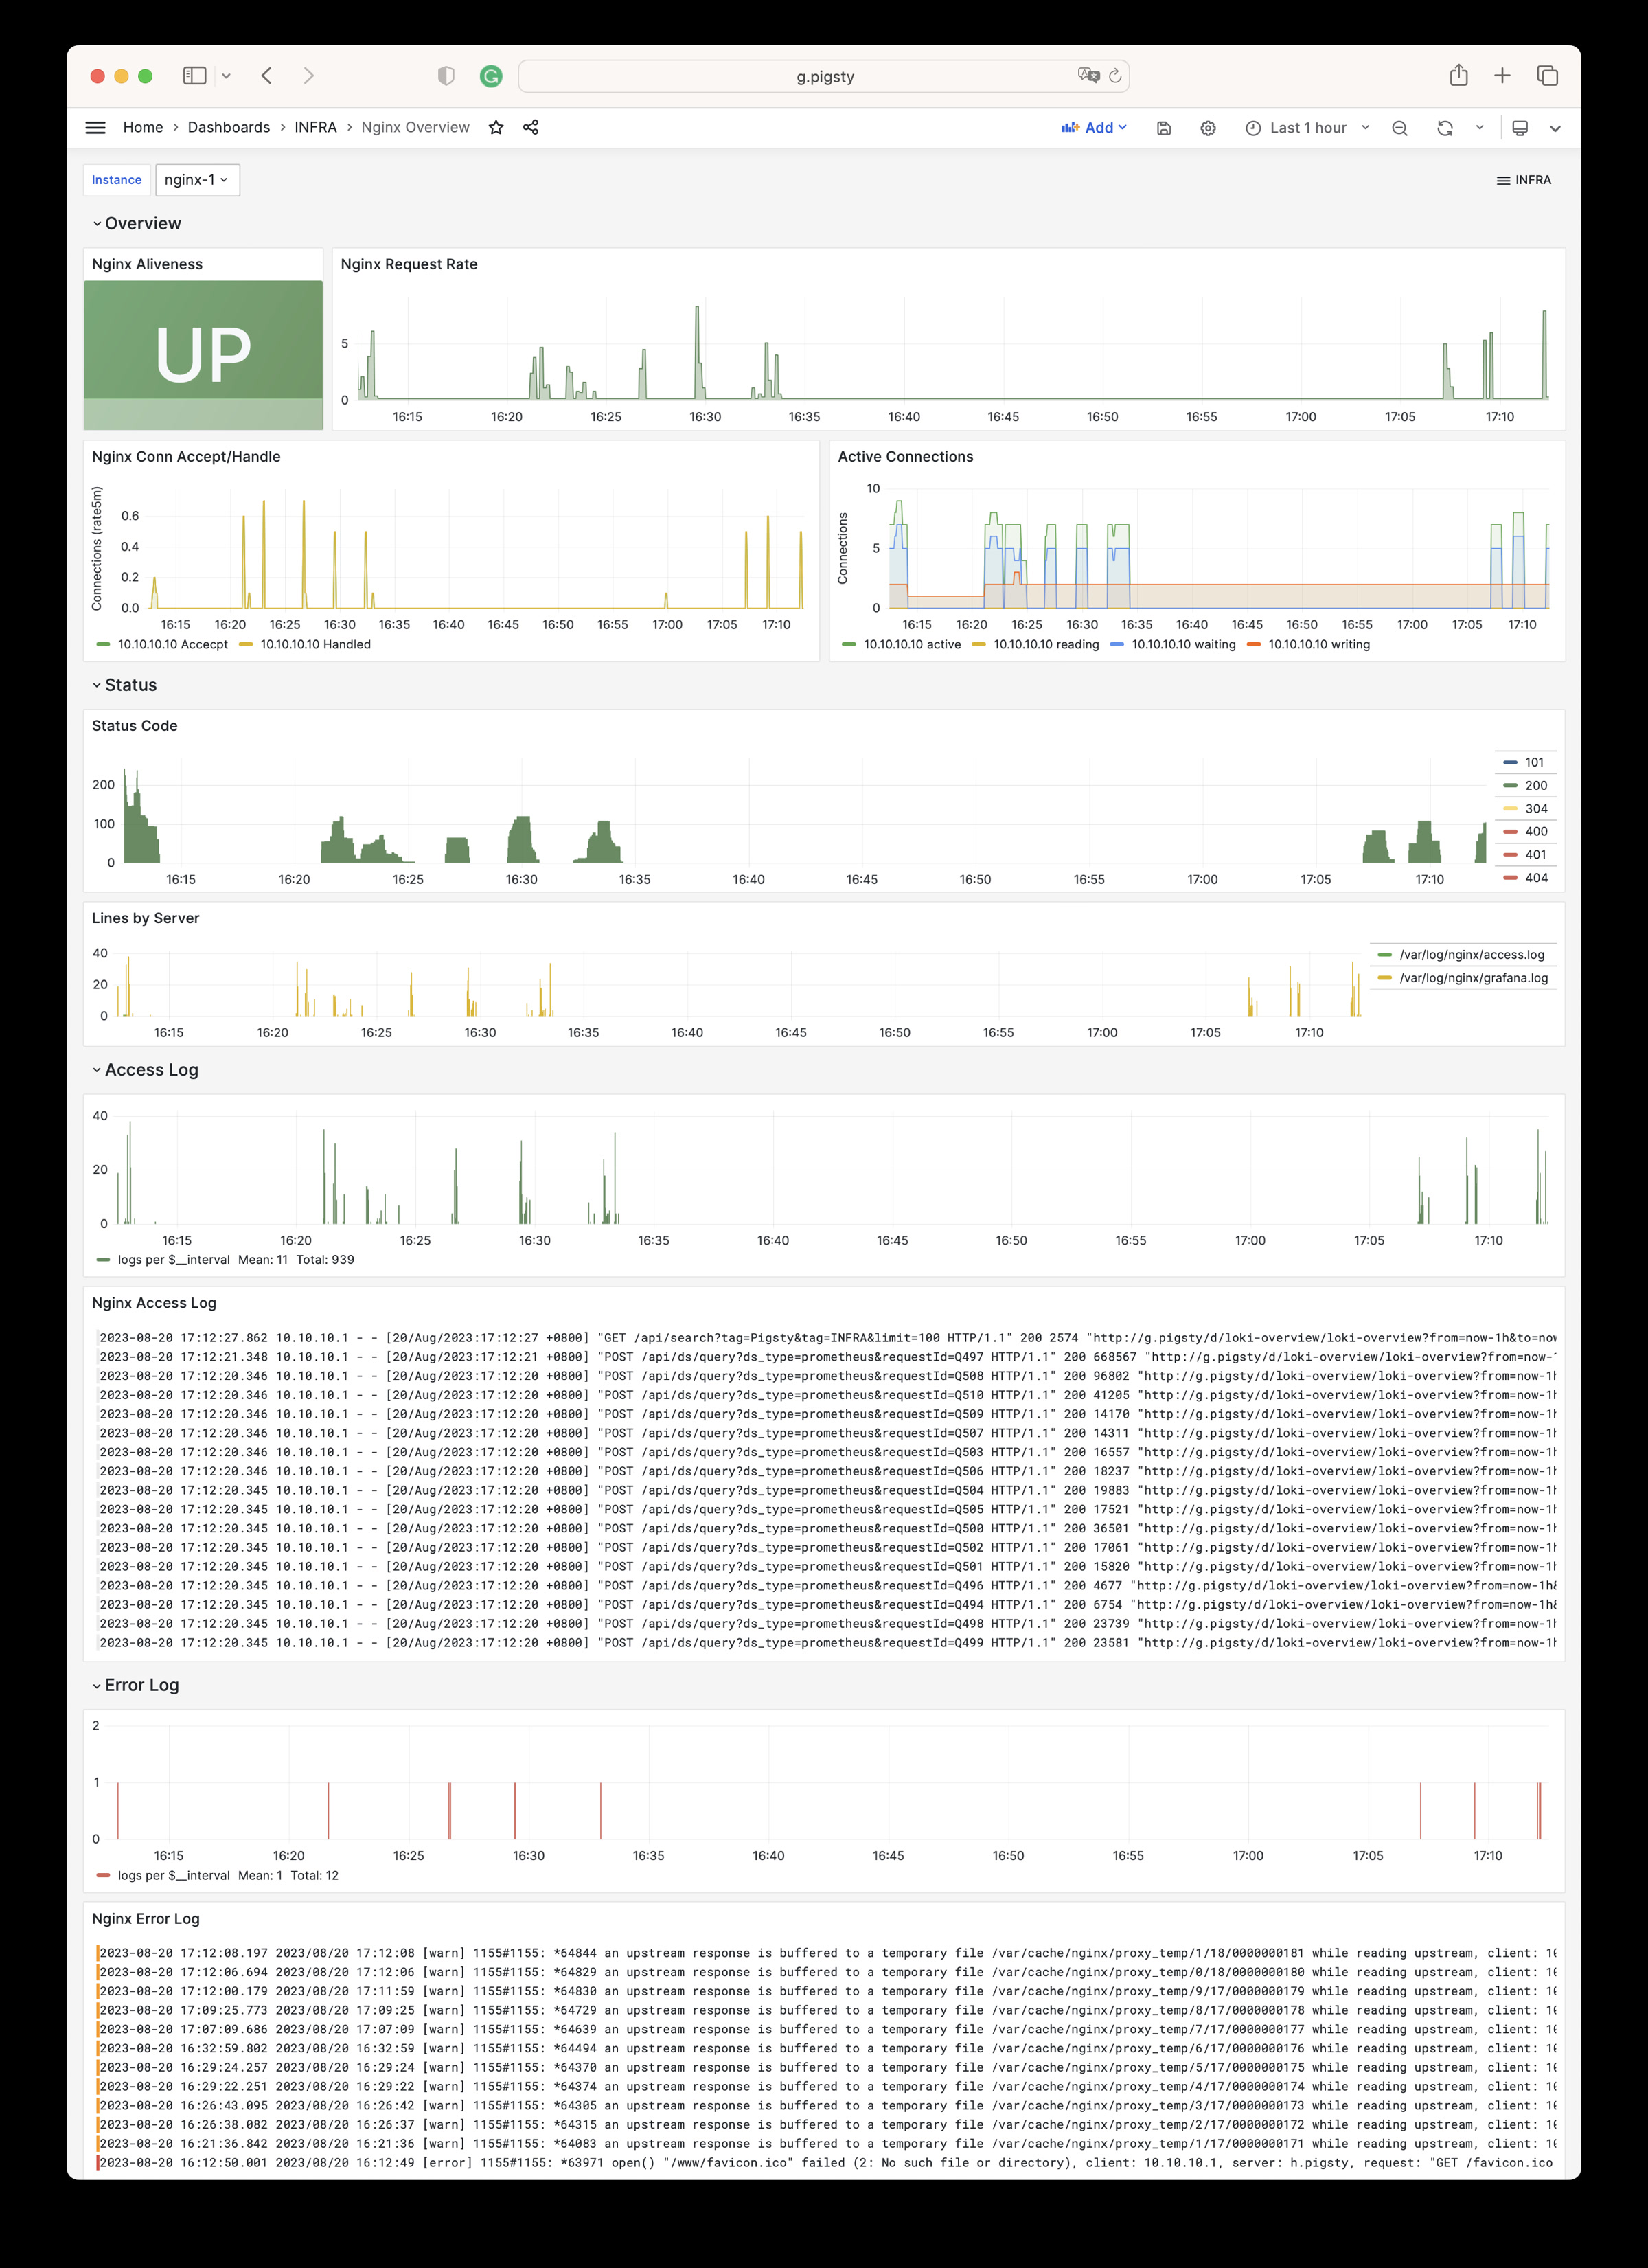
Nginx Instance: Nginx metrics and logs
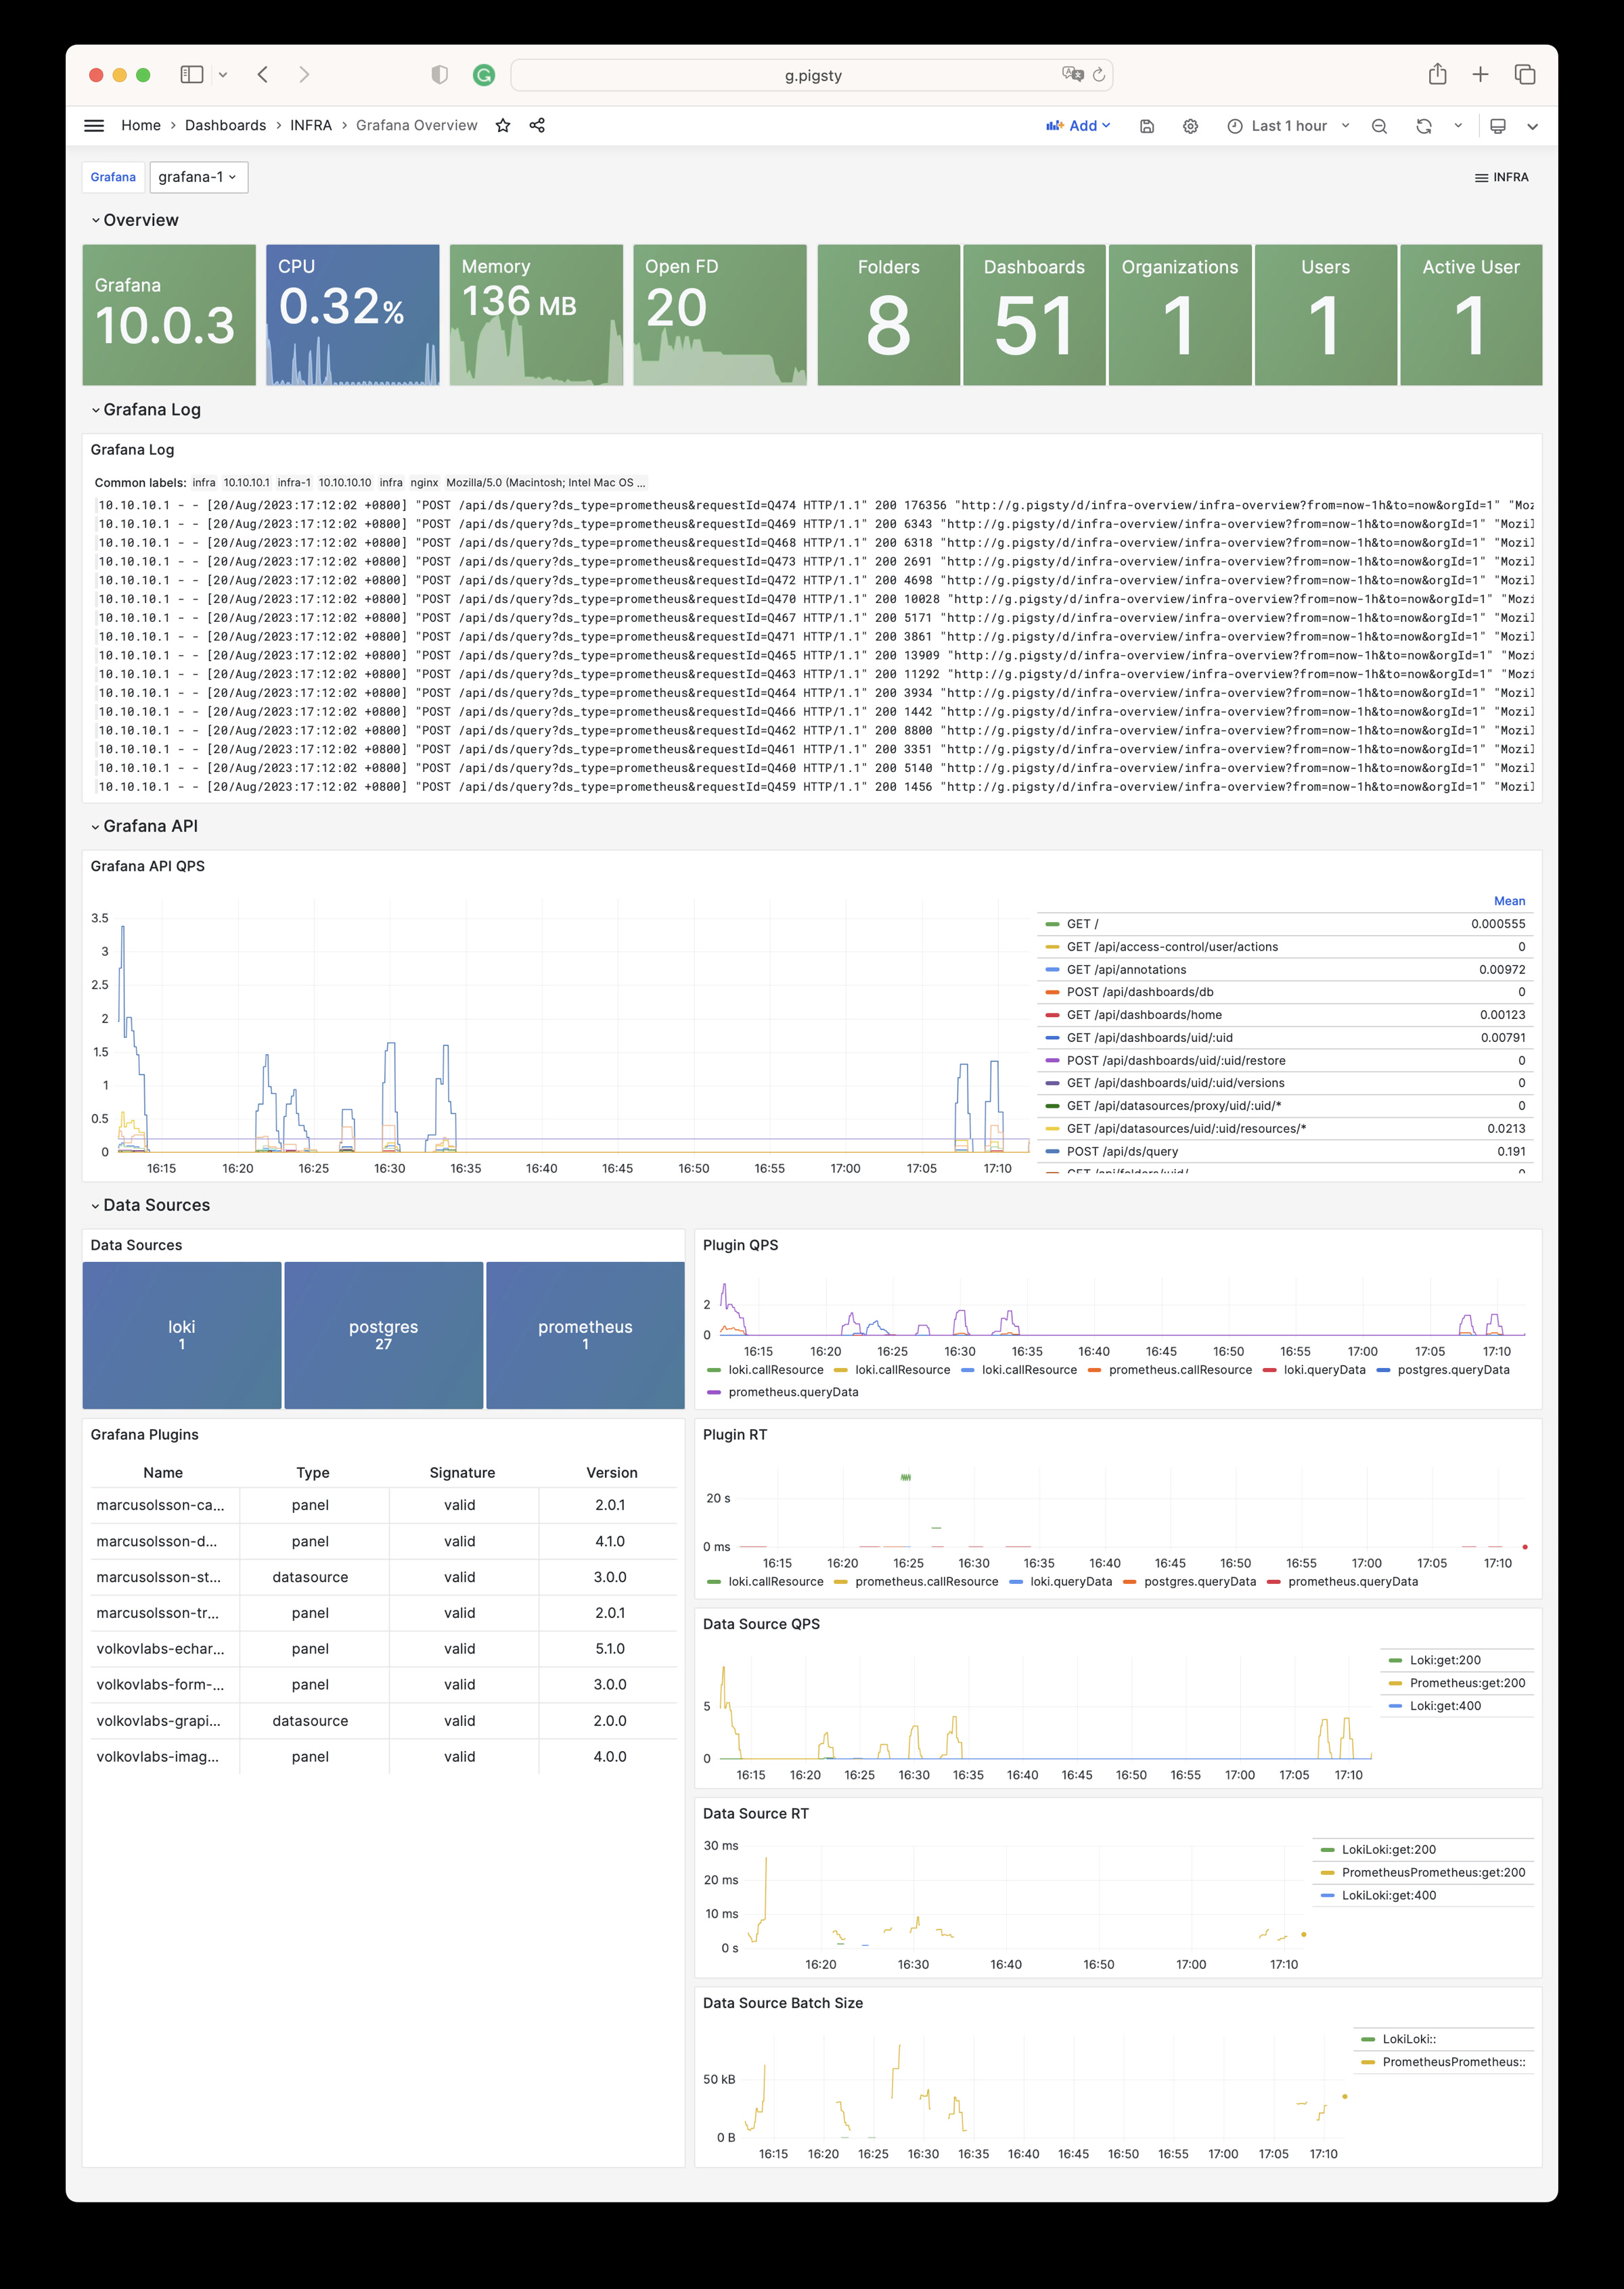
Grafana Instance: Grafana metrics and logs
VictoriaMetrics Instance: VictoriaMetrics scraping, querying, and storage metrics
VMAlert Instance: Alert rule evaluation and queue status
Alertmanager Instance: Alert aggregation, notification pipelines, and Silences
VictoriaLogs Instance: Log ingestion rate, query load, and index hits
VictoriaTraces Instance: Trace/KV storage and Jaeger interface
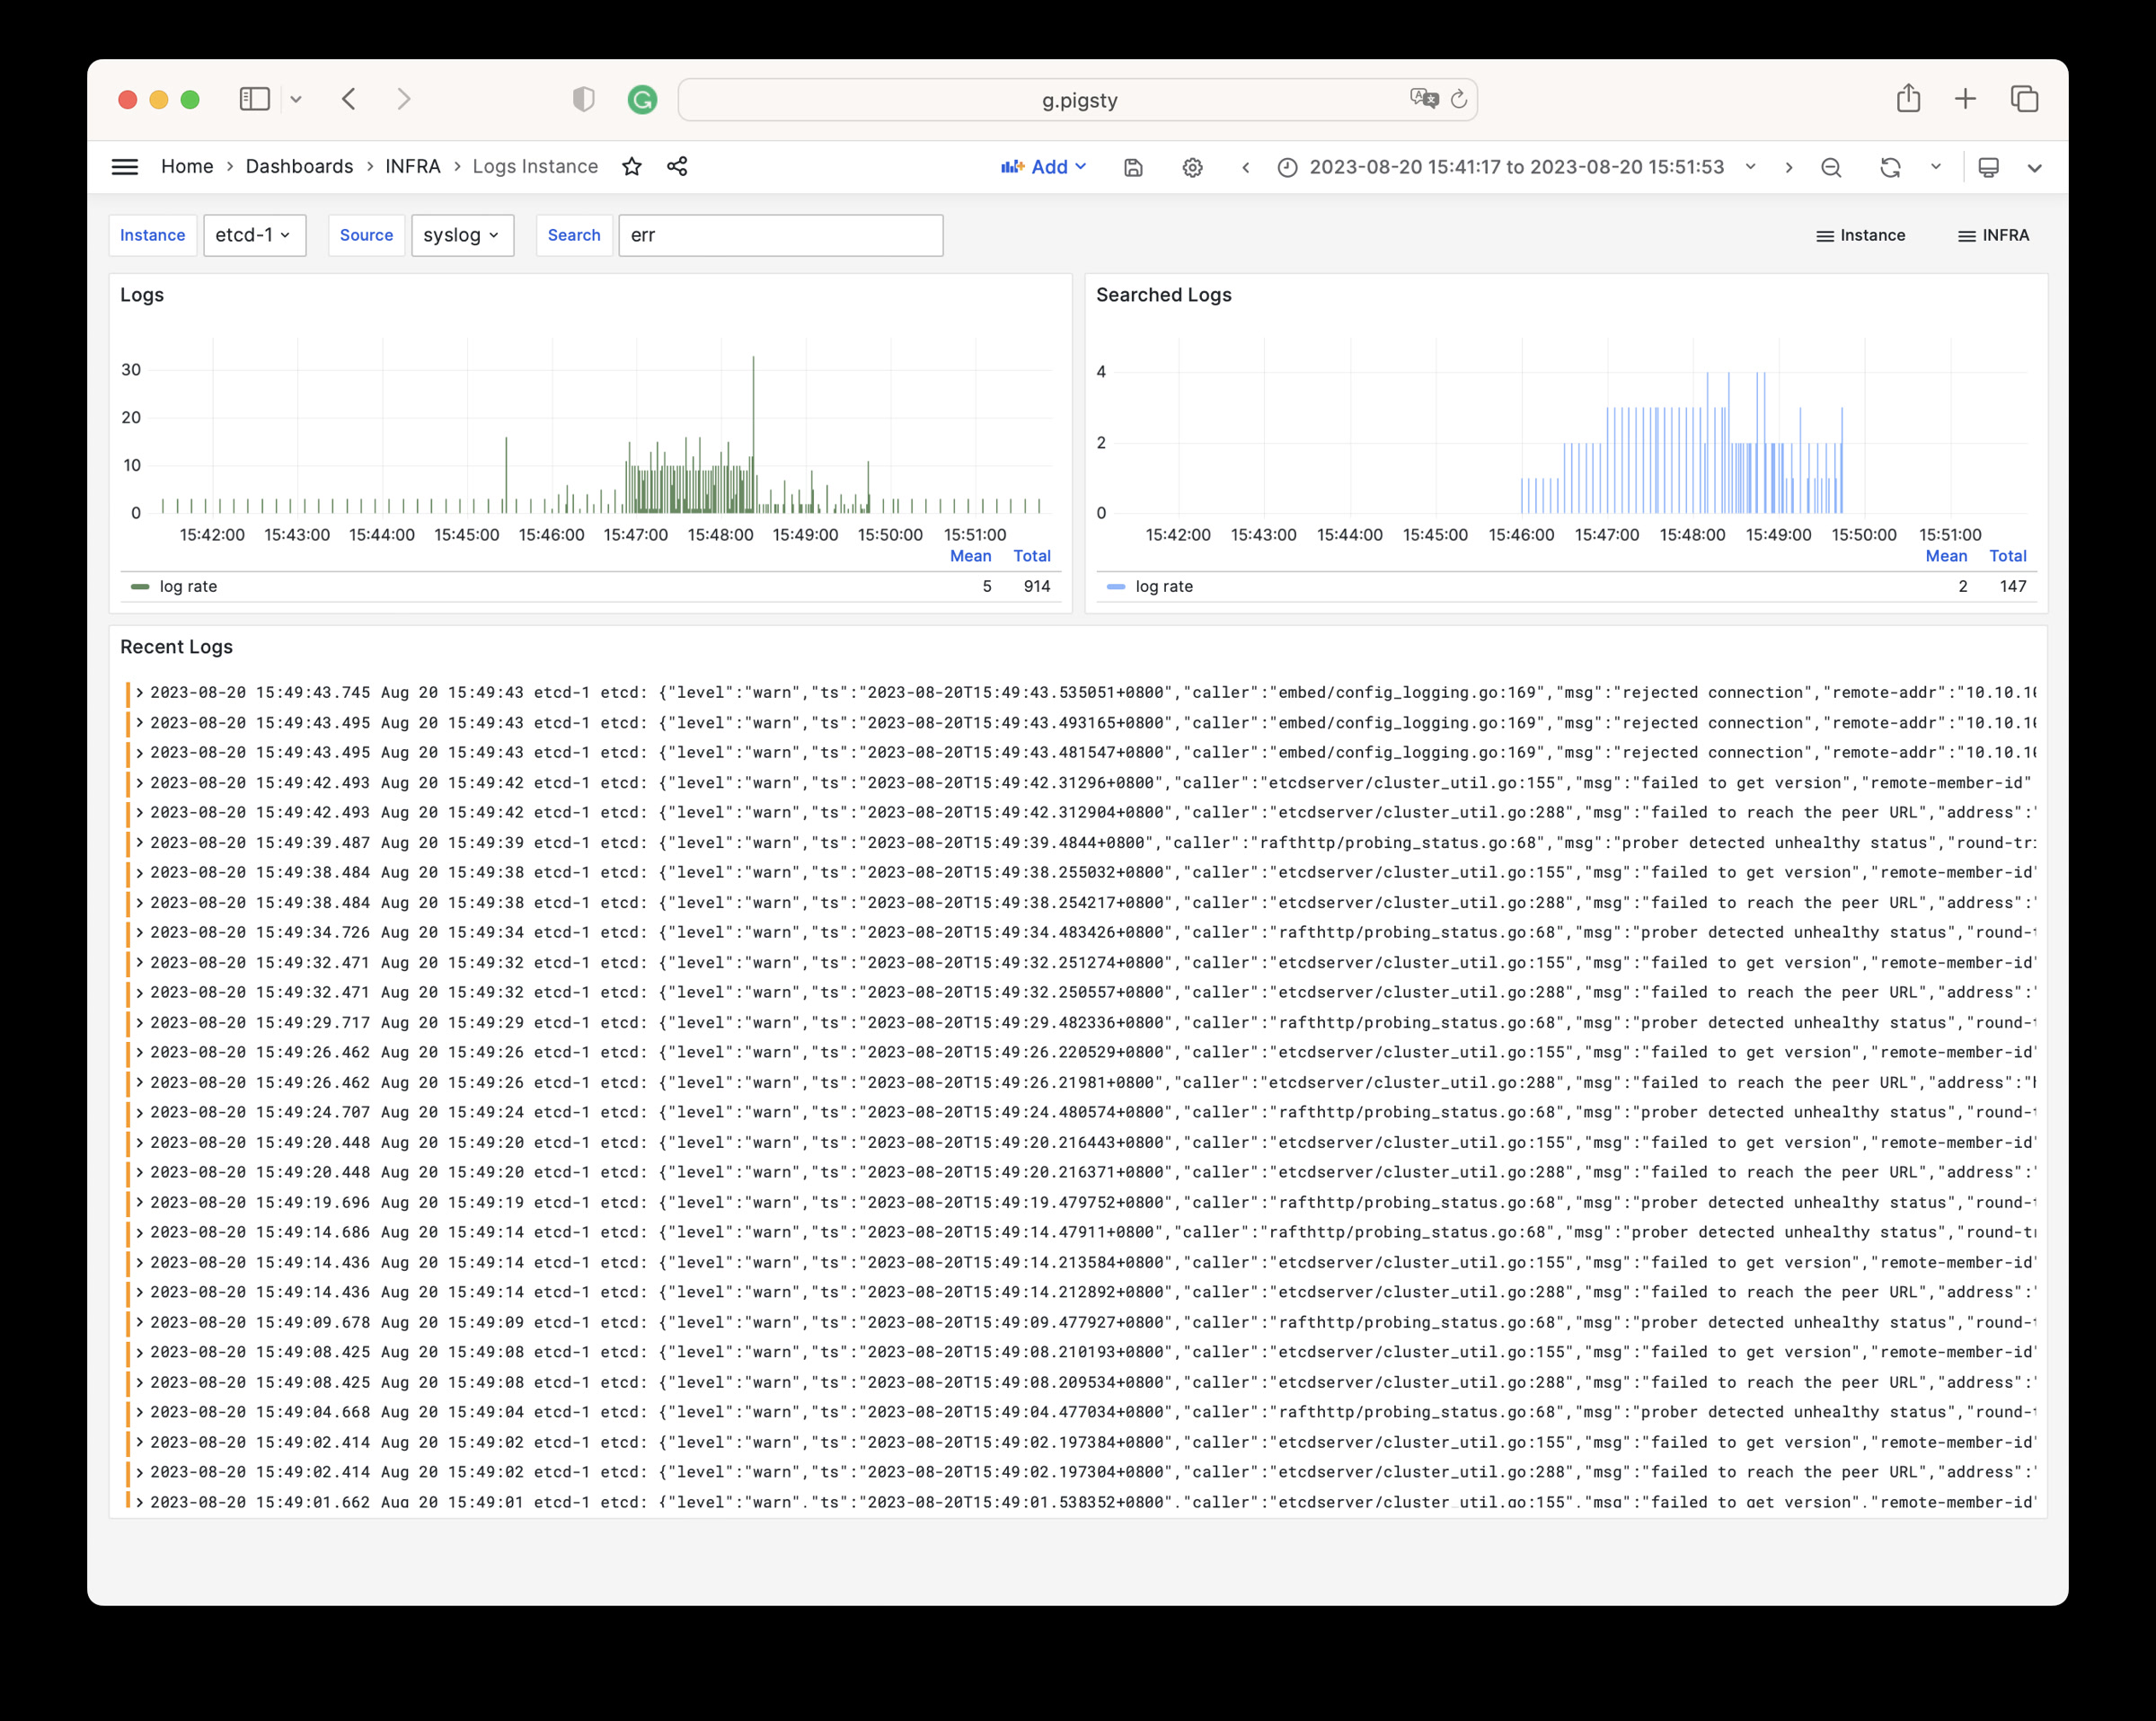
Logs Instance: Node log search based on Vector + VictoriaLogs
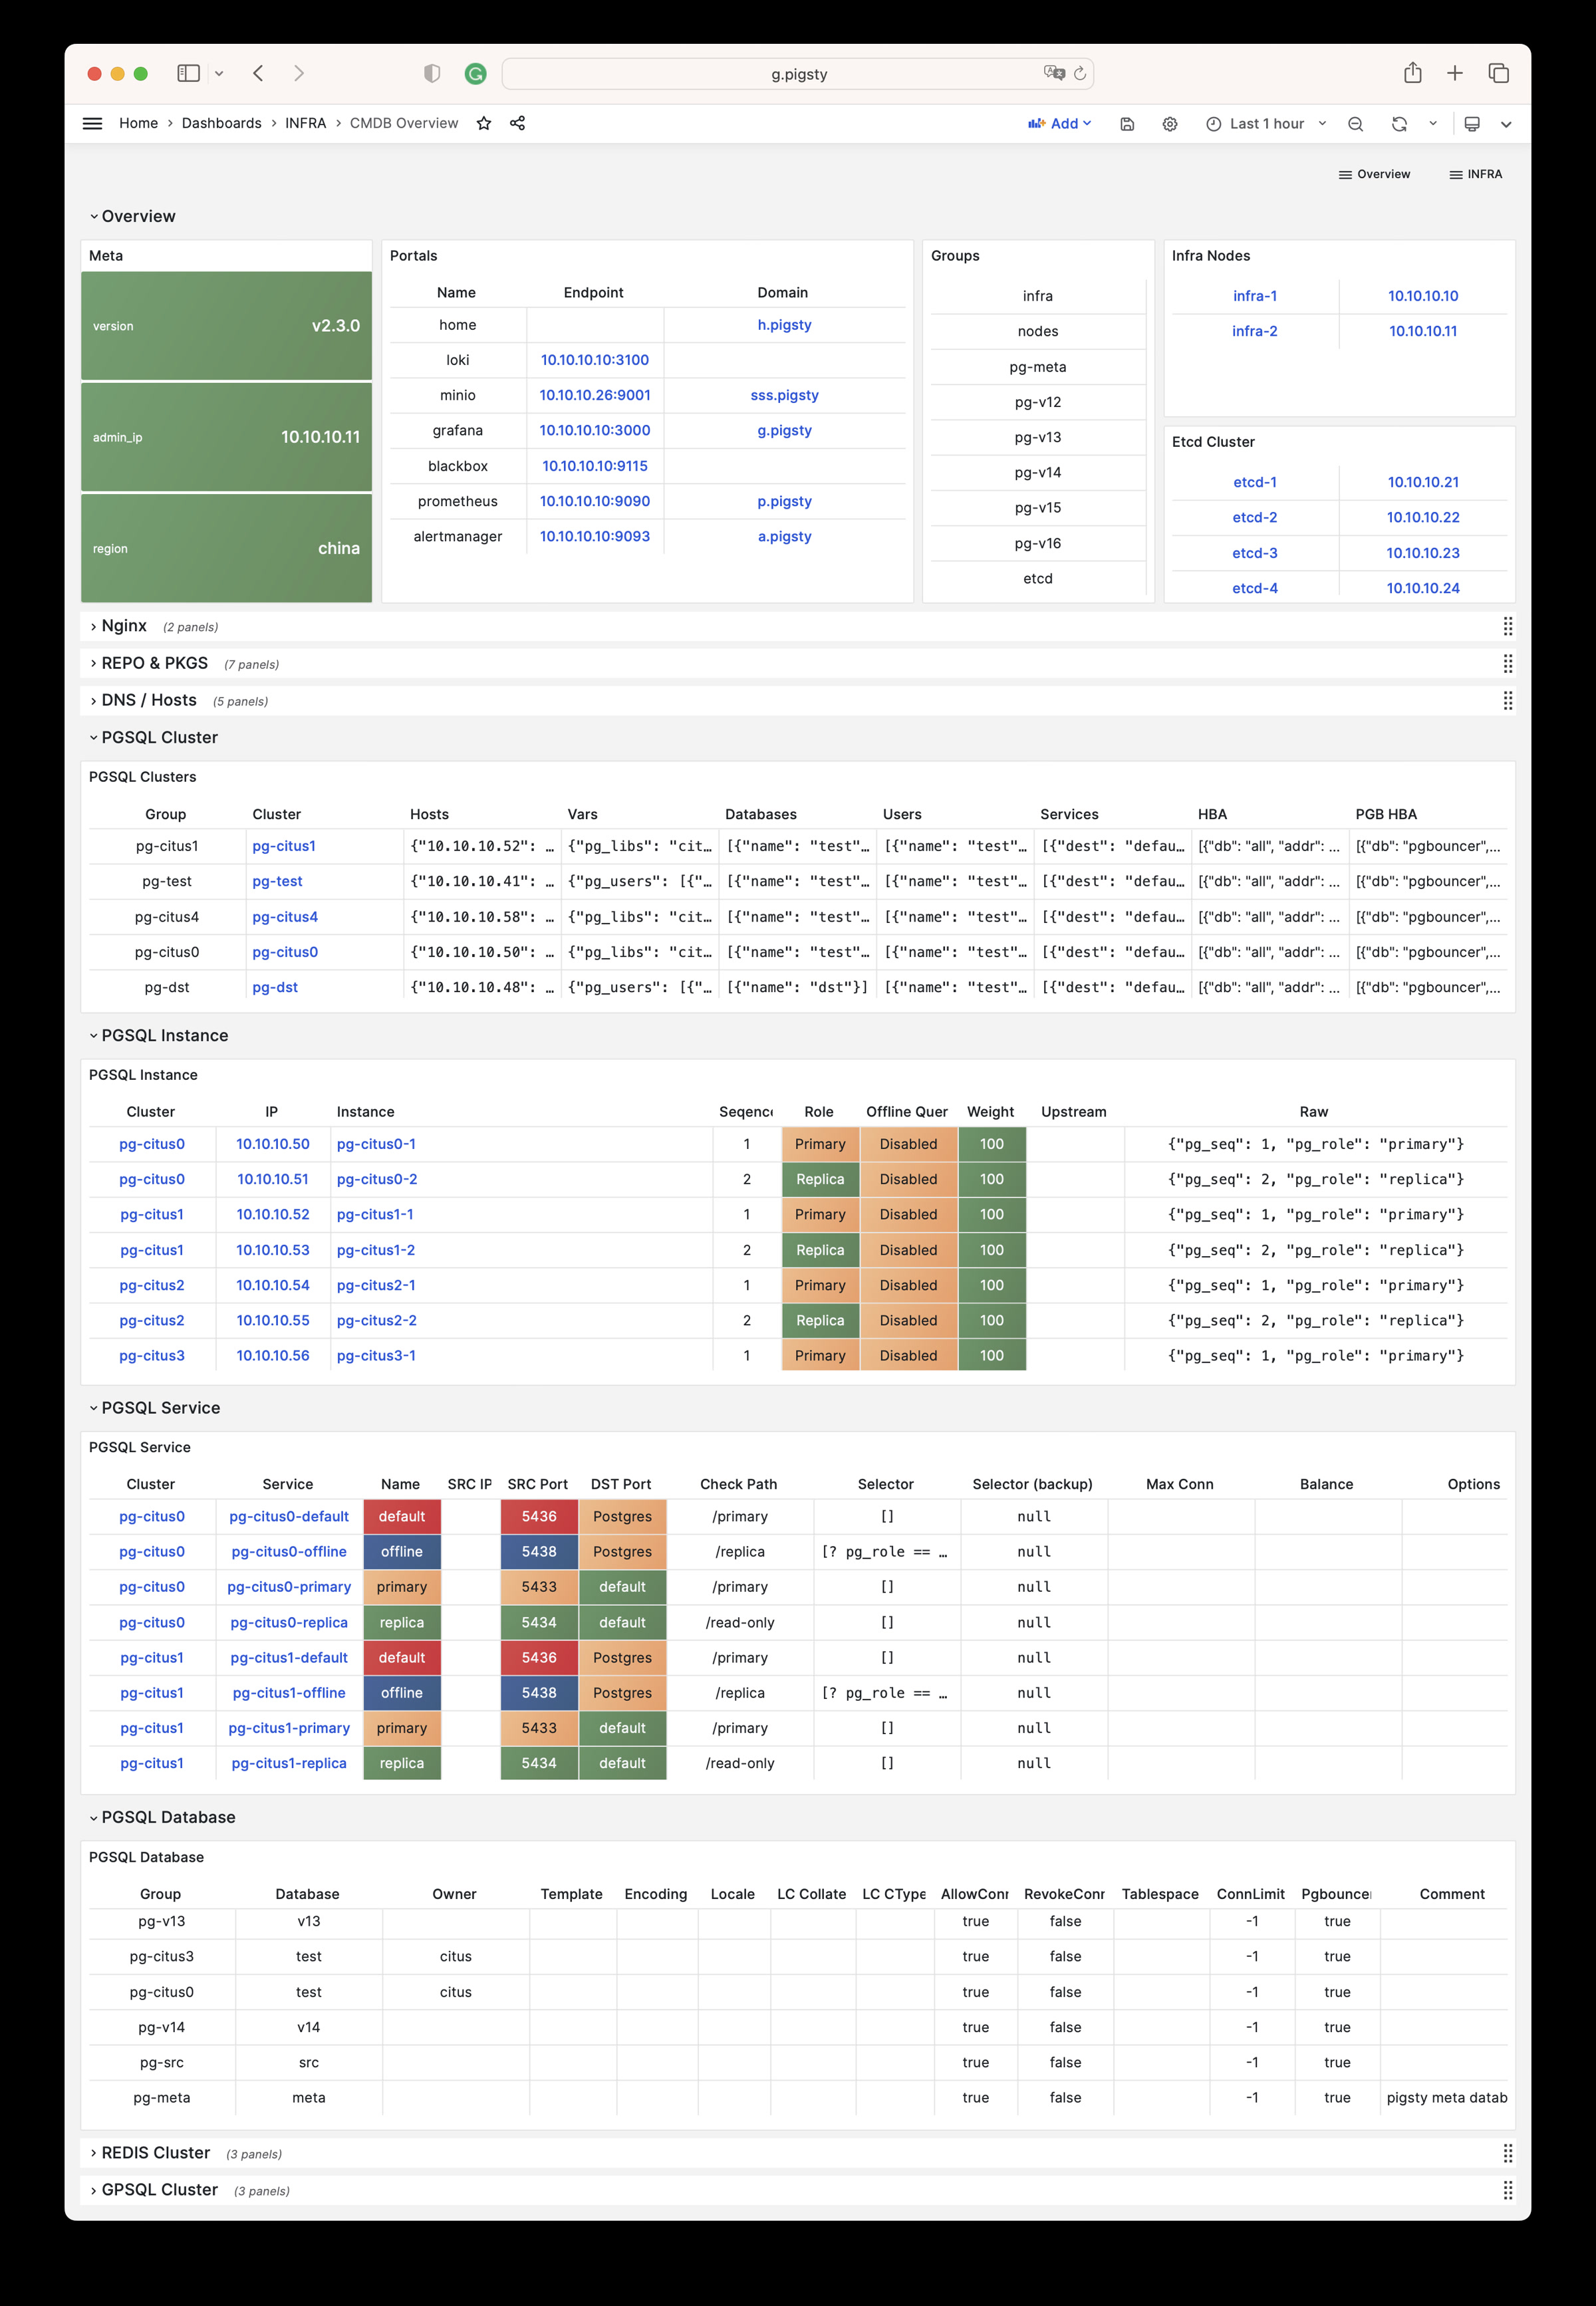
CMDB Overview: CMDB visualization
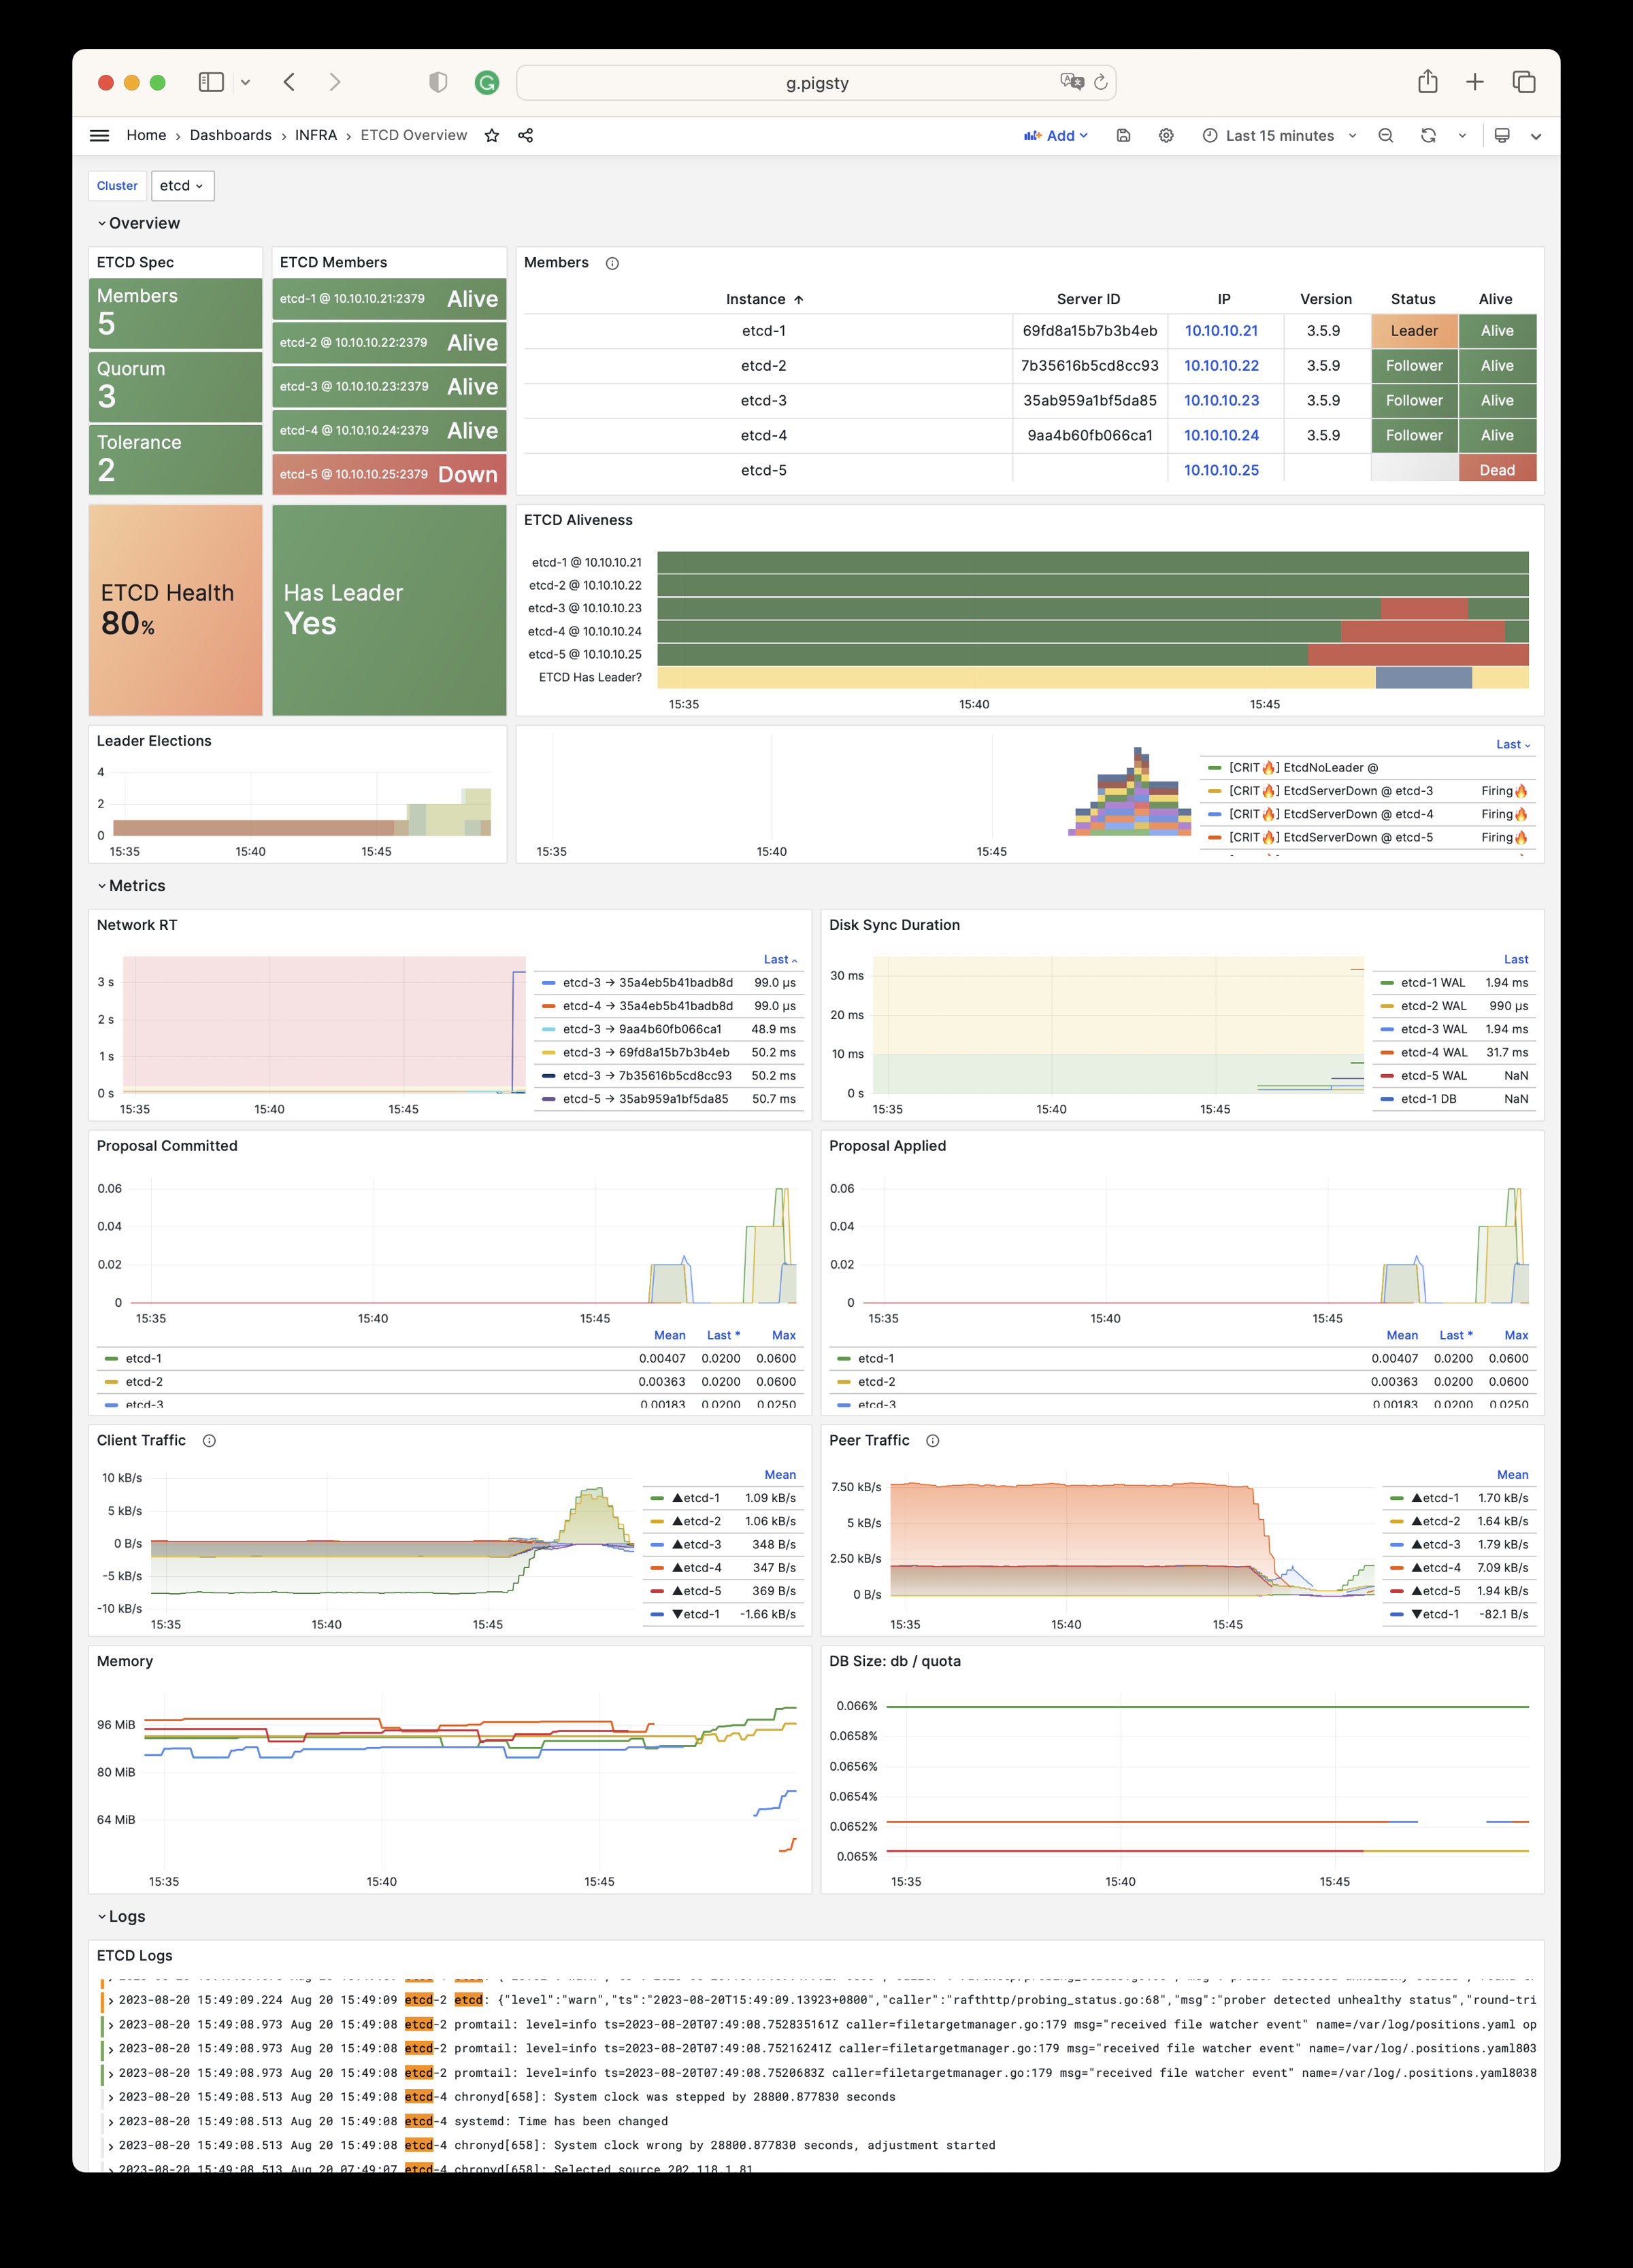
ETCD Overview: etcd metrics and logs
Parameters
The INFRA module has the following 10 parameter groups.
META: Pigsty metadataCA: Self-signed PKI/CA infrastructureINFRA_ID: Infrastructure portal, Nginx domainsREPO: Local software repositoryINFRA_PACKAGE: Infrastructure software packagesNGINX: Nginx web serverDNS: DNSMASQ domain serverVICTORIA: VictoriaMetrics / Logs / Traces suitePROMETHEUS: Alertmanager and Blackbox ExporterGRAFANA: Grafana observability suite
For the latest default values, types, and hierarchy, please refer to the Parameter Reference to stay consistent with the Pigsty version.
1 - Configuration
Configuration Guide
INFRA primarily provides monitoring infrastructure. It is optional for PostgreSQL databases.
INFRA failures typically do not affect PostgreSQL cluster operation. Exceptions apply if you manually configure dependencies on INFRA DNS/NTP services.
One INFRA node is sufficient for most scenarios. For production HA, we recommend 2-3 INFRA nodes.
ETCD, which PostgreSQL HA requires, can share nodes with INFRA to use resources more efficiently.
More than 3 INFRA nodes provide little extra benefit. More ETCD nodes, such as 5, can improve DCS availability.
Configuration Examples
Add node IP addresses to the infra inventory group. Assign an INFRA instance number with infra_seq.
Default single INFRA node config:
During configuration, Pigsty replaces 10.10.10.10 with the current node’s primary IP address by default.
Run infra.yml to initialize the INFRA module on these nodes.
More Nodes
Two INFRA nodes config:
Three INFRA nodes config (with params):
INFRA High Availability
Most INFRA components have no state or share identical state. Thus, load balancing is the main HA requirement.
Use a Keepalived L2 VIP or HAProxy L4 load balancing for HA. We recommend an L2 VIP where nodes share an accessible L2 network.
Config example:
Set VIP-related params and modify service endpoints in infra_portal.
Nginx Configuration
See Nginx Parameter Config and Tutorial: Nginx.
Local Repo Configuration
DNS Configuration
See DNS Parameter Config and Tutorial: DNS.
NTP Configuration
See NTP Parameter Config.
2 - Parameters
The INFRA module deploys Pigsty infrastructure. This includes the local software repository, Nginx, DNSMasq, VictoriaMetrics, VictoriaLogs, Grafana, Alertmanager, and Blackbox Exporter. It also deploys other monitoring and alerting components.
Pigsty v4.x replaces Prometheus with VictoriaMetrics and Loki with VictoriaLogs for observability.
| Section | Description |
|---|---|
META | Pigsty metadata: version, admin IP, region, language, proxy |
CA | Self-signed CA certificate management |
INFRA_ID | Infrastructure node identity and service portal |
REPO | Local software repository configuration |
INFRA_PACKAGE | Infrastructure node package installation |
NGINX | Nginx web server and reverse proxy configuration |
DNS | DNSMasq DNS server configuration |
VICTORIA | VictoriaMetrics/Logs/Traces observability stack |
PROMETHEUS | Alertmanager and Blackbox Exporter |
GRAFANA | Grafana visualization platform configuration |
Parameter Overview
META parameters define Pigsty metadata, including version string, admin node IP, repository mirror region, default language, and proxy settings.
| Parameter | Type | Level | Description |
|---|---|---|---|
version | string | G | Pigsty version string |
admin_ip | ip | G | Admin node IP address |
region | enum | G | Upstream mirror region: default,china,europe |
language | enum | G | Default language: en or zh |
proxy_env | dict | G | Global proxy environment variables |
CA parameters configure Pigsty’s self-signed CA certificate management, including CA creation, CA name, and certificate validity.
| Parameter | Type | Level | Description |
|---|---|---|---|
ca_create | bool | G | Allow creation if the CA private key is missing? Default true |
ca_cn | string | G | CA CN name, fixed as pigsty-ca |
cert_validity | interval | G | Certificate validity, default 20 years |
INFRA_ID parameters define infrastructure node identity, including node sequence number, service portal configuration, and data directory.
| Parameter | Type | Level | Description |
|---|---|---|---|
infra_seq | int | I | Infrastructure node sequence, REQUIRED |
infra_portal | dict | G | Infrastructure services exposed via Nginx portal |
infra_data | path | G | Infrastructure data directory, default /data/infra |
infra_services | service[] | G | Built-in home navigation entries |
infra_extra_services | service[] | G | Additional home navigation entries, default [] |
REPO parameters configure the local software repository, including repository enable switch, directory paths, upstream source definitions, and packages to download.
| Parameter | Type | Level | Description |
|---|---|---|---|
repo_enabled | bool | G/I | Create local repo on this infra node? |
repo_home | path | G | Repo home directory, default /www |
repo_name | string | G | Repo name, default pigsty |
repo_endpoint | url | G | Repo access endpoint: domain or ip:port |
repo_remove | bool | G/A | Remove existing upstream repo definitions? |
repo_modules | string | G/A | Enabled upstream repo modules, comma separated |
repo_upstream | upstream[] | G | Upstream repo definitions |
repo_packages | string[] | G | Packages to download from upstream |
repo_extra_packages | string[] | G/C/I | Extra packages to download |
repo_url_packages | string[] | G | Extra packages downloaded via URL |
INFRA_PACKAGE parameters define RPM/DEB packages to install on infrastructure nodes.
| Parameter | Type | Level | Description |
|---|---|---|---|
infra_packages | string[] | G | Packages to install on infra nodes |
NGINX parameters configure Nginx web server and reverse proxy, including enable switch, ports, SSL mode, certificates, and basic authentication.
| Parameter | Type | Level | Description |
|---|---|---|---|
nginx_enabled | bool | G/I | Enable Nginx on this infra node? |
nginx_clean | bool | G/A | Clean existing Nginx config during init? |
nginx_exporter_enabled | bool | G/I | Enable nginx_exporter on this infra node? |
nginx_exporter_port | port | G | nginx_exporter listen port, default 9113 |
nginx_sslmode | enum | G | Nginx SSL mode: disable,enable,enforce |
nginx_cert_validity | duration | G | Nginx self-signed cert validity, default 397d |
nginx_home | path | G | Nginx content dir, default /www, symlink to nginx_data |
nginx_data | path | G | Nginx actual data dir, default /data/nginx |
nginx_users | dict | G | Nginx basic auth users: username-password dict |
nginx_port | port | G | Nginx listen port, default 80 |
nginx_ssl_port | port | G | Nginx SSL listen port, default 443 |
certbot_sign | bool | G/A | Sign cert with certbot? |
certbot_email | string | G/A | Certbot notification email address |
certbot_options | string | G/A | Certbot extra command line options |
DNS parameters configure DNSMasq DNS server, including enable switch, listen port, and dynamic DNS records.
| Parameter | Type | Level | Description |
|---|---|---|---|
dns_enabled | bool | G/I | Setup dnsmasq on this infra node? |
dns_port | port | G | DNS server listen port, default 53 |
dns_records | string[] | G | Dynamic DNS records resolved by dnsmasq |
VICTORIA parameters configure the VictoriaMetrics/Logs/Traces observability stack, including enable switches, ports, and data retention policies.
| Parameter | Type | Level | Description |
|---|---|---|---|
vmetrics_enabled | bool | G/I | Enable VictoriaMetrics on this infra node? |
vmetrics_clean | bool | G/A | Clean VictoriaMetrics data during init? |
vmetrics_port | port | G | VictoriaMetrics listen port, default 8428 |
vmetrics_scrape_interval | interval | G | Global scrape interval, default 10s |
vmetrics_scrape_timeout | interval | G | Global scrape timeout, default 8s |
vmetrics_options | arg | G | VictoriaMetrics extra CLI options |
vlogs_enabled | bool | G/I | Enable VictoriaLogs on this infra node? |
vlogs_clean | bool | G/A | Clean VictoriaLogs data during init? |
vlogs_port | port | G | VictoriaLogs listen port, default 9428 |
vlogs_options | arg | G | VictoriaLogs extra CLI options |
vtraces_enabled | bool | G/I | Enable VictoriaTraces on this infra node? |
vtraces_clean | bool | G/A | Clean VictoriaTraces data during init? |
vtraces_port | port | G | VictoriaTraces listen port, default 10428 |
vtraces_options | arg | G | VictoriaTraces extra CLI options |
vmalert_enabled | bool | G/I | Enable VMAlert on this infra node? |
vmalert_port | port | G | VMAlert listen port, default 8880 |
vmalert_options | arg | G | VMAlert extra CLI options |
PROMETHEUS parameters configure Alertmanager and Blackbox Exporter, providing alert management and network probing capabilities.
| Parameter | Type | Level | Description |
|---|---|---|---|
blackbox_enabled | bool | G/I | Setup blackbox_exporter on this infra node? |
blackbox_port | port | G | blackbox_exporter listen port, default 9115 |
blackbox_options | arg | G | blackbox_exporter extra CLI options |
alertmanager_enabled | bool | G/I | Setup alertmanager on this infra node? |
alertmanager_port | port | G | AlertManager listen port, default 9059 |
alertmanager_options | arg | G | alertmanager extra CLI options |
exporter_metrics_path | path | G | Exporter metrics path, default /metrics |
GRAFANA parameters configure the Grafana visualization platform, including enable switch, port, admin credentials, and data source configuration.
| Parameter | Type | Level | Description |
|---|---|---|---|
grafana_enabled | bool | G/I | Enable Grafana on this infra node? |
grafana_port | port | G | Grafana listen port, default 3000 |
grafana_clean | bool | G/A | Clean Grafana data during init? |
grafana_admin_username | username | G | Grafana admin username, default admin |
grafana_admin_password | password | G | Grafana admin password, default pigsty |
grafana_auth_proxy | bool | G | Enable Grafana auth proxy? |
grafana_pgurl | url | G | External PostgreSQL URL for Grafana persistence |
grafana_view_password | password | G | Grafana metadb PG datasource password |
META
This section defines Pigsty deployment metadata: version string, admin node IP address, repository mirror region, default language, and HTTP(S) proxy for downloading packages.
version
name: version, type: string, level: G
Pigsty version string. The current source default is v4.5.0.
Pigsty uses this version string internally for feature control and content rendering. Do not modify this parameter arbitrarily.
Pigsty uses semantic versioning, and the version string typically starts with the character v, e.g., v4.5.0.
admin_ip
name: admin_ip, type: ip, level: G
Admin node IP address, default is the placeholder IP address: 10.10.10.10
This parameter identifies the admin node. It usually points to the first Pigsty node, which is the control node.
The default value 10.10.10.10 is a placeholder that will be replaced with the actual admin node IP address during configure.
Many parameters reference this parameter, such as:
Pigsty replaces ${admin_ip} in these parameters with the actual admin_ip value. This lets you specify different admin nodes for different nodes.
region
name: region, type: enum, level: G
Upstream mirror region. The options are default, china, and europe. The default is default.
If you select another region, Pigsty looks for its matching baseurl in repo_upstream. If found, it uses that URL instead of the default baseurl.
If the region is china, Pigsty tries Chinese mirrors to accelerate downloads. If a repository has no China mirror, Pigsty uses its default upstream mirror.
For repo_url_packages, Pigsty also changes repo.pigsty.io to repo.pigsty.cc to use domestic mirrors.
language
name: language, type: enum, level: G
Default language. The options are en (English) and zh (Chinese). The default is en.
This parameter affects the language preference of some Pigsty-generated configurations and content, such as the initial language setting of Grafana dashboards.
For Chinese content, we recommend that you set this parameter to zh.
proxy_env
name: proxy_env, type: dict, level: G
Global proxy environment variables for package downloads. The default sets no_proxy, which lists addresses that should bypass the proxy:
When installing from the Internet in mainland China, certain packages may be blocked. You can use a proxy to solve this problem.
If you use the Docker module, Pigsty also writes these proxy settings to the Docker Daemon configuration file.
If you run ./configure with -x, Pigsty reads the proxy settings from the current environment. It writes them to the generated pigsty.yaml file.
CA
Pigsty uses self-signed CA certificates to support advanced security features such as HTTPS access, PostgreSQL SSL connections, etc.
ca_create
name: ca_create, type: bool, level: G
Specifies whether to create a CA private key if it is missing. The default is true.
When set to true, Pigsty creates a new CA private key if files/pki/ca/ca.key is absent. If ca.crt is absent, it uses the existing or newly created private key to issue the CA certificate.
If you already have a CA public-private key pair, you can copy them to the files/pki/ca directory:
files/pki/ca/ca.crt: CA public key certificatefiles/pki/ca/ca.key: CA private key file
Pigsty reuses an existing CA key pair. If the private key is absent and this parameter is false, deployment stops with an error. If only ca.crt is missing, Pigsty still reissues it with the existing private key. Always back up and restore the matching ca.key and ca.crt together to avoid a certificate/key mismatch.
Keep and back up the new CA private key during deployment. You need it to issue certificates later.
Note: Pigsty v3.x used
ca_methodwith valuescreate/recreate/copy. Version v4.x replaces it with the booleanca_create.
ca_cn
name: ca_cn, type: string, level: G
CA CN (Common Name). It is fixed at pigsty-ca. We do not recommend changes.
You can use the following command to view the Pigsty CA certificate details on a node:
cert_validity
name: cert_validity, type: interval, level: G
Validity period for issued certificates. The default is 7300d, or 20 years. This is sufficient for most scenarios.
This parameter affects the validity of all certificates issued by the Pigsty CA, including:
- PostgreSQL server certificates
- Patroni API certificates
- etcd server/client certificates
- Other internal service certificates
Note: nginx_cert_validity separately controls the validity of Nginx HTTPS certificates. Modern browsers impose stricter website certificate limits: a maximum of 397 days.
INFRA_ID
Infrastructure identity and portal definition.
infra_seq
name: infra_seq, type: int, level: I
Infrastructure node sequence number. This identity parameter is REQUIRED and has no default. Set it explicitly on each infrastructure node.
This parameter uniquely identifies each infrastructure node. Typically, use positive integers starting at 1.
Example configuration:
infra_portal
name: infra_portal, type: dict, level: G
Infrastructure services exposed via Nginx portal. The v4.x default value is very concise:
Pigsty configures reverse proxies for the enabled components automatically. Usually, you only need to define the home domain name.
Each record has a key and a value dictionary. The key, name, identifies the component. The value defines these parameters:
name: REQUIRED, specifies the name of the Nginx server- Default record:
homeis a fixed name, please do not modify it. - Used as part of the Nginx configuration file name, corresponding to:
/etc/nginx/conf.d/<name>.conf - Nginx servers without a
domainfield will not generate configuration files but will be used as references.
- Default record:
domain: OPTIONAL for a reference-only entry. It is REQUIRED to expose a service through Nginx and specifies its domain name.- In Pigsty self-signed Nginx HTTPS certificates, the domain will be added to the SAN field of the Nginx SSL certificate
- Pigsty web page cross-references will use the default domain name here
endpoint: Upstream server address for a reverse proxy. Usually, use it as an alternative topath.${admin_ip}can be used as a placeholder in the configuration and will be dynamically replaced withadmin_ipduring deployment- Default reverse proxy servers use endpoint.conf as the configuration template
- Reverse proxy servers can also configure
websocketandschemaparameters
path: Local directory for a file server. Usually, use it as an alternative toendpoint.- Local web servers use path.conf as the configuration template
- Local web servers can also configure the
indexparameter to enable file index pages
certbot: Certbot certificate name; if configured, Certbot will be used to apply for certificates- If servers share a certbot value, Pigsty combines their certificate requests. This value becomes the certificate name.
cert: Certificate file path; if configured, will override the default certificate pathkey: Certificate key file path; if configured, will override the default certificate key pathwebsocket: Whether to enable WebSocket support- Only reverse proxies can use this parameter. If enabled, it permits upstream WebSocket connections.
schema: Protocol used by the upstream server; if configured, will override the default protocol- Default is http; if configured as https, it will force HTTPS connections to the upstream server
index: Whether to enable file index pages- Only local file servers can use this parameter. If enabled, autoindex generates directory index pages.
log: Nginx log file path- If specified, Nginx writes access logs to this file. Otherwise, the server type determines the default log file.
- Reverse proxy servers use
/var/log/nginx/<name>.logas the default log file path - Local web servers use the default Access log
conf: Nginx configuration file path- Specifies a configuration template in roles/infra/templates/nginx or templates/nginx.
- If this parameter is not specified, the default configuration template will be used
config: Nginx configuration code block- Configuration text directly injected into the Nginx Server configuration block
enforce_https: Redirect HTTP to HTTPS- Global configuration can be specified via nginx_sslmode: enforce
- This setting does not affect the default home server. For compatibility, that server always listens on both ports 80 and 443.
infra_data
name: infra_data, type: path, level: G
Infrastructure data directory, default value is /data/infra.
This directory is used to store data files for infrastructure components, including:
- VictoriaMetrics time series database data
- VictoriaLogs log data
- VictoriaTraces trace data
- Other infrastructure component persistent data
We recommend a separate data disk for this directory. This simplifies management and expansion.
infra_services
name: infra_services, type: service[], level: G
Built-in navigation entries on the Pigsty home page. Current defaults include Metrics, Logs, Traces, Monitor Targets, Alert Rules, Alert Manager, CA Certificate, Software Repo, and Explain Visualizer.
Each item can use name, url, desc, and icon, plus the Chinese display fields name_cn and desc_cn. This parameter replaces the entire default list. To append entries, use infra_extra_services.
infra_extra_services
name: infra_extra_services, type: service[], level: G
Navigation entries appended to infra_services. The default is [], and each item uses the same structure as infra_services. For example:
REPO
This section is about local software repository configuration. Pigsty enables a local software repository (APT/YUM) on infrastructure nodes by default.
During initialization, Pigsty downloads packages and dependencies from the internet. repo_packages specifies the packages, and repo_upstream specifies the upstream repositories. The destination is {{ nginx_home }} / {{ repo_name }}, which defaults to /www/pigsty. The total software and dependency size is approximately 1GB.
The current package candidate is SOW 0.3.0. The source uses SOW to generate RPM/APT metadata. After a successful build, repo_complete is both a SHA-256 manifest and a completion marker. When it is present, Pigsty skips downloading and rebuilding by default and uses the existing repository. Force a rebuild with ./infra.yml -t repo_build -e repo_build=true.
Both repo_create and cache_create run sow create --pigsty directly. They do not fall back to createrepo_c or dpkg-scanpackages.
Older offline bundles or local repositories might lack SOW. First, refresh the media or install SOW from the Pigsty INFRA repository.
If package downloads are too slow, set a proxy with proxy_env for the initial download. You can also download a prebuilt offline package. This is a local repository built on the same operating system.
repo_enabled
name: repo_enabled, type: bool, level: G/I
Specifies whether to create a local repository on this infrastructure node. The default is true, which creates a repository on every Infra node.
With multiple infrastructure nodes, you can keep repositories on only 1-2 nodes. Set this parameter to false elsewhere to avoid duplicate downloads and builds.
repo_home
name: repo_home, type: path, level: G
Local software repository home directory, defaults to Nginx’s root directory: /www.
On a fresh installation, if this path does not exist, the role creates a symlink to nginx_data. Existing directories and symlinks are preserved unchanged. We generally recommend that you preserve this value. If you change it, keep it consistent with nginx_home.
repo_name
name: repo_name, type: string, level: G
Local repository name, default is pigsty. Changing this repository name is not recommended.
The final repository path is {{ repo_home }}/{{ repo_name }}, defaulting to /www/pigsty.
repo_endpoint
name: repo_endpoint, type: url, level: G
Endpoint used by other nodes to access this repository, default value: http://${admin_ip}:80.
Pigsty starts Nginx on infrastructure nodes at ports 80/443 by default, providing local software repository (static files) service.
Adjust this parameter after changes to nginx_port or nginx_ssl_port. Also adjust it if the infrastructure node differs from the control node.
If you use a domain name, you can add resolution in node_default_etc_hosts, node_etc_hosts, or dns_records.
repo_remove
name: repo_remove, type: bool, level: G/A
Specifies whether to remove existing upstream repository definitions during a local repository build. The default is true.
When this parameter is enabled, all existing repository files in /etc/yum.repos.d will be moved and backed up to /etc/yum.repos.d/backup. On Debian systems, /etc/apt/sources.list and /etc/apt/sources.list.d are removed and backed up to /etc/apt/backup.
Pigsty does not control the content of existing operating-system sources. Pigsty-validated upstream sources can improve package download speed and success rate.
Some EL/Deb-compatible variants use private sources for many packages. If you need to preserve existing upstream repository definitions, set this parameter to false.
repo_modules
name: repo_modules, type: string, level: G/A
Which upstream repository modules will be added to the local software source, default value: infra,node,pgsql
When Pigsty attempts to add upstream repositories, it filters entries in repo_upstream based on this parameter’s value. Only entries whose module field matches this parameter’s value will be added to the local software source.
During the build stage, infra is automatically added to the effective module list so SOW can be installed. This bootstrap dependency is restored even if a user overrides repo_modules without infra.
Modules are comma-separated. Available module lists can be found in the repo_upstream definitions; common modules include:
local: Local Pigsty repositoryinfra: Infrastructure packages (Nginx, Docker, etc.)node: OS base packagespgsql: PostgreSQL-related packagesextra: Extra PostgreSQL extensionsdocker: Docker-relatedredis: Redis-relatedmongo: MongoDB-relatedmysql: MySQL-related- etc…
repo_upstream
name: repo_upstream, type: upstream[], level: G
Upstream package sources for the local repository build. This parameter has no direct default. If unset, Pigsty loads repo_upstream_default from roles/node_id/vars. It selects the definition for the current node’s operating-system family.
Pigsty provides complete upstream repository definitions for currently supported OS versions (EL 8/9/10, Debian 12/13, Ubuntu 22/24/26), including:
- OS base repositories (BaseOS, AppStream, EPEL, etc.)
- PostgreSQL official PGDG repository
- Pigsty extension repository
- Various third-party software repositories (Docker, Nginx, Grafana, etc.)
Each upstream repository definition contains the following fields:
RPM upstream repositories retain native DNF module filtering by default. Set meta.module_hotfixes only on a repository that must actually replace an EL module stream. Clients use module_hotfixes=1 for Pigsty’s aggregated local repository. Pigsty no longer generates artificial modules.yaml / ModuleMD metadata.
Users typically don’t need to modify this parameter unless they have special repository requirements. For detailed repository definitions, refer to the configuration files for corresponding operating systems in the roles/node_id/vars/ directory.
repo_packages
name: repo_packages, type: string[], level: G
String array of packages to download with their dependencies. Each entry is a space-separated package list. Downloads use repotrack or apt download.
This parameter has no direct default. If unset, Pigsty loads repo_packages_default from roles/node_id/vars:
Each element in this parameter will be translated according to the package_map in the above files, based on the specific OS distro major version. For example, on EL systems it translates to:
By convention, repo_packages contains packages independent of the PostgreSQL major version, including Infra, Node, and PGDG Common packages. Put version-specific kernels and extensions in repo_extra_packages. This simplifies PostgreSQL major-version changes.
repo_extra_packages
name: repo_extra_packages, type: string[], level: G/C/I
Additional packages to download without changing repo_packages. These are typically specific to a PostgreSQL major version. The default is an empty list.
If not explicitly defined, Pigsty will load the default from the repo_extra_packages_default variable defined in roles/node_id/vars:
Pigsty translates these package names. It replaces $v with pg_version, the current PostgreSQL major version. The default version is 18.
The pgsql-main here translates on EL systems to:
Users can typically specify PostgreSQL major version-related packages here without affecting the other PG version-independent packages defined in repo_packages.
repo_url_packages
name: repo_url_packages, type: object[] | string[], level: G
Packages downloaded directly from the Internet using URLs, default is an empty array: []
You can use URL strings directly as array elements in this parameter, or use object structures to explicitly specify URLs and filenames.
The region variable affects this parameter. For mainland China, Pigsty automatically changes repo.pigsty.io URLs to repo.pigsty.cc.
INFRA_PACKAGE
These RPM/DEB packages are installed only on INFRA nodes.
infra_packages
name: infra_packages, type: string[], level: G
Packages to install on Infra nodes. Each array entry is a space-separated package list.
The default varies by platform. If unset, Pigsty loads infra_packages_default from the matching file under roles/node_id/vars. It selects the file by operating-system version and CPU architecture.
For example, the current mapping for EL 9 x86_64 is:
The current mapping for Debian 13 x86_64 is:
Note: v4.x uses the VictoriaMetrics suite to replace Prometheus and Loki, so the package list differs significantly from v3.x.
NGINX
Nginx proxies Pigsty web services, including the Home Page, Grafana, and VictoriaMetrics. It also proxies optional tools such as PGWeb, Jupyter Lab, Pgadmin, and Bytebase. It serves static resources and reports, including pev, schemaspy, and pgbadger.
Nginx also serves the local Yum/Apt repository, which stores and distributes Pigsty packages.
nginx_enabled
name: nginx_enabled, type: bool, level: G/I
Specifies whether to enable Nginx on this Infra node. The default is true.
Nginx is a core component of Pigsty infrastructure, responsible for:
- Providing local software repository service
- Reverse proxying Grafana, VictoriaMetrics, and other web services
- Hosting static files and reports
nginx_clean
name: nginx_clean, type: bool, level: G/A
Specifies whether to delete existing Nginx configuration during initialization. The default is false.
If set to true, Pigsty deletes all configuration files under /etc/nginx/conf.d/ during Nginx initialization. This starts with an empty configuration directory.
If you’re deploying for the first time or want to completely rebuild Nginx configuration, you can set this parameter to true.
nginx_exporter_enabled
name: nginx_exporter_enabled, type: bool, level: G/I
Specifies whether to enable nginx_exporter on this infrastructure node. The default is true.
If this option is disabled, the /nginx health check stub will also be disabled. Consider disabling this when your Nginx version doesn’t support this feature.
nginx_exporter_port
name: nginx_exporter_port, type: port, level: G
nginx_exporter listen port, default value is 9113.
nginx_exporter is used to collect Nginx operational metrics for VictoriaMetrics to scrape and monitor.
nginx_sslmode
name: nginx_sslmode, type: enum, level: G
Nginx SSL operating mode. The options are disable, enable, and enforce. The default, enable, enables SSL but does not require it.
disable: Only listen on the port specified bynginx_portto serve HTTP requests.enable: Also listen on the port specified bynginx_ssl_portto serve HTTPS requests.enforce: All links will be rendered to usehttps://by default- Also redirect port 80 to port 443 for non-default servers in
infra_portal
- Also redirect port 80 to port 443 for non-default servers in
nginx_cert_validity
name: nginx_cert_validity, type: duration, level: G
Nginx self-signed certificate validity, default value is 397d (approximately 13 months).
The default follows the modern browser limit of 397 days for website certificates. We do not recommend longer validity because browsers can reject these certificates.
nginx_home
name: nginx_home, type: path, level: G
Nginx server static content directory, default: /www
This is a symlink that actually points to the nginx_data directory. This directory contains static resources and software repository files.
Avoid unnecessary changes to this parameter. If changed, keep it consistent with repo_home.
nginx_data
name: nginx_data, type: path, level: G
Nginx actual data directory, default is /data/nginx.
This directory stores Nginx static files. The nginx_home symlink points to it.
We recommend a data disk for this directory to simplify management of large package files.
nginx_users
name: nginx_users, type: dict, level: G
Nginx Basic Authentication user dictionary, default is an empty dictionary {}.
Format is { username: password } key-value pairs, for example:
These users can be used to protect certain Nginx endpoints that require authentication.
nginx_port
name: nginx_port, type: port, level: G
Nginx HTTP listen port. The default is 80. We recommend that you keep the default.
If port 80 is occupied, you can use another port. Also update repo_endpoint and node_repo_local_urls to match the new port.
nginx_ssl_port
name: nginx_ssl_port, type: port, level: G
Nginx SSL listen port. The default is 443. We recommend that you keep the default.
certbot_sign
name: certbot_sign, type: bool, level: G/A
Specifies whether Certbot signs Nginx certificates during installation. The default is false.
If set to true, Pigsty uses Certbot to request free Let’s Encrypt SSL certificates automatically. The nginx role does this during infra.yml and deploy.yml.
For an infra_portal entry with certbot set, Pigsty requests a certificate for its domain. The certbot value becomes the certificate name.
If multiple servers or domains share the same certbot value, Pigsty combines them in one request. It uses that value as the certificate name.
Enabling this option requires:
- A public domain resolves to the current node’s public IP and provides access to the node.
- The current node can access the Let’s Encrypt API interface
This option is disabled by default. After installation, run make cert manually if needed. It calls the generated /etc/nginx/sign-cert script to request or update certificates with Certbot.
certbot_email
name: certbot_email, type: string, level: G/A
Email address for receiving certificate expiration reminder emails, default value is [email protected].
When certbot_sign is set to true, it’s recommended to provide this parameter. Let’s Encrypt will send reminder emails to this address when certificates are about to expire.
certbot_options
name: certbot_options, type: string, level: G/A
Additional configuration parameters passed to certbot, default value is an empty string.
Use this parameter for extra Certbot command-line options. For example, --dry-run previews and tests the operation without requesting actual certificates.
DNS
Pigsty enables DNSMASQ on Infra nodes by default. It resolves auxiliary names such as i.pigsty, m.pigsty, and api.pigsty. The optional sss.pigsty name can provide the Silo endpoint.
Resolution records are stored in the /etc/dnsmasq.d/pigsty/default file on Infra nodes. To use this DNS server, you must add nameserver <ip> to /etc/resolv.conf. The node_dns_servers parameter handles this.
dns_enabled
name: dns_enabled, type: bool, level: G/I
Specifies whether to enable DNSMASQ on this Infra node. The default is true.
Set this value to false if you do not need the default DNS server. For example, you might have an external server or a provider that prohibits DNS servers. Use static records in node_default_etc_hosts and node_etc_hosts instead.
dns_port
name: dns_port, type: port, level: G
DNSMASQ default listening port, default is 53. It’s not recommended to modify the default DNS service port.
dns_records
name: dns_records, type: string[], level: G
Dynamic DNS records resolved by dnsmasq, generally used to resolve auxiliary domain names to the admin node. These records are written to the /etc/dnsmasq.d/pigsty/default file on infrastructure nodes.
v4.x default value:
The ${admin_ip} placeholder is used here and will be replaced with the actual admin_ip value during deployment.
Common domain name purposes:
i.pigsty: Pigsty home pagem.pigsty: Commonly used for the Silo console (optional)p.pigsty: Commonly used for the VictoriaMetrics Web UI when explicitly configured ininfra_portalapi.pigsty: API serviceadm.pigsty: Admin service- Others customized based on actual deployment needs
VICTORIA
Pigsty v4.x uses the VictoriaMetrics suite for observability in place of Prometheus and Loki:
- VictoriaMetrics: Replaces Prometheus as the time series database for storing monitoring metrics
- VictoriaLogs: Replaces Loki as the log aggregation storage
- VictoriaTraces: Distributed trace storage
- VMAlert: Replaces Prometheus Alerting for alert rule evaluation
vmetrics_enabled
name: vmetrics_enabled, type: bool, level: G/I
Specifies whether to enable VictoriaMetrics on this Infra node. The default is true.
VictoriaMetrics is the core monitoring component in Pigsty v4.x, replacing Prometheus as the time series database, responsible for:
- Scraping monitoring metrics from various exporters
- Storing time series data
- Providing PromQL-compatible query interface
- Supporting Grafana data sources
vmetrics_clean
name: vmetrics_clean, type: bool, level: G/A
Specifies whether to delete existing VictoriaMetrics data during initialization. The default is false.
When set to true, existing time series data will be deleted during initialization. Use this option carefully unless you’re sure you want to rebuild monitoring data.
vmetrics_port
name: vmetrics_port, type: port, level: G
VictoriaMetrics listen port, default value is 8428.
This port is used for:
- HTTP API access
- Web UI access
- Prometheus-compatible remote write/read
- Grafana data source connections
vmetrics_scrape_interval
name: vmetrics_scrape_interval, type: interval, level: G
VictoriaMetrics global metrics scrape interval, default value is 10s.
A 10-30 second scrape interval is suitable for production. A shorter interval gives more detailed monitoring data but increases storage and CPU overhead.
vmetrics_scrape_timeout
name: vmetrics_scrape_timeout, type: interval, level: G
VictoriaMetrics global scrape timeout, default is 8s.
A scrape timeout helps prevent monitoring queries from accumulating. Set it below and close to vmetrics_scrape_interval. This keeps each scrape shorter than the interval.
vmetrics_options
name: vmetrics_options, type: arg, level: G
VictoriaMetrics extra command line options, default value:
Common parameter descriptions:
-retentionPeriod=15d: Data retention period, default 15 days-promscrape.fileSDCheckInterval=5s: File service discovery refresh interval
You can add other VictoriaMetrics-supported parameters as needed.
vlogs_enabled
name: vlogs_enabled, type: bool, level: G/I
Specifies whether to enable VictoriaLogs on this Infra node. The default is true.
VictoriaLogs replaces Loki as the log aggregation storage, responsible for:
- Receiving log data from Vector
- Storing and indexing logs
- Providing log query interface
- Supporting Grafana VictoriaLogs data source
vlogs_clean
name: vlogs_clean, type: bool, level: G/A
Specifies whether to delete existing VictoriaLogs data during initialization. The default is false.
vlogs_port
name: vlogs_port, type: port, level: G
VictoriaLogs listen port, default value is 9428.
vlogs_options
name: vlogs_options, type: arg, level: G
VictoriaLogs extra command line options, default value:
Common parameter descriptions:
-retentionPeriod=15d: Log retention period, default 15 days-retention.maxDiskSpaceUsageBytes=50GiB: Maximum disk usage-insert.maxLineSizeBytes=1MB: Maximum single log line size-search.maxQueryDuration=120s: Maximum query execution time
vtraces_enabled
name: vtraces_enabled, type: bool, level: G/I
Specifies whether to enable VictoriaTraces on this Infra node. The default is true.
VictoriaTraces stores and queries distributed trace data. It supports Jaeger, Zipkin, and other trace protocols.
vtraces_clean
name: vtraces_clean, type: bool, level: G/A
Specifies whether to delete existing VictoriaTraces data during initialization. The default is false.
vtraces_port
name: vtraces_port, type: port, level: G
VictoriaTraces listen port, default value is 10428.
vtraces_options
name: vtraces_options, type: arg, level: G
VictoriaTraces extra command line options, default value:
vmalert_enabled
name: vmalert_enabled, type: bool, level: G/I
Specifies whether to enable VMAlert on this Infra node. The default is true.
VMAlert evaluates alert rules and works with Alertmanager. It replaces Prometheus Alerting.
vmalert_port
name: vmalert_port, type: port, level: G
VMAlert listen port, default value is 8880.
vmalert_options
name: vmalert_options, type: arg, level: G
VMAlert extra command line options, default value is an empty string.
PROMETHEUS
This section now primarily contains Blackbox Exporter and Alertmanager configuration.
Note: Pigsty v4.x uses VictoriaMetrics instead of Prometheus. The current interface no longer includes
prometheus_*andpushgateway_*. Usevmetrics_*andvmalert_*underVICTORIAfor metric storage and rule evaluation.
blackbox_enabled
name: blackbox_enabled, type: bool, level: G/I
Specifies whether to enable BlackboxExporter on this Infra node. The default is true.
BlackboxExporter sends ICMP packets to node IP addresses, VIP addresses, and PostgreSQL VIP addresses to test network connectivity. It can also perform HTTP, TCP, DNS, and other probes.
blackbox_port
name: blackbox_port, type: port, level: G
Blackbox Exporter listen port, default value is 9115.
blackbox_options
name: blackbox_options, type: arg, level: G
BlackboxExporter extra command line options, default value: empty string.
alertmanager_enabled
name: alertmanager_enabled, type: bool, level: G/I
Specifies whether to enable AlertManager on this Infra node. The default is true.
AlertManager receives alerts from VMAlert. It groups, inhibits, silences, routes, and otherwise processes these alerts.
alertmanager_port
name: alertmanager_port, type: port, level: G
AlertManager listen port, default value is 9059.
If you modify this port, ensure you update the alertmanager entry’s endpoint configuration in infra_portal accordingly (if defined).
alertmanager_options
name: alertmanager_options, type: arg, level: G
AlertManager extra command line options, default value: empty string.
exporter_metrics_path
name: exporter_metrics_path, type: path, level: G
HTTP endpoint path where monitoring exporters expose metrics, default: /metrics. Not recommended to modify this parameter.
This parameter defines the standard path for all exporters to expose monitoring metrics.
GRAFANA
Grafana provides the monitoring system frontend. It also supports data analysis, visualization, low-code data application development, and application prototyping.
grafana_enabled
name: grafana_enabled, type: bool, level: G/I
Specifies whether to enable Grafana on this Infra node. The default is true, which installs and enables Grafana on all infrastructure nodes.
grafana_port
name: grafana_port, type: port, level: G
Grafana listen port, default value is 3000.
If you need to access Grafana directly (not through Nginx reverse proxy), you can use this port.
grafana_clean
name: grafana_clean, type: bool, level: G/A
Specifies whether to delete Grafana data files during initialization. The default is false.
This operation removes /var/lib/grafana/grafana.db, ensuring a fresh Grafana installation.
If you want to preserve existing Grafana configuration (such as dashboards, users, data sources, etc.), set this parameter to false.
grafana_admin_username
name: grafana_admin_username, type: username, level: G
Grafana admin username, default is admin.
grafana_admin_password
name: grafana_admin_password, type: password, level: G
Grafana admin password, default is pigsty.
IMPORTANT: Change this password before production deployment.
grafana_auth_proxy
name: grafana_auth_proxy, type: bool, level: G
Specifies whether to enable the Grafana authentication proxy. The default is false.
If enabled, Grafana trusts user identity information from the Nginx reverse proxy. This supports single sign-on (SSO).
This is typically used for integration with external identity authentication systems.
grafana_pgurl
name: grafana_pgurl, type: url, level: G
External PostgreSQL database URL for Grafana persistence storage. Default is an empty string.
If specified, Grafana will use this PostgreSQL database instead of the default SQLite database to store its configuration data.
Format example: postgres://grafana:password@pg-meta:5432/grafana?sslmode=disable
This is useful for scenarios requiring Grafana high availability deployment or data persistence.
grafana_view_password
name: grafana_view_password, type: password, level: G
Read-only user password used by Grafana metadb PG data source, default is DBUser.Viewer.
This password is used for Grafana to connect to the PostgreSQL CMDB data source to query metadata in read-only mode.
3 - Playbook
Pigsty provides three playbooks related to the INFRA module:
deploy.yml: Deploy the NODE, INFRA, ETCD, MINIO, and PGSQL core modules on all nodes in one passinfra.yml: Initialize Pigsty infrastructure on infra nodesinfra-rm.yml: Remove infrastructure components from infra nodes
deploy.yml
Deploy NODE, INFRA, ETCD, MINIO, and PGSQL on all nodes in one pass. This resolves the circular dependency between INFRA and NODE.
The playbook interleaves subtasks from infra.yml and node.yml. It deploys core components in this order:
- id: Generate node and PostgreSQL identities
- ca: Create self-signed CA on localhost
- repo: Create local software repository on infra nodes
- node-init: Initialize nodes and HAProxy
- infra: Initialize Nginx, DNS, VictoriaMetrics, Grafana, etc.
- node-monitor: Initialize node-exporter, vector
- etcd: Initialize etcd (required for PostgreSQL HA)
- minio: Initialize Silo (optional)
- pgsql: Initialize PostgreSQL clusters and configure PostgreSQL monitoring
This playbook is equivalent to executing the following five playbooks sequentially:
deploy.yml does not currently deploy the Docker module. If Docker is required, set docker_enabled: true and run docker.yml separately.
infra.yml
Initialize the infrastructure module on Infra nodes defined in the infra group of your configuration file.
This playbook performs the following tasks:
- Configures directories and environment variables on Infra nodes
- Downloads and creates a local software repository to accelerate subsequent installations
- Incorporates the current Infra node as a common node managed by Pigsty
- Deploys infrastructure components (VictoriaMetrics/Logs/Traces, VMAlert, Grafana, Alertmanager, Blackbox Exporter, etc.)
Playbook notes:
- This is an idempotent playbook - repeated execution will overwrite infrastructure components on Infra nodes
- To preserve historical monitoring data, set
vmetrics_clean,vlogs_clean,vtraces_cleantofalsebeforehand - Unless
grafana_cleanis set tofalse, Grafana dashboards and configuration changes will be lost - If
/www/pigsty/repo_completeexists, the playbook skips internet downloads. SOW generates this SHA-256 manifest and completion marker. - Complete execution takes approximately 1-3 minutes, depending on machine configuration and network conditions
Available Tasks
infra-rm.yml
Remove Pigsty infrastructure from Infra nodes defined in the infra group of your configuration file.
Common subtasks include:
infra-rm.yml has no deletion safeguard. Without tags, it runs every phase above. The data phase recursively deletes infra_data (default: /data/infra), nginx_data (default: /data/nginx), nginx_home (default: /www), and /var/lib/grafana. This includes metrics, logs, traces, the software repository, and local Grafana data. Use the corresponding tag if you only want to stop services or deregister targets. Before a full run, back up everything that must survive and verify the exact infra target.
4 - Monitoring
This document describes monitoring dashboards and alert rules for the INFRA module in Pigsty.
Dashboards
Pigsty provides the following monitoring dashboards for the Infra module:
| Dashboard | Description |
|---|---|
| Pigsty Home | Pigsty monitoring system homepage |
| INFRA Overview | Pigsty infrastructure self-monitoring overview |
| Nginx Instance | Nginx metrics and logs |
| Grafana Instance | Grafana metrics and logs |
| VictoriaMetrics Instance | VictoriaMetrics scraping/query status |
| VMAlert Instance | Alert rule execution status |
| Alertmanager Instance | Alert aggregation and notifications |
| VictoriaLogs Instance | Log ingestion, querying, and indexing |
| Logs Instance | View log information on a single node |
| VictoriaTraces Instance | Trace storage and querying |
| Inventory CMDB | CMDB visualization |
| ETCD Overview | etcd cluster monitoring |
Alert Rules
Pigsty provides the following two alert rules for the INFRA module:
| Alert Rule | Description |
|---|---|
InfraDown | Infrastructure component is down |
AgentDown | Monitoring agent is down |
You can modify or add new infrastructure alert rules in files/victoria/rules/infra.yml.
Alert Rule Configuration
5 - Metrics
Note: Pigsty v4.0 replaced Prometheus/Loki with VictoriaMetrics/Logs/Traces. This metric list comes from v3.x. Use it only to troubleshoot older versions. For current metrics, query
https://p.pigsty(VMUI) or Grafana directly. Future versions will regenerate the metric references for the Victoria suite.
INFRA Metrics
The INFRA module has 964 available metrics.
| Metric Name | Type | Labels | Description |
|---|---|---|---|
| alertmanager_alerts | gauge | ins, instance, ip, job, cls, state | How many alerts by state. |
| alertmanager_alerts_invalid_total | counter | version, ins, instance, ip, job, cls | The total number of received alerts that were invalid. |
| alertmanager_alerts_received_total | counter | version, ins, instance, ip, status, job, cls | The total number of received alerts. |
| alertmanager_build_info | gauge | revision, version, ins, instance, ip, tags, goarch, goversion, job, cls, branch, goos | A metric with a constant ‘1’ value labeled by version, revision, branch, goversion from which alertmanager was built, and the goos and goarch for the build. |
| alertmanager_cluster_alive_messages_total | counter | ins, instance, ip, peer, job, cls | Total number of received alive messages. |
| alertmanager_cluster_enabled | gauge | ins, instance, ip, job, cls | Indicates whether the clustering is enabled or not. |
| alertmanager_cluster_failed_peers | gauge | ins, instance, ip, job, cls | Number indicating the current number of failed peers in the cluster. |
| alertmanager_cluster_health_score | gauge | ins, instance, ip, job, cls | Health score of the cluster. Lower values are better and zero means ’totally healthy’. |
| alertmanager_cluster_members | gauge | ins, instance, ip, job, cls | Number indicating current number of members in cluster. |
| alertmanager_cluster_messages_pruned_total | counter | ins, instance, ip, job, cls | Total number of cluster messages pruned. |
| alertmanager_cluster_messages_queued | gauge | ins, instance, ip, job, cls | Number of cluster messages which are queued. |
| alertmanager_cluster_messages_received_size_total | counter | ins, instance, ip, msg_type, job, cls | Total size of cluster messages received. |
| alertmanager_cluster_messages_received_total | counter | ins, instance, ip, msg_type, job, cls | Total number of cluster messages received. |
| alertmanager_cluster_messages_sent_size_total | counter | ins, instance, ip, msg_type, job, cls | Total size of cluster messages sent. |
| alertmanager_cluster_messages_sent_total | counter | ins, instance, ip, msg_type, job, cls | Total number of cluster messages sent. |
| alertmanager_cluster_peer_info | gauge | ins, instance, ip, peer, job, cls | A metric with a constant ‘1’ value labeled by peer name. |
| alertmanager_cluster_peers_joined_total | counter | ins, instance, ip, job, cls | A counter of the number of peers that have joined. |
| alertmanager_cluster_peers_left_total | counter | ins, instance, ip, job, cls | A counter of the number of peers that have left. |
| alertmanager_cluster_peers_update_total | counter | ins, instance, ip, job, cls | A counter of the number of peers that have updated metadata. |
| alertmanager_cluster_reconnections_failed_total | counter | ins, instance, ip, job, cls | A counter of the number of failed cluster peer reconnection attempts. |
| alertmanager_cluster_reconnections_total | counter | ins, instance, ip, job, cls | A counter of the number of cluster peer reconnections. |
| alertmanager_cluster_refresh_join_failed_total | counter | ins, instance, ip, job, cls | A counter of the number of failed cluster peer joined attempts via refresh. |
| alertmanager_cluster_refresh_join_total | counter | ins, instance, ip, job, cls | A counter of the number of cluster peer joined via refresh. |
| alertmanager_config_hash | gauge | ins, instance, ip, job, cls | Hash of the currently loaded alertmanager configuration. |
| alertmanager_config_last_reload_success_timestamp_seconds | gauge | ins, instance, ip, job, cls | Timestamp of the last successful configuration reload. |
| alertmanager_config_last_reload_successful | gauge | ins, instance, ip, job, cls | Whether the last configuration reload attempt was successful. |
| alertmanager_dispatcher_aggregation_groups | gauge | ins, instance, ip, job, cls | Number of active aggregation groups |
| alertmanager_dispatcher_alert_processing_duration_seconds_count | Unknown | ins, instance, ip, job, cls | N/A |
| alertmanager_dispatcher_alert_processing_duration_seconds_sum | Unknown | ins, instance, ip, job, cls | N/A |
| alertmanager_http_concurrency_limit_exceeded_total | counter | ins, instance, method, ip, job, cls | Total number of times an HTTP request failed because the concurrency limit was reached. |
| alertmanager_http_request_duration_seconds_bucket | Unknown | ins, instance, method, ip, le, job, cls, handler | N/A |
| alertmanager_http_request_duration_seconds_count | Unknown | ins, instance, method, ip, job, cls, handler | N/A |
| alertmanager_http_request_duration_seconds_sum | Unknown | ins, instance, method, ip, job, cls, handler | N/A |
| alertmanager_http_requests_in_flight | gauge | ins, instance, method, ip, job, cls | Current number of HTTP requests being processed. |
| alertmanager_http_response_size_bytes_bucket | Unknown | ins, instance, method, ip, le, job, cls, handler | N/A |
| alertmanager_http_response_size_bytes_count | Unknown | ins, instance, method, ip, job, cls, handler | N/A |
| alertmanager_http_response_size_bytes_sum | Unknown | ins, instance, method, ip, job, cls, handler | N/A |
| alertmanager_integrations | gauge | ins, instance, ip, job, cls | Number of configured integrations. |
| alertmanager_marked_alerts | gauge | ins, instance, ip, job, cls, state | How many alerts by state are currently marked in the Alertmanager regardless of their expiry. |
| alertmanager_nflog_gc_duration_seconds_count | Unknown | ins, instance, ip, job, cls | N/A |
| alertmanager_nflog_gc_duration_seconds_sum | Unknown | ins, instance, ip, job, cls | N/A |
| alertmanager_nflog_gossip_messages_propagated_total | counter | ins, instance, ip, job, cls | Number of received gossip messages that have been further gossiped. |
| alertmanager_nflog_maintenance_errors_total | counter | ins, instance, ip, job, cls | How many maintenances were executed for the notification log that failed. |
| alertmanager_nflog_maintenance_total | counter | ins, instance, ip, job, cls | How many maintenances were executed for the notification log. |
| alertmanager_nflog_queries_total | counter | ins, instance, ip, job, cls | Number of notification log queries were received. |
| alertmanager_nflog_query_duration_seconds_bucket | Unknown | ins, instance, ip, le, job, cls | N/A |
| alertmanager_nflog_query_duration_seconds_count | Unknown | ins, instance, ip, job, cls | N/A |
| alertmanager_nflog_query_duration_seconds_sum | Unknown | ins, instance, ip, job, cls | N/A |
| alertmanager_nflog_query_errors_total | counter | ins, instance, ip, job, cls | Number notification log received queries that failed. |
| alertmanager_nflog_snapshot_duration_seconds_count | Unknown | ins, instance, ip, job, cls | N/A |
| alertmanager_nflog_snapshot_duration_seconds_sum | Unknown | ins, instance, ip, job, cls | N/A |
| alertmanager_nflog_snapshot_size_bytes | gauge | ins, instance, ip, job, cls | Size of the last notification log snapshot in bytes. |
| alertmanager_notification_latency_seconds_bucket | Unknown | integration, ins, instance, ip, le, job, cls | N/A |
| alertmanager_notification_latency_seconds_count | Unknown | integration, ins, instance, ip, job, cls | N/A |
| alertmanager_notification_latency_seconds_sum | Unknown | integration, ins, instance, ip, job, cls | N/A |
| alertmanager_notification_requests_failed_total | counter | integration, ins, instance, ip, job, cls | The total number of failed notification requests. |
| alertmanager_notification_requests_total | counter | integration, ins, instance, ip, job, cls | The total number of attempted notification requests. |
| alertmanager_notifications_failed_total | counter | integration, ins, instance, ip, reason, job, cls | The total number of failed notifications. |
| alertmanager_notifications_total | counter | integration, ins, instance, ip, job, cls | The total number of attempted notifications. |
| alertmanager_oversize_gossip_message_duration_seconds_bucket | Unknown | ins, instance, ip, le, key, job, cls | N/A |
| alertmanager_oversize_gossip_message_duration_seconds_count | Unknown | ins, instance, ip, key, job, cls | N/A |
| alertmanager_oversize_gossip_message_duration_seconds_sum | Unknown | ins, instance, ip, key, job, cls | N/A |
| alertmanager_oversized_gossip_message_dropped_total | counter | ins, instance, ip, key, job, cls | Number of oversized gossip messages that were dropped due to a full message queue. |
| alertmanager_oversized_gossip_message_failure_total | counter | ins, instance, ip, key, job, cls | Number of oversized gossip message sends that failed. |
| alertmanager_oversized_gossip_message_sent_total | counter | ins, instance, ip, key, job, cls | Number of oversized gossip message sent. |
| alertmanager_peer_position | gauge | ins, instance, ip, job, cls | Position the Alertmanager instance believes it’s in. The position determines a peer’s behavior in the cluster. |
| alertmanager_receivers | gauge | ins, instance, ip, job, cls | Number of configured receivers. |
| alertmanager_silences | gauge | ins, instance, ip, job, cls, state | How many silences by state. |
| alertmanager_silences_gc_duration_seconds_count | Unknown | ins, instance, ip, job, cls | N/A |
| alertmanager_silences_gc_duration_seconds_sum | Unknown | ins, instance, ip, job, cls | N/A |
| alertmanager_silences_gossip_messages_propagated_total | counter | ins, instance, ip, job, cls | Number of received gossip messages that have been further gossiped. |
| alertmanager_silences_maintenance_errors_total | counter | ins, instance, ip, job, cls | How many maintenances were executed for silences that failed. |
| alertmanager_silences_maintenance_total | counter | ins, instance, ip, job, cls | How many maintenances were executed for silences. |
| alertmanager_silences_queries_total | counter | ins, instance, ip, job, cls | How many silence queries were received. |
| alertmanager_silences_query_duration_seconds_bucket | Unknown | ins, instance, ip, le, job, cls | N/A |
| alertmanager_silences_query_duration_seconds_count | Unknown | ins, instance, ip, job, cls | N/A |
| alertmanager_silences_query_duration_seconds_sum | Unknown | ins, instance, ip, job, cls | N/A |
| alertmanager_silences_query_errors_total | counter | ins, instance, ip, job, cls | How many silence received queries did not succeed. |
| alertmanager_silences_snapshot_duration_seconds_count | Unknown | ins, instance, ip, job, cls | N/A |
| alertmanager_silences_snapshot_duration_seconds_sum | Unknown | ins, instance, ip, job, cls | N/A |
| alertmanager_silences_snapshot_size_bytes | gauge | ins, instance, ip, job, cls | Size of the last silence snapshot in bytes. |
| blackbox_exporter_build_info | gauge | revision, version, ins, instance, ip, tags, goarch, goversion, job, cls, branch, goos | A metric with a constant ‘1’ value labeled by version, revision, branch, goversion from which blackbox_exporter was built, and the goos and goarch for the build. |
| blackbox_exporter_config_last_reload_success_timestamp_seconds | gauge | ins, instance, ip, job, cls | Timestamp of the last successful configuration reload. |
| blackbox_exporter_config_last_reload_successful | gauge | ins, instance, ip, job, cls | Blackbox exporter config loaded successfully. |
| blackbox_module_unknown_total | counter | ins, instance, ip, job, cls | Count of unknown modules requested by probes |
| cortex_distributor_ingester_clients | gauge | ins, instance, ip, job, cls | The current number of ingester clients. |
| cortex_dns_failures_total | Unknown | ins, instance, ip, job, cls | N/A |
| cortex_dns_lookups_total | Unknown | ins, instance, ip, job, cls | N/A |
| cortex_frontend_query_range_duration_seconds_bucket | Unknown | ins, instance, method, ip, le, job, cls, status_code | N/A |
| cortex_frontend_query_range_duration_seconds_count | Unknown | ins, instance, method, ip, job, cls, status_code | N/A |
| cortex_frontend_query_range_duration_seconds_sum | Unknown | ins, instance, method, ip, job, cls, status_code | N/A |
| cortex_ingester_flush_queue_length | gauge | ins, instance, ip, job, cls | The total number of series pending in the flush queue. |
| cortex_kv_request_duration_seconds_bucket | Unknown | ins, instance, role, ip, le, kv_name, type, operation, job, cls, status_code | N/A |
| cortex_kv_request_duration_seconds_count | Unknown | ins, instance, role, ip, kv_name, type, operation, job, cls, status_code | N/A |
| cortex_kv_request_duration_seconds_sum | Unknown | ins, instance, role, ip, kv_name, type, operation, job, cls, status_code | N/A |
| cortex_member_consul_heartbeats_total | Unknown | ins, instance, ip, job, cls | N/A |
| cortex_prometheus_notifications_alertmanagers_discovered | gauge | ins, instance, ip, user, job, cls | The number of alertmanagers discovered and active. |
| cortex_prometheus_notifications_dropped_total | Unknown | ins, instance, ip, user, job, cls | N/A |
| cortex_prometheus_notifications_queue_capacity | gauge | ins, instance, ip, user, job, cls | The capacity of the alert notifications queue. |
| cortex_prometheus_notifications_queue_length | gauge | ins, instance, ip, user, job, cls | The number of alert notifications in the queue. |
| cortex_prometheus_rule_evaluation_duration_seconds | summary | ins, instance, ip, user, job, cls, quantile | The duration for a rule to execute. |
| cortex_prometheus_rule_evaluation_duration_seconds_count | Unknown | ins, instance, ip, user, job, cls | N/A |
| cortex_prometheus_rule_evaluation_duration_seconds_sum | Unknown | ins, instance, ip, user, job, cls | N/A |
| cortex_prometheus_rule_group_duration_seconds | summary | ins, instance, ip, user, job, cls, quantile | The duration of rule group evaluations. |
| cortex_prometheus_rule_group_duration_seconds_count | Unknown | ins, instance, ip, user, job, cls | N/A |
| cortex_prometheus_rule_group_duration_seconds_sum | Unknown | ins, instance, ip, user, job, cls | N/A |
| cortex_query_frontend_connected_schedulers | gauge | ins, instance, ip, job, cls | Number of schedulers this frontend is connected to. |
| cortex_query_frontend_queries_in_progress | gauge | ins, instance, ip, job, cls | Number of queries in progress handled by this frontend. |
| cortex_query_frontend_retries_bucket | Unknown | ins, instance, ip, le, job, cls | N/A |
| cortex_query_frontend_retries_count | Unknown | ins, instance, ip, job, cls | N/A |
| cortex_query_frontend_retries_sum | Unknown | ins, instance, ip, job, cls | N/A |
| cortex_query_scheduler_connected_frontend_clients | gauge | ins, instance, ip, job, cls | Number of query-frontend worker clients currently connected to the query-scheduler. |
| cortex_query_scheduler_connected_querier_clients | gauge | ins, instance, ip, job, cls | Number of querier worker clients currently connected to the query-scheduler. |
| cortex_query_scheduler_inflight_requests | summary | ins, instance, ip, job, cls, quantile | Number of inflight requests (either queued or processing) sampled at a regular interval. Quantile buckets keep track of inflight requests over the last 60s. |
| cortex_query_scheduler_inflight_requests_count | Unknown | ins, instance, ip, job, cls | N/A |
| cortex_query_scheduler_inflight_requests_sum | Unknown | ins, instance, ip, job, cls | N/A |
| cortex_query_scheduler_queue_duration_seconds_bucket | Unknown | ins, instance, ip, le, job, cls | N/A |
| cortex_query_scheduler_queue_duration_seconds_count | Unknown | ins, instance, ip, job, cls | N/A |
| cortex_query_scheduler_queue_duration_seconds_sum | Unknown | ins, instance, ip, job, cls | N/A |
| cortex_query_scheduler_queue_length | Unknown | ins, instance, ip, user, job, cls | N/A |
| cortex_query_scheduler_running | gauge | ins, instance, ip, job, cls | Value will be 1 if the scheduler is in the ReplicationSet and actively receiving/processing requests |
| cortex_ring_member_heartbeats_total | Unknown | ins, instance, ip, job, cls | N/A |
| cortex_ring_member_tokens_owned | gauge | ins, instance, ip, job, cls | The number of tokens owned in the ring. |
| cortex_ring_member_tokens_to_own | gauge | ins, instance, ip, job, cls | The number of tokens to own in the ring. |
| cortex_ring_members | gauge | ins, instance, ip, job, cls, state | Number of members in the ring |
| cortex_ring_oldest_member_timestamp | gauge | ins, instance, ip, job, cls, state | Timestamp of the oldest member in the ring. |
| cortex_ring_tokens_total | gauge | ins, instance, ip, job, cls | Number of tokens in the ring |
| cortex_ruler_clients | gauge | ins, instance, ip, job, cls | The current number of ruler clients in the pool. |
| cortex_ruler_config_last_reload_successful | gauge | ins, instance, ip, user, job, cls | Boolean set to 1 whenever the last configuration reload attempt was successful. |
| cortex_ruler_config_last_reload_successful_seconds | gauge | ins, instance, ip, user, job, cls | Timestamp of the last successful configuration reload. |
| cortex_ruler_config_updates_total | Unknown | ins, instance, ip, user, job, cls | N/A |
| cortex_ruler_managers_total | gauge | ins, instance, ip, job, cls | Total number of managers registered and running in the ruler |
| cortex_ruler_ring_check_errors_total | Unknown | ins, instance, ip, job, cls | N/A |
| cortex_ruler_sync_rules_total | Unknown | ins, instance, ip, reason, job, cls | N/A |
| deprecated_flags_inuse_total | Unknown | ins, instance, ip, job, cls | N/A |
| go_cgo_go_to_c_calls_calls_total | Unknown | ins, instance, ip, job, cls | N/A |
| go_cpu_classes_gc_mark_assist_cpu_seconds_total | Unknown | ins, instance, ip, job, cls | N/A |
| go_cpu_classes_gc_mark_dedicated_cpu_seconds_total | Unknown | ins, instance, ip, job, cls | N/A |
| go_cpu_classes_gc_mark_idle_cpu_seconds_total | Unknown | ins, instance, ip, job, cls | N/A |
| go_cpu_classes_gc_pause_cpu_seconds_total | Unknown | ins, instance, ip, job, cls | N/A |
| go_cpu_classes_gc_total_cpu_seconds_total | Unknown | ins, instance, ip, job, cls | N/A |
| go_cpu_classes_idle_cpu_seconds_total | Unknown | ins, instance, ip, job, cls | N/A |
| go_cpu_classes_scavenge_assist_cpu_seconds_total | Unknown | ins, instance, ip, job, cls | N/A |
| go_cpu_classes_scavenge_background_cpu_seconds_total | Unknown | ins, instance, ip, job, cls | N/A |
| go_cpu_classes_scavenge_total_cpu_seconds_total | Unknown | ins, instance, ip, job, cls | N/A |
| go_cpu_classes_total_cpu_seconds_total | Unknown | ins, instance, ip, job, cls | N/A |
| go_cpu_classes_user_cpu_seconds_total | Unknown | ins, instance, ip, job, cls | N/A |
| go_gc_cycles_automatic_gc_cycles_total | Unknown | ins, instance, ip, job, cls | N/A |
| go_gc_cycles_forced_gc_cycles_total | Unknown | ins, instance, ip, job, cls | N/A |
| go_gc_cycles_total_gc_cycles_total | Unknown | ins, instance, ip, job, cls | N/A |
| go_gc_duration_seconds | summary | ins, instance, ip, job, cls, quantile | A summary of the pause duration of garbage collection cycles. |
| go_gc_duration_seconds_count | Unknown | ins, instance, ip, job, cls | N/A |
| go_gc_duration_seconds_sum | Unknown | ins, instance, ip, job, cls | N/A |
| go_gc_gogc_percent | gauge | ins, instance, ip, job, cls | Heap size target percentage configured by the user, otherwise 100. This value is set by the GOGC environment variable, and the runtime/debug.SetGCPercent function. |
| go_gc_gomemlimit_bytes | gauge | ins, instance, ip, job, cls | Go runtime memory limit configured by the user, otherwise math.MaxInt64. This value is set by the GOMEMLIMIT environment variable, and the runtime/debug.SetMemoryLimit function. |
| go_gc_heap_allocs_by_size_bytes_bucket | Unknown | ins, instance, ip, le, job, cls | N/A |
| go_gc_heap_allocs_by_size_bytes_count | Unknown | ins, instance, ip, job, cls | N/A |
| go_gc_heap_allocs_by_size_bytes_sum | Unknown | ins, instance, ip, job, cls | N/A |
| go_gc_heap_allocs_bytes_total | Unknown | ins, instance, ip, job, cls | N/A |
| go_gc_heap_allocs_objects_total | Unknown | ins, instance, ip, job, cls | N/A |
| go_gc_heap_frees_by_size_bytes_bucket | Unknown | ins, instance, ip, le, job, cls | N/A |
| go_gc_heap_frees_by_size_bytes_count | Unknown | ins, instance, ip, job, cls | N/A |
| go_gc_heap_frees_by_size_bytes_sum | Unknown | ins, instance, ip, job, cls | N/A |
| go_gc_heap_frees_bytes_total | Unknown | ins, instance, ip, job, cls | N/A |
| go_gc_heap_frees_objects_total | Unknown | ins, instance, ip, job, cls | N/A |
| go_gc_heap_goal_bytes | gauge | ins, instance, ip, job, cls | Heap size target for the end of the GC cycle. |
| go_gc_heap_live_bytes | gauge | ins, instance, ip, job, cls | Heap memory occupied by live objects that were marked by the previous GC. |
| go_gc_heap_objects_objects | gauge | ins, instance, ip, job, cls | Number of objects, live or unswept, occupying heap memory. |
| go_gc_heap_tiny_allocs_objects_total | Unknown | ins, instance, ip, job, cls | N/A |
| go_gc_limiter_last_enabled_gc_cycle | gauge | ins, instance, ip, job, cls | GC cycle the last time the GC CPU limiter was enabled. This metric is useful for diagnosing the root cause of an out-of-memory error, because the limiter trades memory for CPU time when the GC’s CPU time gets too high. This is most likely to occur with use of SetMemoryLimit. The first GC cycle is cycle 1, so a value of 0 indicates that it was never enabled. |
| go_gc_pauses_seconds_bucket | Unknown | ins, instance, ip, le, job, cls | N/A |
| go_gc_pauses_seconds_count | Unknown | ins, instance, ip, job, cls | N/A |
| go_gc_pauses_seconds_sum | Unknown | ins, instance, ip, job, cls | N/A |
| go_gc_scan_globals_bytes | gauge | ins, instance, ip, job, cls | The total amount of global variable space that is scannable. |
| go_gc_scan_heap_bytes | gauge | ins, instance, ip, job, cls | The total amount of heap space that is scannable. |
| go_gc_scan_stack_bytes | gauge | ins, instance, ip, job, cls | The number of bytes of stack that were scanned last GC cycle. |
| go_gc_scan_total_bytes | gauge | ins, instance, ip, job, cls | The total amount space that is scannable. Sum of all metrics in /gc/scan. |
| go_gc_stack_starting_size_bytes | gauge | ins, instance, ip, job, cls | The stack size of new goroutines. |
| go_godebug_non_default_behavior_execerrdot_events_total | Unknown | ins, instance, ip, job, cls | N/A |
| go_godebug_non_default_behavior_gocachehash_events_total | Unknown | ins, instance, ip, job, cls | N/A |
| go_godebug_non_default_behavior_gocachetest_events_total | Unknown | ins, instance, ip, job, cls | N/A |
| go_godebug_non_default_behavior_gocacheverify_events_total | Unknown | ins, instance, ip, job, cls | N/A |
| go_godebug_non_default_behavior_http2client_events_total | Unknown | ins, instance, ip, job, cls | N/A |
| go_godebug_non_default_behavior_http2server_events_total | Unknown | ins, instance, ip, job, cls | N/A |
| go_godebug_non_default_behavior_installgoroot_events_total | Unknown | ins, instance, ip, job, cls | N/A |
| go_godebug_non_default_behavior_jstmpllitinterp_events_total | Unknown | ins, instance, ip, job, cls | N/A |
| go_godebug_non_default_behavior_multipartmaxheaders_events_total | Unknown | ins, instance, ip, job, cls | N/A |
| go_godebug_non_default_behavior_multipartmaxparts_events_total | Unknown | ins, instance, ip, job, cls | N/A |
| go_godebug_non_default_behavior_multipathtcp_events_total | Unknown | ins, instance, ip, job, cls | N/A |
| go_godebug_non_default_behavior_panicnil_events_total | Unknown | ins, instance, ip, job, cls | N/A |
| go_godebug_non_default_behavior_randautoseed_events_total | Unknown | ins, instance, ip, job, cls | N/A |
| go_godebug_non_default_behavior_tarinsecurepath_events_total | Unknown | ins, instance, ip, job, cls | N/A |
| go_godebug_non_default_behavior_tlsmaxrsasize_events_total | Unknown | ins, instance, ip, job, cls | N/A |
| go_godebug_non_default_behavior_x509sha1_events_total | Unknown | ins, instance, ip, job, cls | N/A |
| go_godebug_non_default_behavior_x509usefallbackroots_events_total | Unknown | ins, instance, ip, job, cls | N/A |
| go_godebug_non_default_behavior_zipinsecurepath_events_total | Unknown | ins, instance, ip, job, cls | N/A |
| go_goroutines | gauge | ins, instance, ip, job, cls | Number of goroutines that currently exist. |
| go_info | gauge | version, ins, instance, ip, job, cls | Information about the Go environment. |
| go_memory_classes_heap_free_bytes | gauge | ins, instance, ip, job, cls | Memory that is completely free and eligible to be returned to the underlying system, but has not been. This metric is the runtime’s estimate of free address space that is backed by physical memory. |
| go_memory_classes_heap_objects_bytes | gauge | ins, instance, ip, job, cls | Memory occupied by live objects and dead objects that have not yet been marked free by the garbage collector. |
| go_memory_classes_heap_released_bytes | gauge | ins, instance, ip, job, cls | Memory that is completely free and has been returned to the underlying system. This metric is the runtime’s estimate of free address space that is still mapped into the process, but is not backed by physical memory. |
| go_memory_classes_heap_stacks_bytes | gauge | ins, instance, ip, job, cls | Memory allocated from the heap that is reserved for stack space, whether or not it is currently in-use. Currently, this represents all stack memory for goroutines. It also includes all OS thread stacks in non-cgo programs. Note that stacks may be allocated differently in the future, and this may change. |
| go_memory_classes_heap_unused_bytes | gauge | ins, instance, ip, job, cls | Memory that is reserved for heap objects but is not currently used to hold heap objects. |
| go_memory_classes_metadata_mcache_free_bytes | gauge | ins, instance, ip, job, cls | Memory that is reserved for runtime mcache structures, but not in-use. |
| go_memory_classes_metadata_mcache_inuse_bytes | gauge | ins, instance, ip, job, cls | Memory that is occupied by runtime mcache structures that are currently being used. |
| go_memory_classes_metadata_mspan_free_bytes | gauge | ins, instance, ip, job, cls | Memory that is reserved for runtime mspan structures, but not in-use. |
| go_memory_classes_metadata_mspan_inuse_bytes | gauge | ins, instance, ip, job, cls | Memory that is occupied by runtime mspan structures that are currently being used. |
| go_memory_classes_metadata_other_bytes | gauge | ins, instance, ip, job, cls | Memory that is reserved for or used to hold runtime metadata. |
| go_memory_classes_os_stacks_bytes | gauge | ins, instance, ip, job, cls | Stack memory allocated by the underlying operating system. In non-cgo programs this metric is currently zero. This may change in the future.In cgo programs this metric includes OS thread stacks allocated directly from the OS. Currently, this only accounts for one stack in c-shared and c-archive build modes, and other sources of stacks from the OS are not measured. This too may change in the future. |
| go_memory_classes_other_bytes | gauge | ins, instance, ip, job, cls | Memory used by execution trace buffers, structures for debugging the runtime, finalizer and profiler specials, and more. |
| go_memory_classes_profiling_buckets_bytes | gauge | ins, instance, ip, job, cls | Memory that is used by the stack trace hash map used for profiling. |
| go_memory_classes_total_bytes | gauge | ins, instance, ip, job, cls | All memory mapped by the Go runtime into the current process as read-write. Note that this does not include memory mapped by code called via cgo or via the syscall package. Sum of all metrics in /memory/classes. |
| go_memstats_alloc_bytes | counter | ins, instance, ip, job, cls | Total number of bytes allocated, even if freed. |
| go_memstats_alloc_bytes_total | counter | ins, instance, ip, job, cls | Total number of bytes allocated, even if freed. |
| go_memstats_buck_hash_sys_bytes | gauge | ins, instance, ip, job, cls | Number of bytes used by the profiling bucket hash table. |
| go_memstats_frees_total | counter | ins, instance, ip, job, cls | Total number of frees. |
| go_memstats_gc_sys_bytes | gauge | ins, instance, ip, job, cls | Number of bytes used for garbage collection system metadata. |
| go_memstats_heap_alloc_bytes | gauge | ins, instance, ip, job, cls | Number of heap bytes allocated and still in use. |
| go_memstats_heap_idle_bytes | gauge | ins, instance, ip, job, cls | Number of heap bytes waiting to be used. |
| go_memstats_heap_inuse_bytes | gauge | ins, instance, ip, job, cls | Number of heap bytes that are in use. |
| go_memstats_heap_objects | gauge | ins, instance, ip, job, cls | Number of allocated objects. |
| go_memstats_heap_released_bytes | gauge | ins, instance, ip, job, cls | Number of heap bytes released to OS. |
| go_memstats_heap_sys_bytes | gauge | ins, instance, ip, job, cls | Number of heap bytes obtained from system. |
| go_memstats_last_gc_time_seconds | gauge | ins, instance, ip, job, cls | Number of seconds since 1970 of last garbage collection. |
| go_memstats_lookups_total | counter | ins, instance, ip, job, cls | Total number of pointer lookups. |
| go_memstats_mallocs_total | counter | ins, instance, ip, job, cls | Total number of mallocs. |
| go_memstats_mcache_inuse_bytes | gauge | ins, instance, ip, job, cls | Number of bytes in use by mcache structures. |
| go_memstats_mcache_sys_bytes | gauge | ins, instance, ip, job, cls | Number of bytes used for mcache structures obtained from system. |
| go_memstats_mspan_inuse_bytes | gauge | ins, instance, ip, job, cls | Number of bytes in use by mspan structures. |
| go_memstats_mspan_sys_bytes | gauge | ins, instance, ip, job, cls | Number of bytes used for mspan structures obtained from system. |
| go_memstats_next_gc_bytes | gauge | ins, instance, ip, job, cls | Number of heap bytes when next garbage collection will take place. |
| go_memstats_other_sys_bytes | gauge | ins, instance, ip, job, cls | Number of bytes used for other system allocations. |
| go_memstats_stack_inuse_bytes | gauge | ins, instance, ip, job, cls | Number of bytes in use by the stack allocator. |
| go_memstats_stack_sys_bytes | gauge | ins, instance, ip, job, cls | Number of bytes obtained from system for stack allocator. |
| go_memstats_sys_bytes | gauge | ins, instance, ip, job, cls | Number of bytes obtained from system. |
| go_sched_gomaxprocs_threads | gauge | ins, instance, ip, job, cls | The current runtime.GOMAXPROCS setting, or the number of operating system threads that can execute user-level Go code simultaneously. |
| go_sched_goroutines_goroutines | gauge | ins, instance, ip, job, cls | Count of live goroutines. |
| go_sched_latencies_seconds_bucket | Unknown | ins, instance, ip, le, job, cls | N/A |
| go_sched_latencies_seconds_count | Unknown | ins, instance, ip, job, cls | N/A |
| go_sched_latencies_seconds_sum | Unknown | ins, instance, ip, job, cls | N/A |
| go_sql_stats_connections_blocked_seconds | unknown | ins, instance, db_name, ip, job, cls | The total time blocked waiting for a new connection. |
| go_sql_stats_connections_closed_max_idle | unknown | ins, instance, db_name, ip, job, cls | The total number of connections closed due to SetMaxIdleConns. |
| go_sql_stats_connections_closed_max_idle_time | unknown | ins, instance, db_name, ip, job, cls | The total number of connections closed due to SetConnMaxIdleTime. |
| go_sql_stats_connections_closed_max_lifetime | unknown | ins, instance, db_name, ip, job, cls | The total number of connections closed due to SetConnMaxLifetime. |
| go_sql_stats_connections_idle | gauge | ins, instance, db_name, ip, job, cls | The number of idle connections. |
| go_sql_stats_connections_in_use | gauge | ins, instance, db_name, ip, job, cls | The number of connections currently in use. |
| go_sql_stats_connections_max_open | gauge | ins, instance, db_name, ip, job, cls | Maximum number of open connections to the database. |
| go_sql_stats_connections_open | gauge | ins, instance, db_name, ip, job, cls | The number of established connections both in use and idle. |
| go_sql_stats_connections_waited_for | unknown | ins, instance, db_name, ip, job, cls | The total number of connections waited for. |
| go_sync_mutex_wait_total_seconds_total | Unknown | ins, instance, ip, job, cls | N/A |
| go_threads | gauge | ins, instance, ip, job, cls | Number of OS threads created. |
| grafana_access_evaluation_count | unknown | ins, instance, ip, job, cls | number of evaluation calls |
| grafana_access_evaluation_duration_bucket | Unknown | ins, instance, ip, le, job, cls | N/A |
| grafana_access_evaluation_duration_count | Unknown | ins, instance, ip, job, cls | N/A |
| grafana_access_evaluation_duration_sum | Unknown | ins, instance, ip, job, cls | N/A |
| grafana_access_permissions_duration_bucket | Unknown | ins, instance, ip, le, job, cls | N/A |
| grafana_access_permissions_duration_count | Unknown | ins, instance, ip, job, cls | N/A |
| grafana_access_permissions_duration_sum | Unknown | ins, instance, ip, job, cls | N/A |
| grafana_aggregator_discovery_aggregation_count_total | Unknown | ins, instance, ip, job, cls | N/A |
| grafana_alerting_active_alerts | gauge | ins, instance, ip, job, cls | amount of active alerts |
| grafana_alerting_active_configurations | gauge | ins, instance, ip, job, cls | The number of active Alertmanager configurations. |
| grafana_alerting_alertmanager_config_match | gauge | ins, instance, ip, job, cls | The total number of match |
| grafana_alerting_alertmanager_config_match_re | gauge | ins, instance, ip, job, cls | The total number of matchRE |
| grafana_alerting_alertmanager_config_matchers | gauge | ins, instance, ip, job, cls | The total number of matchers |
| grafana_alerting_alertmanager_config_object_matchers | gauge | ins, instance, ip, job, cls | The total number of object_matchers |
| grafana_alerting_discovered_configurations | gauge | ins, instance, ip, job, cls | The number of organizations we’ve discovered that require an Alertmanager configuration. |
| grafana_alerting_dispatcher_aggregation_groups | gauge | ins, instance, ip, job, cls | Number of active aggregation groups |
| grafana_alerting_dispatcher_alert_processing_duration_seconds_count | Unknown | ins, instance, ip, job, cls | N/A |
| grafana_alerting_dispatcher_alert_processing_duration_seconds_sum | Unknown | ins, instance, ip, job, cls | N/A |
| grafana_alerting_execution_time_milliseconds | summary | ins, instance, ip, job, cls, quantile | summary of alert execution duration |
| grafana_alerting_execution_time_milliseconds_count | Unknown | ins, instance, ip, job, cls | N/A |
| grafana_alerting_execution_time_milliseconds_sum | Unknown | ins, instance, ip, job, cls | N/A |
| grafana_alerting_nflog_gc_duration_seconds_count | Unknown | ins, instance, ip, job, cls | N/A |
| grafana_alerting_nflog_gc_duration_seconds_sum | Unknown | ins, instance, ip, job, cls | N/A |
| grafana_alerting_nflog_gossip_messages_propagated_total | Unknown | ins, instance, ip, job, cls | N/A |
| grafana_alerting_nflog_queries_total | Unknown | ins, instance, ip, job, cls | N/A |
| grafana_alerting_nflog_query_duration_seconds_bucket | Unknown | ins, instance, ip, le, job, cls | N/A |
| grafana_alerting_nflog_query_duration_seconds_count | Unknown | ins, instance, ip, job, cls | N/A |
| grafana_alerting_nflog_query_duration_seconds_sum | Unknown | ins, instance, ip, job, cls | N/A |
| grafana_alerting_nflog_query_errors_total | Unknown | ins, instance, ip, job, cls | N/A |
| grafana_alerting_nflog_snapshot_duration_seconds_count | Unknown | ins, instance, ip, job, cls | N/A |
| grafana_alerting_nflog_snapshot_duration_seconds_sum | Unknown | ins, instance, ip, job, cls | N/A |
| grafana_alerting_nflog_snapshot_size_bytes | gauge | ins, instance, ip, job, cls | Size of the last notification log snapshot in bytes. |
| grafana_alerting_notification_latency_seconds_bucket | Unknown | ins, instance, ip, le, job, cls | N/A |
| grafana_alerting_notification_latency_seconds_count | Unknown | ins, instance, ip, job, cls | N/A |
| grafana_alerting_notification_latency_seconds_sum | Unknown | ins, instance, ip, job, cls | N/A |
| grafana_alerting_schedule_alert_rules | gauge | ins, instance, ip, job, cls | The number of alert rules that could be considered for evaluation at the next tick. |
| grafana_alerting_schedule_alert_rules_hash | gauge | ins, instance, ip, job, cls | A hash of the alert rules that could be considered for evaluation at the next tick. |
| grafana_alerting_schedule_periodic_duration_seconds_bucket | Unknown | ins, instance, ip, le, job, cls | N/A |
| grafana_alerting_schedule_periodic_duration_seconds_count | Unknown | ins, instance, ip, job, cls | N/A |
| grafana_alerting_schedule_periodic_duration_seconds_sum | Unknown | ins, instance, ip, job, cls | N/A |
| grafana_alerting_schedule_query_alert_rules_duration_seconds_bucket | Unknown | ins, instance, ip, le, job, cls | N/A |
| grafana_alerting_schedule_query_alert_rules_duration_seconds_count | Unknown | ins, instance, ip, job, cls | N/A |
| grafana_alerting_schedule_query_alert_rules_duration_seconds_sum | Unknown | ins, instance, ip, job, cls | N/A |
| grafana_alerting_scheduler_behind_seconds | gauge | ins, instance, ip, job, cls | The total number of seconds the scheduler is behind. |
| grafana_alerting_silences_gc_duration_seconds_count | Unknown | ins, instance, ip, job, cls | N/A |
| grafana_alerting_silences_gc_duration_seconds_sum | Unknown | ins, instance, ip, job, cls | N/A |
| grafana_alerting_silences_gossip_messages_propagated_total | Unknown | ins, instance, ip, job, cls | N/A |
| grafana_alerting_silences_queries_total | Unknown | ins, instance, ip, job, cls | N/A |
| grafana_alerting_silences_query_duration_seconds_bucket | Unknown | ins, instance, ip, le, job, cls | N/A |
| grafana_alerting_silences_query_duration_seconds_count | Unknown | ins, instance, ip, job, cls | N/A |
| grafana_alerting_silences_query_duration_seconds_sum | Unknown | ins, instance, ip, job, cls | N/A |
| grafana_alerting_silences_query_errors_total | Unknown | ins, instance, ip, job, cls | N/A |
| grafana_alerting_silences_snapshot_duration_seconds_count | Unknown | ins, instance, ip, job, cls | N/A |
| grafana_alerting_silences_snapshot_duration_seconds_sum | Unknown | ins, instance, ip, job, cls | N/A |
| grafana_alerting_silences_snapshot_size_bytes | gauge | ins, instance, ip, job, cls | Size of the last silence snapshot in bytes. |
| grafana_alerting_state_calculation_duration_seconds_bucket | Unknown | ins, instance, ip, le, job, cls | N/A |
| grafana_alerting_state_calculation_duration_seconds_count | Unknown | ins, instance, ip, job, cls | N/A |
| grafana_alerting_state_calculation_duration_seconds_sum | Unknown | ins, instance, ip, job, cls | N/A |
| grafana_alerting_state_history_writes_bytes_total | Unknown | ins, instance, ip, job, cls | N/A |
| grafana_alerting_ticker_interval_seconds | gauge | ins, instance, ip, job, cls | Interval at which the ticker is meant to tick. |
| grafana_alerting_ticker_last_consumed_tick_timestamp_seconds | gauge | ins, instance, ip, job, cls | Timestamp of the last consumed tick in seconds. |
| grafana_alerting_ticker_next_tick_timestamp_seconds | gauge | ins, instance, ip, job, cls | Timestamp of the next tick in seconds before it is consumed. |
| grafana_api_admin_user_created_total | Unknown | ins, instance, ip, job, cls | N/A |
| grafana_api_dashboard_get_milliseconds | summary | ins, instance, ip, job, cls, quantile | summary for dashboard get duration |
| grafana_api_dashboard_get_milliseconds_count | Unknown | ins, instance, ip, job, cls | N/A |
| grafana_api_dashboard_get_milliseconds_sum | Unknown | ins, instance, ip, job, cls | N/A |
| grafana_api_dashboard_save_milliseconds | summary | ins, instance, ip, job, cls, quantile | summary for dashboard save duration |
| grafana_api_dashboard_save_milliseconds_count | Unknown | ins, instance, ip, job, cls | N/A |
| grafana_api_dashboard_save_milliseconds_sum | Unknown | ins, instance, ip, job, cls | N/A |
| grafana_api_dashboard_search_milliseconds | summary | ins, instance, ip, job, cls, quantile | summary for dashboard search duration |
| grafana_api_dashboard_search_milliseconds_count | Unknown | ins, instance, ip, job, cls | N/A |
| grafana_api_dashboard_search_milliseconds_sum | Unknown | ins, instance, ip, job, cls | N/A |
| grafana_api_dashboard_snapshot_create_total | Unknown | ins, instance, ip, job, cls | N/A |
| grafana_api_dashboard_snapshot_external_total | Unknown | ins, instance, ip, job, cls | N/A |
| grafana_api_dashboard_snapshot_get_total | Unknown | ins, instance, ip, job, cls | N/A |
| grafana_api_dataproxy_request_all_milliseconds | summary | ins, instance, ip, job, cls, quantile | summary for dataproxy request duration |
| grafana_api_dataproxy_request_all_milliseconds_count | Unknown | ins, instance, ip, job, cls | N/A |
| grafana_api_dataproxy_request_all_milliseconds_sum | Unknown | ins, instance, ip, job, cls | N/A |
| grafana_api_login_oauth_total | Unknown | ins, instance, ip, job, cls | N/A |
| grafana_api_login_post_total | Unknown | ins, instance, ip, job, cls | N/A |
| grafana_api_login_saml_total | Unknown | ins, instance, ip, job, cls | N/A |
| grafana_api_models_dashboard_insert_total | Unknown | ins, instance, ip, job, cls | N/A |
| grafana_api_org_create_total | Unknown | ins, instance, ip, job, cls | N/A |
| grafana_api_response_status_total | Unknown | ins, instance, ip, job, cls, code | N/A |
| grafana_api_user_signup_completed_total | Unknown | ins, instance, ip, job, cls | N/A |
| grafana_api_user_signup_invite_total | Unknown | ins, instance, ip, job, cls | N/A |
| grafana_api_user_signup_started_total | Unknown | ins, instance, ip, job, cls | N/A |
| grafana_apiserver_audit_event_total | Unknown | ins, instance, ip, job, cls | N/A |
| grafana_apiserver_audit_requests_rejected_total | Unknown | ins, instance, ip, job, cls | N/A |
| grafana_apiserver_client_certificate_expiration_seconds_bucket | Unknown | ins, instance, ip, le, job, cls | N/A |
| grafana_apiserver_client_certificate_expiration_seconds_count | Unknown | ins, instance, ip, job, cls | N/A |
| grafana_apiserver_client_certificate_expiration_seconds_sum | Unknown | ins, instance, ip, job, cls | N/A |
| grafana_apiserver_envelope_encryption_dek_cache_fill_percent | gauge | ins, instance, ip, job, cls | [ALPHA] Percent of the cache slots currently occupied by cached DEKs. |
| grafana_apiserver_flowcontrol_seat_fair_frac | gauge | ins, instance, ip, job, cls | [ALPHA] Fair fraction of server’s concurrency to allocate to each priority level that can use it |
| grafana_apiserver_storage_data_key_generation_duration_seconds_bucket | Unknown | ins, instance, ip, le, job, cls | N/A |
| grafana_apiserver_storage_data_key_generation_duration_seconds_count | Unknown | ins, instance, ip, job, cls | N/A |
| grafana_apiserver_storage_data_key_generation_duration_seconds_sum | Unknown | ins, instance, ip, job, cls | N/A |
| grafana_apiserver_storage_data_key_generation_failures_total | Unknown | ins, instance, ip, job, cls | N/A |
| grafana_apiserver_storage_envelope_transformation_cache_misses_total | Unknown | ins, instance, ip, job, cls | N/A |
| grafana_apiserver_tls_handshake_errors_total | Unknown | ins, instance, ip, job, cls | N/A |
| grafana_apiserver_webhooks_x509_insecure_sha1_total | Unknown | ins, instance, ip, job, cls | N/A |
| grafana_apiserver_webhooks_x509_missing_san_total | Unknown | ins, instance, ip, job, cls | N/A |
| grafana_authn_authn_failed_authentication_total | Unknown | ins, instance, ip, job, cls | N/A |
| grafana_authn_authn_successful_authentication_total | Unknown | ins, instance, ip, client, job, cls | N/A |
| grafana_authn_authn_successful_login_total | Unknown | ins, instance, ip, client, job, cls | N/A |
| grafana_aws_cloudwatch_get_metric_data_total | Unknown | ins, instance, ip, job, cls | N/A |
| grafana_aws_cloudwatch_get_metric_statistics_total | Unknown | ins, instance, ip, job, cls | N/A |
| grafana_aws_cloudwatch_list_metrics_total | Unknown | ins, instance, ip, job, cls | N/A |
| grafana_build_info | gauge | revision, version, ins, instance, edition, ip, goversion, job, cls, branch | A metric with a constant ‘1’ value labeled by version, revision, branch, and goversion from which Grafana was built |
| grafana_build_timestamp | gauge | revision, version, ins, instance, edition, ip, goversion, job, cls, branch | A metric exposing when the binary was built in epoch |
| grafana_cardinality_enforcement_unexpected_categorizations_total | Unknown | ins, instance, ip, job, cls | N/A |
| grafana_database_conn_idle | gauge | ins, instance, ip, job, cls | The number of idle connections |
| grafana_database_conn_in_use | gauge | ins, instance, ip, job, cls | The number of connections currently in use |
| grafana_database_conn_max_idle_closed_seconds | unknown | ins, instance, ip, job, cls | The total number of connections closed due to SetConnMaxIdleTime |
| grafana_database_conn_max_idle_closed_total | Unknown | ins, instance, ip, job, cls | N/A |
| grafana_database_conn_max_lifetime_closed_total | Unknown | ins, instance, ip, job, cls | N/A |
| grafana_database_conn_max_open | gauge | ins, instance, ip, job, cls | Maximum number of open connections to the database |
| grafana_database_conn_open | gauge | ins, instance, ip, job, cls | The number of established connections both in use and idle |
| grafana_database_conn_wait_count_total | Unknown | ins, instance, ip, job, cls | N/A |
| grafana_database_conn_wait_duration_seconds | unknown | ins, instance, ip, job, cls | The total time blocked waiting for a new connection |
| grafana_datasource_request_duration_seconds_bucket | Unknown | datasource, ins, instance, method, ip, le, datasource_type, job, cls, code | N/A |
| grafana_datasource_request_duration_seconds_count | Unknown | datasource, ins, instance, method, ip, datasource_type, job, cls, code | N/A |
| grafana_datasource_request_duration_seconds_sum | Unknown | datasource, ins, instance, method, ip, datasource_type, job, cls, code | N/A |
| grafana_datasource_request_in_flight | gauge | datasource, ins, instance, ip, datasource_type, job, cls | A gauge of outgoing data source requests currently being sent by Grafana |
| grafana_datasource_request_total | Unknown | datasource, ins, instance, method, ip, datasource_type, job, cls, code | N/A |
| grafana_datasource_response_size_bytes_bucket | Unknown | datasource, ins, instance, ip, le, datasource_type, job, cls | N/A |
| grafana_datasource_response_size_bytes_count | Unknown | datasource, ins, instance, ip, datasource_type, job, cls | N/A |
| grafana_datasource_response_size_bytes_sum | Unknown | datasource, ins, instance, ip, datasource_type, job, cls | N/A |
| grafana_db_datasource_query_by_id_total | Unknown | ins, instance, ip, job, cls | N/A |
| grafana_disabled_metrics_total | Unknown | ins, instance, ip, job, cls | N/A |
| grafana_emails_sent_failed | unknown | ins, instance, ip, job, cls | Number of emails Grafana failed to send |
| grafana_emails_sent_total | Unknown | ins, instance, ip, job, cls | N/A |
| grafana_encryption_cache_reads_total | Unknown | ins, instance, method, ip, hit, job, cls | N/A |
| grafana_encryption_ops_total | Unknown | ins, instance, ip, success, operation, job, cls | N/A |
| grafana_environment_info | gauge | version, ins, instance, ip, job, cls, commit | A metric with a constant ‘1’ value labeled by environment information about the running instance. |
| grafana_feature_toggles_info | gauge | ins, instance, ip, job, cls | info metric that exposes what feature toggles are enabled or not |
| grafana_frontend_boot_css_time_seconds_bucket | Unknown | ins, instance, ip, le, job, cls | N/A |
| grafana_frontend_boot_css_time_seconds_count | Unknown | ins, instance, ip, job, cls | N/A |
| grafana_frontend_boot_css_time_seconds_sum | Unknown | ins, instance, ip, job, cls | N/A |
| grafana_frontend_boot_first_contentful_paint_time_seconds_bucket | Unknown | ins, instance, ip, le, job, cls | N/A |
| grafana_frontend_boot_first_contentful_paint_time_seconds_count | Unknown | ins, instance, ip, job, cls | N/A |
| grafana_frontend_boot_first_contentful_paint_time_seconds_sum | Unknown | ins, instance, ip, job, cls | N/A |
| grafana_frontend_boot_first_paint_time_seconds_bucket | Unknown | ins, instance, ip, le, job, cls | N/A |
| grafana_frontend_boot_first_paint_time_seconds_count | Unknown | ins, instance, ip, job, cls | N/A |
| grafana_frontend_boot_first_paint_time_seconds_sum | Unknown | ins, instance, ip, job, cls | N/A |
| grafana_frontend_boot_js_done_time_seconds_bucket | Unknown | ins, instance, ip, le, job, cls | N/A |
| grafana_frontend_boot_js_done_time_seconds_count | Unknown | ins, instance, ip, job, cls | N/A |
| grafana_frontend_boot_js_done_time_seconds_sum | Unknown | ins, instance, ip, job, cls | N/A |
| grafana_frontend_boot_load_time_seconds_bucket | Unknown | ins, instance, ip, le, job, cls | N/A |
| grafana_frontend_boot_load_time_seconds_count | Unknown | ins, instance, ip, job, cls | N/A |
| grafana_frontend_boot_load_time_seconds_sum | Unknown | ins, instance, ip, job, cls | N/A |
| grafana_frontend_plugins_preload_ms_bucket | Unknown | ins, instance, ip, le, job, cls | N/A |
| grafana_frontend_plugins_preload_ms_count | Unknown | ins, instance, ip, job, cls | N/A |
| grafana_frontend_plugins_preload_ms_sum | Unknown | ins, instance, ip, job, cls | N/A |
| grafana_hidden_metrics_total | Unknown | ins, instance, ip, job, cls | N/A |
| grafana_http_request_duration_seconds_bucket | Unknown | ins, instance, method, ip, le, job, cls, status_code, handler | N/A |
| grafana_http_request_duration_seconds_count | Unknown | ins, instance, method, ip, job, cls, status_code, handler | N/A |
| grafana_http_request_duration_seconds_sum | Unknown | ins, instance, method, ip, job, cls, status_code, handler | N/A |
| grafana_http_request_in_flight | gauge | ins, instance, ip, job, cls | A gauge of requests currently being served by Grafana. |
| grafana_idforwarding_idforwarding_failed_token_signing_total | Unknown | ins, instance, ip, job, cls | N/A |
| grafana_idforwarding_idforwarding_token_signing_duration_seconds_bucket | Unknown | ins, instance, ip, le, job, cls | N/A |
| grafana_idforwarding_idforwarding_token_signing_duration_seconds_count | Unknown | ins, instance, ip, job, cls | N/A |
| grafana_idforwarding_idforwarding_token_signing_duration_seconds_sum | Unknown | ins, instance, ip, job, cls | N/A |
| grafana_idforwarding_idforwarding_token_signing_from_cache_total | Unknown | ins, instance, ip, job, cls | N/A |
| grafana_idforwarding_idforwarding_token_signing_total | Unknown | ins, instance, ip, job, cls | N/A |
| grafana_instance_start_total | Unknown | ins, instance, ip, job, cls | N/A |
| grafana_ldap_users_sync_execution_time | summary | ins, instance, ip, job, cls, quantile | summary for LDAP users sync execution duration |
| grafana_ldap_users_sync_execution_time_count | Unknown | ins, instance, ip, job, cls | N/A |
| grafana_ldap_users_sync_execution_time_sum | Unknown | ins, instance, ip, job, cls | N/A |
| grafana_live_client_command_duration_seconds | summary | ins, instance, method, ip, job, cls, quantile | Client command duration summary. |
| grafana_live_client_command_duration_seconds_count | Unknown | ins, instance, method, ip, job, cls | N/A |
| grafana_live_client_command_duration_seconds_sum | Unknown | ins, instance, method, ip, job, cls | N/A |
| grafana_live_client_num_reply_errors | unknown | ins, instance, method, ip, job, cls, code | Number of errors in replies sent to clients. |
| grafana_live_client_num_server_disconnects | unknown | ins, instance, ip, job, cls, code | Number of server initiated disconnects. |
| grafana_live_client_recover | unknown | ins, instance, ip, recovered, job, cls | Count of recover operations. |
| grafana_live_node_action_count | unknown | action, ins, instance, ip, job, cls | Number of node actions called. |
| grafana_live_node_build | gauge | version, ins, instance, ip, job, cls | Node build info. |
| grafana_live_node_messages_received_count | unknown | ins, instance, ip, type, job, cls | Number of messages received. |
| grafana_live_node_messages_sent_count | unknown | ins, instance, ip, type, job, cls | Number of messages sent. |
| grafana_live_node_num_channels | gauge | ins, instance, ip, job, cls | Number of channels with one or more subscribers. |
| grafana_live_node_num_clients | gauge | ins, instance, ip, job, cls | Number of clients connected. |
| grafana_live_node_num_nodes | gauge | ins, instance, ip, job, cls | Number of nodes in cluster. |
| grafana_live_node_num_subscriptions | gauge | ins, instance, ip, job, cls | Number of subscriptions. |
| grafana_live_node_num_users | gauge | ins, instance, ip, job, cls | Number of unique users connected. |
| grafana_live_transport_connect_count | unknown | ins, instance, ip, transport, job, cls | Number of connections to specific transport. |
| grafana_live_transport_messages_sent | unknown | ins, instance, ip, transport, job, cls | Number of messages sent over specific transport. |
| grafana_loki_plugin_parse_response_duration_seconds_bucket | Unknown | endpoint, ins, instance, ip, le, status, job, cls | N/A |
| grafana_loki_plugin_parse_response_duration_seconds_count | Unknown | endpoint, ins, instance, ip, status, job, cls | N/A |
| grafana_loki_plugin_parse_response_duration_seconds_sum | Unknown | endpoint, ins, instance, ip, status, job, cls | N/A |
| grafana_page_response_status_total | Unknown | ins, instance, ip, job, cls, code | N/A |
| grafana_plugin_build_info | gauge | version, signature_status, ins, instance, plugin_type, ip, plugin_id, job, cls | A metric with a constant ‘1’ value labeled by pluginId, pluginType and version from which Grafana plugin was built |
| grafana_plugin_request_duration_milliseconds_bucket | Unknown | endpoint, ins, instance, target, ip, le, plugin_id, job, cls | N/A |
| grafana_plugin_request_duration_milliseconds_count | Unknown | endpoint, ins, instance, target, ip, plugin_id, job, cls | N/A |
| grafana_plugin_request_duration_milliseconds_sum | Unknown | endpoint, ins, instance, target, ip, plugin_id, job, cls | N/A |
| grafana_plugin_request_duration_seconds_bucket | Unknown | endpoint, ins, instance, target, ip, le, status, plugin_id, source, job, cls | N/A |
| grafana_plugin_request_duration_seconds_count | Unknown | endpoint, ins, instance, target, ip, status, plugin_id, source, job, cls | N/A |
| grafana_plugin_request_duration_seconds_sum | Unknown | endpoint, ins, instance, target, ip, status, plugin_id, source, job, cls | N/A |
| grafana_plugin_request_size_bytes_bucket | Unknown | endpoint, ins, instance, target, ip, le, plugin_id, source, job, cls | N/A |
| grafana_plugin_request_size_bytes_count | Unknown | endpoint, ins, instance, target, ip, plugin_id, source, job, cls | N/A |
| grafana_plugin_request_size_bytes_sum | Unknown | endpoint, ins, instance, target, ip, plugin_id, source, job, cls | N/A |
| grafana_plugin_request_total | Unknown | endpoint, ins, instance, target, ip, status, plugin_id, job, cls | N/A |
| grafana_process_cpu_seconds_total | Unknown | ins, instance, ip, job, cls | N/A |
| grafana_process_max_fds | gauge | ins, instance, ip, job, cls | Maximum number of open file descriptors. |
| grafana_process_open_fds | gauge | ins, instance, ip, job, cls | Number of open file descriptors. |
| grafana_process_resident_memory_bytes | gauge | ins, instance, ip, job, cls | Resident memory size in bytes. |
| grafana_process_start_time_seconds | gauge | ins, instance, ip, job, cls | Start time of the process since unix epoch in seconds. |
| grafana_process_virtual_memory_bytes | gauge | ins, instance, ip, job, cls | Virtual memory size in bytes. |
| grafana_process_virtual_memory_max_bytes | gauge | ins, instance, ip, job, cls | Maximum amount of virtual memory available in bytes. |
| grafana_prometheus_plugin_backend_request_count | unknown | endpoint, ins, instance, ip, status, errorSource, job, cls | The total amount of prometheus backend plugin requests |
| grafana_proxy_response_status_total | Unknown | ins, instance, ip, job, cls, code | N/A |
| grafana_public_dashboard_request_count | unknown | ins, instance, ip, job, cls | counter for public dashboards requests |
| grafana_registered_metrics_total | Unknown | ins, instance, ip, stability_level, deprecated_version, job, cls | N/A |
| grafana_rendering_queue_size | gauge | ins, instance, ip, job, cls | size of rendering queue |
| grafana_search_dashboard_search_failures_duration_seconds_bucket | Unknown | ins, instance, ip, le, job, cls | N/A |
| grafana_search_dashboard_search_failures_duration_seconds_count | Unknown | ins, instance, ip, job, cls | N/A |
| grafana_search_dashboard_search_failures_duration_seconds_sum | Unknown | ins, instance, ip, job, cls | N/A |
| grafana_search_dashboard_search_successes_duration_seconds_bucket | Unknown | ins, instance, ip, le, job, cls | N/A |
| grafana_search_dashboard_search_successes_duration_seconds_count | Unknown | ins, instance, ip, job, cls | N/A |
| grafana_search_dashboard_search_successes_duration_seconds_sum | Unknown | ins, instance, ip, job, cls | N/A |
| grafana_stat_active_users | gauge | ins, instance, ip, job, cls | number of active users |
| grafana_stat_total_orgs | gauge | ins, instance, ip, job, cls | total amount of orgs |
| grafana_stat_total_playlists | gauge | ins, instance, ip, job, cls | total amount of playlists |
| grafana_stat_total_service_account_tokens | gauge | ins, instance, ip, job, cls | total amount of service account tokens |
| grafana_stat_total_service_accounts | gauge | ins, instance, ip, job, cls | total amount of service accounts |
| grafana_stat_total_service_accounts_role_none | gauge | ins, instance, ip, job, cls | total amount of service accounts with no role |
| grafana_stat_total_teams | gauge | ins, instance, ip, job, cls | total amount of teams |
| grafana_stat_total_users | gauge | ins, instance, ip, job, cls | total amount of users |
| grafana_stat_totals_active_admins | gauge | ins, instance, ip, job, cls | total amount of active admins |
| grafana_stat_totals_active_editors | gauge | ins, instance, ip, job, cls | total amount of active editors |
| grafana_stat_totals_active_viewers | gauge | ins, instance, ip, job, cls | total amount of active viewers |
| grafana_stat_totals_admins | gauge | ins, instance, ip, job, cls | total amount of admins |
| grafana_stat_totals_alert_rules | gauge | ins, instance, ip, job, cls | total amount of alert rules in the database |
| grafana_stat_totals_annotations | gauge | ins, instance, ip, job, cls | total amount of annotations in the database |
| grafana_stat_totals_correlations | gauge | ins, instance, ip, job, cls | total amount of correlations |
| grafana_stat_totals_dashboard | gauge | ins, instance, ip, job, cls | total amount of dashboards |
| grafana_stat_totals_dashboard_versions | gauge | ins, instance, ip, job, cls | total amount of dashboard versions in the database |
| grafana_stat_totals_data_keys | gauge | ins, instance, ip, job, cls, active | total amount of data keys in the database |
| grafana_stat_totals_datasource | gauge | ins, instance, ip, plugin_id, job, cls | total number of defined datasources, labeled by pluginId |
| grafana_stat_totals_editors | gauge | ins, instance, ip, job, cls | total amount of editors |
| grafana_stat_totals_folder | gauge | ins, instance, ip, job, cls | total amount of folders |
| grafana_stat_totals_library_panels | gauge | ins, instance, ip, job, cls | total amount of library panels in the database |
| grafana_stat_totals_library_variables | gauge | ins, instance, ip, job, cls | total amount of library variables in the database |
| grafana_stat_totals_public_dashboard | gauge | ins, instance, ip, job, cls | total amount of public dashboards |
| grafana_stat_totals_rule_groups | gauge | ins, instance, ip, job, cls | total amount of alert rule groups in the database |
| grafana_stat_totals_viewers | gauge | ins, instance, ip, job, cls | total amount of viewers |
| infra_up | Unknown | ins, instance, ip, job, cls | N/A |
| jaeger_tracer_baggage_restrictions_updates_total | Unknown | result, ins, instance, ip, job, cls | N/A |
| jaeger_tracer_baggage_truncations_total | Unknown | ins, instance, ip, job, cls | N/A |
| jaeger_tracer_baggage_updates_total | Unknown | result, ins, instance, ip, job, cls | N/A |
| jaeger_tracer_finished_spans_total | Unknown | ins, instance, ip, sampled, job, cls | N/A |
| jaeger_tracer_reporter_queue_length | gauge | ins, instance, ip, job, cls | Current number of spans in the reporter queue |
| jaeger_tracer_reporter_spans_total | Unknown | result, ins, instance, ip, job, cls | N/A |
| jaeger_tracer_sampler_queries_total | Unknown | result, ins, instance, ip, job, cls | N/A |
| jaeger_tracer_sampler_updates_total | Unknown | result, ins, instance, ip, job, cls | N/A |
| jaeger_tracer_span_context_decoding_errors_total | Unknown | ins, instance, ip, job, cls | N/A |
| jaeger_tracer_started_spans_total | Unknown | ins, instance, ip, sampled, job, cls | N/A |
| jaeger_tracer_throttled_debug_spans_total | Unknown | ins, instance, ip, job, cls | N/A |
| jaeger_tracer_throttler_updates_total | Unknown | result, ins, instance, ip, job, cls | N/A |
| jaeger_tracer_traces_total | Unknown | ins, instance, ip, sampled, job, cls, state | N/A |
| kv_request_duration_seconds_bucket | Unknown | ins, instance, role, ip, le, kv_name, type, operation, job, cls, status_code | N/A |
| kv_request_duration_seconds_count | Unknown | ins, instance, role, ip, kv_name, type, operation, job, cls, status_code | N/A |
| kv_request_duration_seconds_sum | Unknown | ins, instance, role, ip, kv_name, type, operation, job, cls, status_code | N/A |
| legacy_grafana_alerting_ticker_interval_seconds | gauge | ins, instance, ip, job, cls | Interval at which the ticker is meant to tick. |
| legacy_grafana_alerting_ticker_last_consumed_tick_timestamp_seconds | gauge | ins, instance, ip, job, cls | Timestamp of the last consumed tick in seconds. |
| legacy_grafana_alerting_ticker_next_tick_timestamp_seconds | gauge | ins, instance, ip, job, cls | Timestamp of the next tick in seconds before it is consumed. |
| logql_query_duration_seconds_bucket | Unknown | ins, instance, query_type, ip, le, job, cls | N/A |
| logql_query_duration_seconds_count | Unknown | ins, instance, query_type, ip, job, cls | N/A |
| logql_query_duration_seconds_sum | Unknown | ins, instance, query_type, ip, job, cls | N/A |
| loki_azure_blob_egress_bytes_total | Unknown | ins, instance, ip, job, cls | N/A |
| loki_boltdb_shipper_apply_retention_last_successful_run_timestamp_seconds | gauge | ins, instance, ip, job, cls | Unix timestamp of the last successful retention run |
| loki_boltdb_shipper_compact_tables_operation_duration_seconds | gauge | ins, instance, ip, job, cls | Time (in seconds) spent in compacting all the tables |
| loki_boltdb_shipper_compact_tables_operation_last_successful_run_timestamp_seconds | gauge | ins, instance, ip, job, cls | Unix timestamp of the last successful compaction run |
| loki_boltdb_shipper_compact_tables_operation_total | Unknown | ins, instance, ip, status, job, cls | N/A |
| loki_boltdb_shipper_compactor_running | gauge | ins, instance, ip, job, cls | Value will be 1 if compactor is currently running on this instance |
| loki_boltdb_shipper_open_existing_file_failures_total | Unknown | ins, instance, ip, component, job, cls | N/A |
| loki_boltdb_shipper_query_time_table_download_duration_seconds | unknown | ins, instance, ip, component, job, cls, table | Time (in seconds) spent in downloading of files per table at query time |
| loki_boltdb_shipper_request_duration_seconds_bucket | Unknown | ins, instance, ip, le, component, operation, job, cls, status_code | N/A |
| loki_boltdb_shipper_request_duration_seconds_count | Unknown | ins, instance, ip, component, operation, job, cls, status_code | N/A |
| loki_boltdb_shipper_request_duration_seconds_sum | Unknown | ins, instance, ip, component, operation, job, cls, status_code | N/A |
| loki_boltdb_shipper_tables_download_operation_duration_seconds | gauge | ins, instance, ip, component, job, cls | Time (in seconds) spent in downloading updated files for all the tables |
| loki_boltdb_shipper_tables_sync_operation_total | Unknown | ins, instance, ip, status, component, job, cls | N/A |
| loki_boltdb_shipper_tables_upload_operation_total | Unknown | ins, instance, ip, status, component, job, cls | N/A |
| loki_build_info | gauge | revision, version, ins, instance, ip, tags, goarch, goversion, job, cls, branch, goos | A metric with a constant ‘1’ value labeled by version, revision, branch, goversion from which loki was built, and the goos and goarch for the build. |
| loki_bytes_per_line_bucket | Unknown | ins, instance, ip, le, job, cls | N/A |
| loki_bytes_per_line_count | Unknown | ins, instance, ip, job, cls | N/A |
| loki_bytes_per_line_sum | Unknown | ins, instance, ip, job, cls | N/A |
| loki_cache_corrupt_chunks_total | Unknown | ins, instance, ip, job, cls | N/A |
| loki_cache_fetched_keys | unknown | ins, instance, ip, job, cls | Total count of keys requested from cache. |
| loki_cache_hits | unknown | ins, instance, ip, job, cls | Total count of keys found in cache. |
| loki_cache_request_duration_seconds_bucket | Unknown | ins, instance, method, ip, le, job, cls, status_code | N/A |
| loki_cache_request_duration_seconds_count | Unknown | ins, instance, method, ip, job, cls, status_code | N/A |
| loki_cache_request_duration_seconds_sum | Unknown | ins, instance, method, ip, job, cls, status_code | N/A |
| loki_cache_value_size_bytes_bucket | Unknown | ins, instance, method, ip, le, job, cls | N/A |
| loki_cache_value_size_bytes_count | Unknown | ins, instance, method, ip, job, cls | N/A |
| loki_cache_value_size_bytes_sum | Unknown | ins, instance, method, ip, job, cls | N/A |
| loki_chunk_fetcher_cache_dequeued_total | Unknown | ins, instance, ip, job, cls | N/A |
| loki_chunk_fetcher_cache_enqueued_total | Unknown | ins, instance, ip, job, cls | N/A |
| loki_chunk_fetcher_cache_skipped_buffer_full_total | Unknown | ins, instance, ip, job, cls | N/A |
| loki_chunk_fetcher_fetched_size_bytes_bucket | Unknown | ins, instance, ip, le, source, job, cls | N/A |
| loki_chunk_fetcher_fetched_size_bytes_count | Unknown | ins, instance, ip, source, job, cls | N/A |
| loki_chunk_fetcher_fetched_size_bytes_sum | Unknown | ins, instance, ip, source, job, cls | N/A |
| loki_chunk_store_chunks_per_query_bucket | Unknown | ins, instance, ip, le, job, cls | N/A |
| loki_chunk_store_chunks_per_query_count | Unknown | ins, instance, ip, job, cls | N/A |
| loki_chunk_store_chunks_per_query_sum | Unknown | ins, instance, ip, job, cls | N/A |
| loki_chunk_store_deduped_bytes_total | Unknown | ins, instance, ip, job, cls | N/A |
| loki_chunk_store_deduped_chunks_total | Unknown | ins, instance, ip, job, cls | N/A |
| loki_chunk_store_fetched_chunk_bytes_total | Unknown | ins, instance, ip, user, job, cls | N/A |
| loki_chunk_store_fetched_chunks_total | Unknown | ins, instance, ip, user, job, cls | N/A |
| loki_chunk_store_index_entries_per_chunk_bucket | Unknown | ins, instance, ip, le, job, cls | N/A |
| loki_chunk_store_index_entries_per_chunk_count | Unknown | ins, instance, ip, job, cls | N/A |
| loki_chunk_store_index_entries_per_chunk_sum | Unknown | ins, instance, ip, job, cls | N/A |
| loki_chunk_store_index_lookups_per_query_bucket | Unknown | ins, instance, ip, le, job, cls | N/A |
| loki_chunk_store_index_lookups_per_query_count | Unknown | ins, instance, ip, job, cls | N/A |
| loki_chunk_store_index_lookups_per_query_sum | Unknown | ins, instance, ip, job, cls | N/A |
| loki_chunk_store_series_post_intersection_per_query_bucket | Unknown | ins, instance, ip, le, job, cls | N/A |
| loki_chunk_store_series_post_intersection_per_query_count | Unknown | ins, instance, ip, job, cls | N/A |
| loki_chunk_store_series_post_intersection_per_query_sum | Unknown | ins, instance, ip, job, cls | N/A |
| loki_chunk_store_series_pre_intersection_per_query_bucket | Unknown | ins, instance, ip, le, job, cls | N/A |
| loki_chunk_store_series_pre_intersection_per_query_count | Unknown | ins, instance, ip, job, cls | N/A |
| loki_chunk_store_series_pre_intersection_per_query_sum | Unknown | ins, instance, ip, job, cls | N/A |
| loki_chunk_store_stored_chunk_bytes_total | Unknown | ins, instance, ip, user, job, cls | N/A |
| loki_chunk_store_stored_chunks_total | Unknown | ins, instance, ip, user, job, cls | N/A |
| loki_consul_request_duration_seconds_bucket | Unknown | ins, instance, ip, le, kv_name, operation, job, cls, status_code | N/A |
| loki_consul_request_duration_seconds_count | Unknown | ins, instance, ip, kv_name, operation, job, cls, status_code | N/A |
| loki_consul_request_duration_seconds_sum | Unknown | ins, instance, ip, kv_name, operation, job, cls, status_code | N/A |
| loki_delete_request_lookups_failed_total | Unknown | ins, instance, ip, job, cls | N/A |
| loki_delete_request_lookups_total | Unknown | ins, instance, ip, job, cls | N/A |
| loki_discarded_bytes_total | Unknown | ins, instance, ip, reason, job, cls, tenant | N/A |
| loki_discarded_samples_total | Unknown | ins, instance, ip, reason, job, cls, tenant | N/A |
| loki_distributor_bytes_received_total | Unknown | ins, instance, retention_hours, ip, job, cls, tenant | N/A |
| loki_distributor_ingester_appends_total | Unknown | ins, instance, ip, ingester, job, cls | N/A |
| loki_distributor_lines_received_total | Unknown | ins, instance, ip, job, cls, tenant | N/A |
| loki_distributor_replication_factor | gauge | ins, instance, ip, job, cls | The configured replication factor. |
| loki_distributor_structured_metadata_bytes_received_total | Unknown | ins, instance, retention_hours, ip, job, cls, tenant | N/A |
| loki_experimental_features_in_use_total | Unknown | ins, instance, ip, job, cls | N/A |
| loki_index_chunk_refs_total | Unknown | ins, instance, ip, status, job, cls | N/A |
| loki_index_request_duration_seconds_bucket | Unknown | ins, instance, ip, le, component, operation, job, cls, status_code | N/A |
| loki_index_request_duration_seconds_count | Unknown | ins, instance, ip, component, operation, job, cls, status_code | N/A |
| loki_index_request_duration_seconds_sum | Unknown | ins, instance, ip, component, operation, job, cls, status_code | N/A |
| loki_inflight_requests | gauge | ins, instance, method, ip, route, job, cls | Current number of inflight requests. |
| loki_ingester_autoforget_unhealthy_ingesters_total | Unknown | ins, instance, ip, job, cls | N/A |
| loki_ingester_blocks_per_chunk_bucket | Unknown | ins, instance, ip, le, job, cls | N/A |
| loki_ingester_blocks_per_chunk_count | Unknown | ins, instance, ip, job, cls | N/A |
| loki_ingester_blocks_per_chunk_sum | Unknown | ins, instance, ip, job, cls | N/A |
| loki_ingester_checkpoint_creations_failed_total | Unknown | ins, instance, ip, job, cls | N/A |
| loki_ingester_checkpoint_creations_total | Unknown | ins, instance, ip, job, cls | N/A |
| loki_ingester_checkpoint_deletions_failed_total | Unknown | ins, instance, ip, job, cls | N/A |
| loki_ingester_checkpoint_deletions_total | Unknown | ins, instance, ip, job, cls | N/A |
| loki_ingester_checkpoint_duration_seconds | summary | ins, instance, ip, job, cls, quantile | Time taken to create a checkpoint. |
| loki_ingester_checkpoint_duration_seconds_count | Unknown | ins, instance, ip, job, cls | N/A |
| loki_ingester_checkpoint_duration_seconds_sum | Unknown | ins, instance, ip, job, cls | N/A |
| loki_ingester_checkpoint_logged_bytes_total | Unknown | ins, instance, ip, job, cls | N/A |
| loki_ingester_chunk_age_seconds_bucket | Unknown | ins, instance, ip, le, job, cls | N/A |
| loki_ingester_chunk_age_seconds_count | Unknown | ins, instance, ip, job, cls | N/A |
| loki_ingester_chunk_age_seconds_sum | Unknown | ins, instance, ip, job, cls | N/A |
| loki_ingester_chunk_bounds_hours_bucket | Unknown | ins, instance, ip, le, job, cls | N/A |
| loki_ingester_chunk_bounds_hours_count | Unknown | ins, instance, ip, job, cls | N/A |
| loki_ingester_chunk_bounds_hours_sum | Unknown | ins, instance, ip, job, cls | N/A |
| loki_ingester_chunk_compression_ratio_bucket | Unknown | ins, instance, ip, le, job, cls | N/A |
| loki_ingester_chunk_compression_ratio_count | Unknown | ins, instance, ip, job, cls | N/A |
| loki_ingester_chunk_compression_ratio_sum | Unknown | ins, instance, ip, job, cls | N/A |
| loki_ingester_chunk_encode_time_seconds_bucket | Unknown | ins, instance, ip, le, job, cls | N/A |
| loki_ingester_chunk_encode_time_seconds_count | Unknown | ins, instance, ip, job, cls | N/A |
| loki_ingester_chunk_encode_time_seconds_sum | Unknown | ins, instance, ip, job, cls | N/A |
| loki_ingester_chunk_entries_bucket | Unknown | ins, instance, ip, le, job, cls | N/A |
| loki_ingester_chunk_entries_count | Unknown | ins, instance, ip, job, cls | N/A |
| loki_ingester_chunk_entries_sum | Unknown | ins, instance, ip, job, cls | N/A |
| loki_ingester_chunk_size_bytes_bucket | Unknown | ins, instance, ip, le, job, cls | N/A |
| loki_ingester_chunk_size_bytes_count | Unknown | ins, instance, ip, job, cls | N/A |
| loki_ingester_chunk_size_bytes_sum | Unknown | ins, instance, ip, job, cls | N/A |
| loki_ingester_chunk_stored_bytes_total | Unknown | ins, instance, ip, job, cls, tenant | N/A |
| loki_ingester_chunk_utilization_bucket | Unknown | ins, instance, ip, le, job, cls | N/A |
| loki_ingester_chunk_utilization_count | Unknown | ins, instance, ip, job, cls | N/A |
| loki_ingester_chunk_utilization_sum | Unknown | ins, instance, ip, job, cls | N/A |
| loki_ingester_chunks_created_total | Unknown | ins, instance, ip, job, cls | N/A |
| loki_ingester_chunks_flushed_total | Unknown | ins, instance, ip, reason, job, cls | N/A |
| loki_ingester_chunks_stored_total | Unknown | ins, instance, ip, job, cls, tenant | N/A |
| loki_ingester_client_request_duration_seconds_bucket | Unknown | ins, instance, ip, le, operation, job, cls, status_code | N/A |
| loki_ingester_client_request_duration_seconds_count | Unknown | ins, instance, ip, operation, job, cls, status_code | N/A |
| loki_ingester_client_request_duration_seconds_sum | Unknown | ins, instance, ip, operation, job, cls, status_code | N/A |
| loki_ingester_limiter_enabled | gauge | ins, instance, ip, job, cls | Whether the ingester’s limiter is enabled |
| loki_ingester_memory_chunks | gauge | ins, instance, ip, job, cls | The total number of chunks in memory. |
| loki_ingester_memory_streams | gauge | ins, instance, ip, job, cls, tenant | The total number of streams in memory per tenant. |
| loki_ingester_memory_streams_labels_bytes | gauge | ins, instance, ip, job, cls | Total bytes of labels of the streams in memory. |
| loki_ingester_received_chunks | unknown | ins, instance, ip, job, cls | The total number of chunks received by this ingester whilst joining. |
| loki_ingester_samples_per_chunk_bucket | Unknown | ins, instance, ip, le, job, cls | N/A |
| loki_ingester_samples_per_chunk_count | Unknown | ins, instance, ip, job, cls | N/A |
| loki_ingester_samples_per_chunk_sum | Unknown | ins, instance, ip, job, cls | N/A |
| loki_ingester_sent_chunks | unknown | ins, instance, ip, job, cls | The total number of chunks sent by this ingester whilst leaving. |
| loki_ingester_shutdown_marker | gauge | ins, instance, ip, job, cls | 1 if prepare shutdown has been called, 0 otherwise |
| loki_ingester_streams_created_total | Unknown | ins, instance, ip, job, cls, tenant | N/A |
| loki_ingester_streams_removed_total | Unknown | ins, instance, ip, job, cls, tenant | N/A |
| loki_ingester_wal_bytes_in_use | gauge | ins, instance, ip, job, cls | Total number of bytes in use by the WAL recovery process. |
| loki_ingester_wal_disk_full_failures_total | Unknown | ins, instance, ip, job, cls | N/A |
| loki_ingester_wal_duplicate_entries_total | Unknown | ins, instance, ip, job, cls | N/A |
| loki_ingester_wal_logged_bytes_total | Unknown | ins, instance, ip, job, cls | N/A |
| loki_ingester_wal_records_logged_total | Unknown | ins, instance, ip, job, cls | N/A |
| loki_ingester_wal_recovered_bytes_total | Unknown | ins, instance, ip, job, cls | N/A |
| loki_ingester_wal_recovered_chunks_total | Unknown | ins, instance, ip, job, cls | N/A |
| loki_ingester_wal_recovered_entries_total | Unknown | ins, instance, ip, job, cls | N/A |
| loki_ingester_wal_recovered_streams_total | Unknown | ins, instance, ip, job, cls | N/A |
| loki_ingester_wal_replay_active | gauge | ins, instance, ip, job, cls | Whether the WAL is replaying |
| loki_ingester_wal_replay_duration_seconds | gauge | ins, instance, ip, job, cls | Time taken to replay the checkpoint and the WAL. |
| loki_ingester_wal_replay_flushing | gauge | ins, instance, ip, job, cls | Whether the wal replay is in a flushing phase due to backpressure |
| loki_internal_log_messages_total | Unknown | ins, instance, ip, level, job, cls | N/A |
| loki_kv_request_duration_seconds_bucket | Unknown | ins, instance, role, ip, le, kv_name, type, operation, job, cls, status_code | N/A |
| loki_kv_request_duration_seconds_count | Unknown | ins, instance, role, ip, kv_name, type, operation, job, cls, status_code | N/A |
| loki_kv_request_duration_seconds_sum | Unknown | ins, instance, role, ip, kv_name, type, operation, job, cls, status_code | N/A |
| loki_log_flushes_bucket | Unknown | ins, instance, ip, le, job, cls | N/A |
| loki_log_flushes_count | Unknown | ins, instance, ip, job, cls | N/A |
| loki_log_flushes_sum | Unknown | ins, instance, ip, job, cls | N/A |
| loki_log_messages_total | Unknown | ins, instance, ip, level, job, cls | N/A |
| loki_logql_querystats_bytes_processed_per_seconds_bucket | Unknown | ins, instance, range, ip, le, sharded, type, job, cls, status_code, latency_type | N/A |
| loki_logql_querystats_bytes_processed_per_seconds_count | Unknown | ins, instance, range, ip, sharded, type, job, cls, status_code, latency_type | N/A |
| loki_logql_querystats_bytes_processed_per_seconds_sum | Unknown | ins, instance, range, ip, sharded, type, job, cls, status_code, latency_type | N/A |
| loki_logql_querystats_chunk_download_latency_seconds_bucket | Unknown | ins, instance, range, ip, le, type, job, cls, status_code | N/A |
| loki_logql_querystats_chunk_download_latency_seconds_count | Unknown | ins, instance, range, ip, type, job, cls, status_code | N/A |
| loki_logql_querystats_chunk_download_latency_seconds_sum | Unknown | ins, instance, range, ip, type, job, cls, status_code | N/A |
| loki_logql_querystats_downloaded_chunk_total | Unknown | ins, instance, range, ip, type, job, cls, status_code | N/A |
| loki_logql_querystats_duplicates_total | Unknown | ins, instance, ip, job, cls | N/A |
| loki_logql_querystats_ingester_sent_lines_total | Unknown | ins, instance, ip, job, cls | N/A |
| loki_logql_querystats_latency_seconds_bucket | Unknown | ins, instance, range, ip, le, type, job, cls, status_code | N/A |
| loki_logql_querystats_latency_seconds_count | Unknown | ins, instance, range, ip, type, job, cls, status_code | N/A |
| loki_logql_querystats_latency_seconds_sum | Unknown | ins, instance, range, ip, type, job, cls, status_code | N/A |
| loki_panic_total | Unknown | ins, instance, ip, job, cls | N/A |
| loki_querier_index_cache_corruptions_total | Unknown | ins, instance, ip, job, cls | N/A |
| loki_querier_index_cache_encode_errors_total | Unknown | ins, instance, ip, job, cls | N/A |
| loki_querier_index_cache_gets_total | Unknown | ins, instance, ip, job, cls | N/A |
| loki_querier_index_cache_hits_total | Unknown | ins, instance, ip, job, cls | N/A |
| loki_querier_index_cache_puts_total | Unknown | ins, instance, ip, job, cls | N/A |
| loki_querier_query_frontend_clients | gauge | ins, instance, ip, job, cls | The current number of clients connected to query-frontend. |
| loki_querier_query_frontend_request_duration_seconds_bucket | Unknown | ins, instance, ip, le, operation, job, cls, status_code | N/A |
| loki_querier_query_frontend_request_duration_seconds_count | Unknown | ins, instance, ip, operation, job, cls, status_code | N/A |
| loki_querier_query_frontend_request_duration_seconds_sum | Unknown | ins, instance, ip, operation, job, cls, status_code | N/A |
| loki_querier_tail_active | gauge | ins, instance, ip, job, cls | Number of active tailers |
| loki_querier_tail_active_streams | gauge | ins, instance, ip, job, cls | Number of active streams being tailed |
| loki_querier_tail_bytes_total | Unknown | ins, instance, ip, job, cls | N/A |
| loki_querier_worker_concurrency | gauge | ins, instance, ip, job, cls | Number of concurrent querier workers |
| loki_querier_worker_inflight_queries | gauge | ins, instance, ip, job, cls | Number of queries being processed by the querier workers |
| loki_query_frontend_log_result_cache_hit_total | Unknown | ins, instance, ip, job, cls | N/A |
| loki_query_frontend_log_result_cache_miss_total | Unknown | ins, instance, ip, job, cls | N/A |
| loki_query_frontend_partitions_bucket | Unknown | ins, instance, ip, le, job, cls | N/A |
| loki_query_frontend_partitions_count | Unknown | ins, instance, ip, job, cls | N/A |
| loki_query_frontend_partitions_sum | Unknown | ins, instance, ip, job, cls | N/A |
| loki_query_frontend_shard_factor_bucket | Unknown | ins, instance, ip, le, mapper, job, cls | N/A |
| loki_query_frontend_shard_factor_count | Unknown | ins, instance, ip, mapper, job, cls | N/A |
| loki_query_frontend_shard_factor_sum | Unknown | ins, instance, ip, mapper, job, cls | N/A |
| loki_query_scheduler_enqueue_count | Unknown | ins, instance, ip, level, user, job, cls | N/A |
| loki_rate_store_expired_streams_total | Unknown | ins, instance, ip, job, cls | N/A |
| loki_rate_store_max_stream_rate_bytes | gauge | ins, instance, ip, job, cls | The maximum stream rate for any stream reported by ingesters during a sync operation. Sharded Streams are combined. |
| loki_rate_store_max_stream_shards | gauge | ins, instance, ip, job, cls | The number of shards for a single stream reported by ingesters during a sync operation. |
| loki_rate_store_max_unique_stream_rate_bytes | gauge | ins, instance, ip, job, cls | The maximum stream rate for any stream reported by ingesters during a sync operation. Sharded Streams are considered separate. |
| loki_rate_store_stream_rate_bytes_bucket | Unknown | ins, instance, ip, le, job, cls | N/A |
| loki_rate_store_stream_rate_bytes_count | Unknown | ins, instance, ip, job, cls | N/A |
| loki_rate_store_stream_rate_bytes_sum | Unknown | ins, instance, ip, job, cls | N/A |
| loki_rate_store_stream_shards_bucket | Unknown | ins, instance, ip, le, job, cls | N/A |
| loki_rate_store_stream_shards_count | Unknown | ins, instance, ip, job, cls | N/A |
| loki_rate_store_stream_shards_sum | Unknown | ins, instance, ip, job, cls | N/A |
| loki_rate_store_streams | gauge | ins, instance, ip, job, cls | The number of unique streams reported by all ingesters. Sharded streams are combined |
| loki_request_duration_seconds_bucket | Unknown | ins, instance, method, ip, le, ws, route, job, cls, status_code | N/A |
| loki_request_duration_seconds_count | Unknown | ins, instance, method, ip, ws, route, job, cls, status_code | N/A |
| loki_request_duration_seconds_sum | Unknown | ins, instance, method, ip, ws, route, job, cls, status_code | N/A |
| loki_request_message_bytes_bucket | Unknown | ins, instance, method, ip, le, route, job, cls | N/A |
| loki_request_message_bytes_count | Unknown | ins, instance, method, ip, route, job, cls | N/A |
| loki_request_message_bytes_sum | Unknown | ins, instance, method, ip, route, job, cls | N/A |
| loki_response_message_bytes_bucket | Unknown | ins, instance, method, ip, le, route, job, cls | N/A |
| loki_response_message_bytes_count | Unknown | ins, instance, method, ip, route, job, cls | N/A |
| loki_response_message_bytes_sum | Unknown | ins, instance, method, ip, route, job, cls | N/A |
| loki_results_cache_version_comparisons_total | Unknown | ins, instance, ip, job, cls | N/A |
| loki_store_chunks_downloaded_total | Unknown | ins, instance, ip, status, job, cls | N/A |
| loki_store_chunks_per_batch_bucket | Unknown | ins, instance, ip, le, status, job, cls | N/A |
| loki_store_chunks_per_batch_count | Unknown | ins, instance, ip, status, job, cls | N/A |
| loki_store_chunks_per_batch_sum | Unknown | ins, instance, ip, status, job, cls | N/A |
| loki_store_series_total | Unknown | ins, instance, ip, status, job, cls | N/A |
| loki_stream_sharding_count | unknown | ins, instance, ip, job, cls | Total number of times the distributor has sharded streams |
| loki_tcp_connections | gauge | ins, instance, ip, protocol, job, cls | Current number of accepted TCP connections. |
| loki_tcp_connections_limit | gauge | ins, instance, ip, protocol, job, cls | The max number of TCP connections that can be accepted (0 means no limit). |
| net_conntrack_dialer_conn_attempted_total | counter | ins, instance, ip, dialer_name, job, cls | Total number of connections attempted by the given dialer a given name. |
| net_conntrack_dialer_conn_closed_total | counter | ins, instance, ip, dialer_name, job, cls | Total number of connections closed which originated from the dialer of a given name. |
| net_conntrack_dialer_conn_established_total | counter | ins, instance, ip, dialer_name, job, cls | Total number of connections successfully established by the given dialer a given name. |
| net_conntrack_dialer_conn_failed_total | counter | ins, instance, ip, dialer_name, reason, job, cls | Total number of connections failed to dial by the dialer a given name. |
| net_conntrack_listener_conn_accepted_total | counter | ins, instance, ip, listener_name, job, cls | Total number of connections opened to the listener of a given name. |
| net_conntrack_listener_conn_closed_total | counter | ins, instance, ip, listener_name, job, cls | Total number of connections closed that were made to the listener of a given name. |
| nginx_connections_accepted | counter | ins, instance, ip, job, cls | Accepted client connections |
| nginx_connections_active | gauge | ins, instance, ip, job, cls | Active client connections |
| nginx_connections_handled | counter | ins, instance, ip, job, cls | Handled client connections |
| nginx_connections_reading | gauge | ins, instance, ip, job, cls | Connections where NGINX is reading the request header |
| nginx_connections_waiting | gauge | ins, instance, ip, job, cls | Idle client connections |
| nginx_connections_writing | gauge | ins, instance, ip, job, cls | Connections where NGINX is writing the response back to the client |
| nginx_exporter_build_info | gauge | revision, version, ins, instance, ip, tags, goarch, goversion, job, cls, branch, goos | A metric with a constant ‘1’ value labeled by version, revision, branch, goversion from which nginx_exporter was built, and the goos and goarch for the build. |
| nginx_http_requests_total | counter | ins, instance, ip, job, cls | Total http requests |
| nginx_up | gauge | ins, instance, ip, job, cls | Status of the last metric scrape |
| plugins_active_instances | gauge | ins, instance, ip, job, cls | The number of active plugin instances |
| plugins_datasource_instances_total | Unknown | ins, instance, ip, job, cls | N/A |
| process_cpu_seconds_total | counter | ins, instance, ip, job, cls | Total user and system CPU time spent in seconds. |
| process_max_fds | gauge | ins, instance, ip, job, cls | Maximum number of open file descriptors. |
| process_open_fds | gauge | ins, instance, ip, job, cls | Number of open file descriptors. |
| process_resident_memory_bytes | gauge | ins, instance, ip, job, cls | Resident memory size in bytes. |
| process_start_time_seconds | gauge | ins, instance, ip, job, cls | Start time of the process since unix epoch in seconds. |
| process_virtual_memory_bytes | gauge | ins, instance, ip, job, cls | Virtual memory size in bytes. |
| process_virtual_memory_max_bytes | gauge | ins, instance, ip, job, cls | Maximum amount of virtual memory available in bytes. |
| prometheus_api_remote_read_queries | gauge | ins, instance, ip, job, cls | The current number of remote read queries being executed or waiting. |
| prometheus_build_info | gauge | revision, version, ins, instance, ip, tags, goarch, goversion, job, cls, branch, goos | A metric with a constant ‘1’ value labeled by version, revision, branch, goversion from which prometheus was built, and the goos and goarch for the build. |
| prometheus_config_last_reload_success_timestamp_seconds | gauge | ins, instance, ip, job, cls | Timestamp of the last successful configuration reload. |
| prometheus_config_last_reload_successful | gauge | ins, instance, ip, job, cls | Whether the last configuration reload attempt was successful. |
| prometheus_engine_queries | gauge | ins, instance, ip, job, cls | The current number of queries being executed or waiting. |
| prometheus_engine_queries_concurrent_max | gauge | ins, instance, ip, job, cls | The max number of concurrent queries. |
| prometheus_engine_query_duration_seconds | summary | ins, instance, ip, job, cls, quantile, slice | Query timings |
| prometheus_engine_query_duration_seconds_count | Unknown | ins, instance, ip, job, cls, slice | N/A |
| prometheus_engine_query_duration_seconds_sum | Unknown | ins, instance, ip, job, cls, slice | N/A |
| prometheus_engine_query_log_enabled | gauge | ins, instance, ip, job, cls | State of the query log. |
| prometheus_engine_query_log_failures_total | counter | ins, instance, ip, job, cls | The number of query log failures. |
| prometheus_engine_query_samples_total | counter | ins, instance, ip, job, cls | The total number of samples loaded by all queries. |
| prometheus_http_request_duration_seconds_bucket | Unknown | ins, instance, ip, le, job, cls, handler | N/A |
| prometheus_http_request_duration_seconds_count | Unknown | ins, instance, ip, job, cls, handler | N/A |
| prometheus_http_request_duration_seconds_sum | Unknown | ins, instance, ip, job, cls, handler | N/A |
| prometheus_http_requests_total | counter | ins, instance, ip, job, cls, code, handler | Counter of HTTP requests. |
| prometheus_http_response_size_bytes_bucket | Unknown | ins, instance, ip, le, job, cls, handler | N/A |
| prometheus_http_response_size_bytes_count | Unknown | ins, instance, ip, job, cls, handler | N/A |
| prometheus_http_response_size_bytes_sum | Unknown | ins, instance, ip, job, cls, handler | N/A |
| prometheus_notifications_alertmanagers_discovered | gauge | ins, instance, ip, job, cls | The number of alertmanagers discovered and active. |
| prometheus_notifications_dropped_total | counter | ins, instance, ip, job, cls | Total number of alerts dropped due to errors when sending to Alertmanager. |
| prometheus_notifications_errors_total | counter | ins, instance, ip, alertmanager, job, cls | Total number of errors sending alert notifications. |
| prometheus_notifications_latency_seconds | summary | ins, instance, ip, alertmanager, job, cls, quantile | Latency quantiles for sending alert notifications. |
| prometheus_notifications_latency_seconds_count | Unknown | ins, instance, ip, alertmanager, job, cls | N/A |
| prometheus_notifications_latency_seconds_sum | Unknown | ins, instance, ip, alertmanager, job, cls | N/A |
| prometheus_notifications_queue_capacity | gauge | ins, instance, ip, job, cls | The capacity of the alert notifications queue. |
| prometheus_notifications_queue_length | gauge | ins, instance, ip, job, cls | The number of alert notifications in the queue. |
| prometheus_notifications_sent_total | counter | ins, instance, ip, alertmanager, job, cls | Total number of alerts sent. |
| prometheus_ready | gauge | ins, instance, ip, job, cls | Whether Prometheus startup was fully completed and the server is ready for normal operation. |
| prometheus_remote_storage_exemplars_in_total | counter | ins, instance, ip, job, cls | Exemplars in to remote storage, compare to exemplars out for queue managers. |
| prometheus_remote_storage_highest_timestamp_in_seconds | gauge | ins, instance, ip, job, cls | Highest timestamp that has come into the remote storage via the Appender interface, in seconds since epoch. |
| prometheus_remote_storage_histograms_in_total | counter | ins, instance, ip, job, cls | HistogramSamples in to remote storage, compare to histograms out for queue managers. |
| prometheus_remote_storage_samples_in_total | counter | ins, instance, ip, job, cls | Samples in to remote storage, compare to samples out for queue managers. |
| prometheus_remote_storage_string_interner_zero_reference_releases_total | counter | ins, instance, ip, job, cls | The number of times release has been called for strings that are not interned. |
| prometheus_rule_evaluation_duration_seconds | summary | ins, instance, ip, job, cls, quantile | The duration for a rule to execute. |
| prometheus_rule_evaluation_duration_seconds_count | Unknown | ins, instance, ip, job, cls | N/A |
| prometheus_rule_evaluation_duration_seconds_sum | Unknown | ins, instance, ip, job, cls | N/A |
| prometheus_rule_evaluation_failures_total | counter | ins, instance, ip, job, cls, rule_group | The total number of rule evaluation failures. |
| prometheus_rule_evaluations_total | counter | ins, instance, ip, job, cls, rule_group | The total number of rule evaluations. |
| prometheus_rule_group_duration_seconds | summary | ins, instance, ip, job, cls, quantile | The duration of rule group evaluations. |
| prometheus_rule_group_duration_seconds_count | Unknown | ins, instance, ip, job, cls | N/A |
| prometheus_rule_group_duration_seconds_sum | Unknown | ins, instance, ip, job, cls | N/A |
| prometheus_rule_group_interval_seconds | gauge | ins, instance, ip, job, cls, rule_group | The interval of a rule group. |
| prometheus_rule_group_iterations_missed_total | counter | ins, instance, ip, job, cls, rule_group | The total number of rule group evaluations missed due to slow rule group evaluation. |
| prometheus_rule_group_iterations_total | counter | ins, instance, ip, job, cls, rule_group | The total number of scheduled rule group evaluations, whether executed or missed. |
| prometheus_rule_group_last_duration_seconds | gauge | ins, instance, ip, job, cls, rule_group | The duration of the last rule group evaluation. |
| prometheus_rule_group_last_evaluation_samples | gauge | ins, instance, ip, job, cls, rule_group | The number of samples returned during the last rule group evaluation. |
| prometheus_rule_group_last_evaluation_timestamp_seconds | gauge | ins, instance, ip, job, cls, rule_group | The timestamp of the last rule group evaluation in seconds. |
| prometheus_rule_group_rules | gauge | ins, instance, ip, job, cls, rule_group | The number of rules. |
| prometheus_sd_azure_cache_hit_total | counter | ins, instance, ip, job, cls | Number of cache hit during refresh. |
| prometheus_sd_azure_failures_total | counter | ins, instance, ip, job, cls | Number of Azure service discovery refresh failures. |
| prometheus_sd_consul_rpc_duration_seconds | summary | endpoint, ins, instance, ip, job, cls, call, quantile | The duration of a Consul RPC call in seconds. |
| prometheus_sd_consul_rpc_duration_seconds_count | Unknown | endpoint, ins, instance, ip, job, cls, call | N/A |
| prometheus_sd_consul_rpc_duration_seconds_sum | Unknown | endpoint, ins, instance, ip, job, cls, call | N/A |
| prometheus_sd_consul_rpc_failures_total | counter | ins, instance, ip, job, cls | The number of Consul RPC call failures. |
| prometheus_sd_discovered_targets | gauge | ins, instance, ip, config, job, cls | Current number of discovered targets. |
| prometheus_sd_dns_lookup_failures_total | counter | ins, instance, ip, job, cls | The number of DNS-SD lookup failures. |
| prometheus_sd_dns_lookups_total | counter | ins, instance, ip, job, cls | The number of DNS-SD lookups. |
| prometheus_sd_failed_configs | gauge | ins, instance, ip, job, cls | Current number of service discovery configurations that failed to load. |
| prometheus_sd_file_mtime_seconds | gauge | ins, instance, ip, filename, job, cls | Timestamp (mtime) of files read by FileSD. Timestamp is set at read time. |
| prometheus_sd_file_read_errors_total | counter | ins, instance, ip, job, cls | The number of File-SD read errors. |
| prometheus_sd_file_scan_duration_seconds | summary | ins, instance, ip, job, cls, quantile | The duration of the File-SD scan in seconds. |
| prometheus_sd_file_scan_duration_seconds_count | Unknown | ins, instance, ip, job, cls | N/A |
| prometheus_sd_file_scan_duration_seconds_sum | Unknown | ins, instance, ip, job, cls | N/A |
| prometheus_sd_file_watcher_errors_total | counter | ins, instance, ip, job, cls | The number of File-SD errors caused by filesystem watch failures. |
| prometheus_sd_http_failures_total | counter | ins, instance, ip, job, cls | Number of HTTP service discovery refresh failures. |
| prometheus_sd_kubernetes_events_total | counter | event, ins, instance, role, ip, job, cls | The number of Kubernetes events handled. |
| prometheus_sd_kuma_fetch_duration_seconds | summary | ins, instance, ip, job, cls, quantile | The duration of a Kuma MADS fetch call. |
| prometheus_sd_kuma_fetch_duration_seconds_count | Unknown | ins, instance, ip, job, cls | N/A |
| prometheus_sd_kuma_fetch_duration_seconds_sum | Unknown | ins, instance, ip, job, cls | N/A |
| prometheus_sd_kuma_fetch_failures_total | counter | ins, instance, ip, job, cls | The number of Kuma MADS fetch call failures. |
| prometheus_sd_kuma_fetch_skipped_updates_total | counter | ins, instance, ip, job, cls | The number of Kuma MADS fetch calls that result in no updates to the targets. |
| prometheus_sd_linode_failures_total | counter | ins, instance, ip, job, cls | Number of Linode service discovery refresh failures. |
| prometheus_sd_nomad_failures_total | counter | ins, instance, ip, job, cls | Number of nomad service discovery refresh failures. |
| prometheus_sd_received_updates_total | counter | ins, instance, ip, job, cls | Total number of update events received from the SD providers. |
| prometheus_sd_updates_total | counter | ins, instance, ip, job, cls | Total number of update events sent to the SD consumers. |
| prometheus_target_interval_length_seconds | summary | ins, instance, interval, ip, job, cls, quantile | Actual intervals between scrapes. |
| prometheus_target_interval_length_seconds_count | Unknown | ins, instance, interval, ip, job, cls | N/A |
| prometheus_target_interval_length_seconds_sum | Unknown | ins, instance, interval, ip, job, cls | N/A |
| prometheus_target_metadata_cache_bytes | gauge | ins, instance, ip, scrape_job, job, cls | The number of bytes that are currently used for storing metric metadata in the cache |
| prometheus_target_metadata_cache_entries | gauge | ins, instance, ip, scrape_job, job, cls | Total number of metric metadata entries in the cache |
| prometheus_target_scrape_pool_exceeded_label_limits_total | counter | ins, instance, ip, job, cls | Total number of times scrape pools hit the label limits, during sync or config reload. |
| prometheus_target_scrape_pool_exceeded_target_limit_total | counter | ins, instance, ip, job, cls | Total number of times scrape pools hit the target limit, during sync or config reload. |
| prometheus_target_scrape_pool_reloads_failed_total | counter | ins, instance, ip, job, cls | Total number of failed scrape pool reloads. |
| prometheus_target_scrape_pool_reloads_total | counter | ins, instance, ip, job, cls | Total number of scrape pool reloads. |
| prometheus_target_scrape_pool_sync_total | counter | ins, instance, ip, scrape_job, job, cls | Total number of syncs that were executed on a scrape pool. |
| prometheus_target_scrape_pool_target_limit | gauge | ins, instance, ip, scrape_job, job, cls | Maximum number of targets allowed in this scrape pool. |
| prometheus_target_scrape_pool_targets | gauge | ins, instance, ip, scrape_job, job, cls | Current number of targets in this scrape pool. |
| prometheus_target_scrape_pools_failed_total | counter | ins, instance, ip, job, cls | Total number of scrape pool creations that failed. |
| prometheus_target_scrape_pools_total | counter | ins, instance, ip, job, cls | Total number of scrape pool creation attempts. |
| prometheus_target_scrapes_cache_flush_forced_total | counter | ins, instance, ip, job, cls | How many times a scrape cache was flushed due to getting big while scrapes are failing. |
| prometheus_target_scrapes_exceeded_body_size_limit_total | counter | ins, instance, ip, job, cls | Total number of scrapes that hit the body size limit |
| prometheus_target_scrapes_exceeded_native_histogram_bucket_limit_total | counter | ins, instance, ip, job, cls | Total number of scrapes that hit the native histogram bucket limit and were rejected. |
| prometheus_target_scrapes_exceeded_sample_limit_total | counter | ins, instance, ip, job, cls | Total number of scrapes that hit the sample limit and were rejected. |
| prometheus_target_scrapes_exemplar_out_of_order_total | counter | ins, instance, ip, job, cls | Total number of exemplar rejected due to not being out of the expected order. |
| prometheus_target_scrapes_sample_duplicate_timestamp_total | counter | ins, instance, ip, job, cls | Total number of samples rejected due to duplicate timestamps but different values. |
| prometheus_target_scrapes_sample_out_of_bounds_total | counter | ins, instance, ip, job, cls | Total number of samples rejected due to timestamp falling outside of the time bounds. |
| prometheus_target_scrapes_sample_out_of_order_total | counter | ins, instance, ip, job, cls | Total number of samples rejected due to not being out of the expected order. |
| prometheus_target_sync_failed_total | counter | ins, instance, ip, scrape_job, job, cls | Total number of target sync failures. |
| prometheus_target_sync_length_seconds | summary | ins, instance, ip, scrape_job, job, cls, quantile | Actual interval to sync the scrape pool. |
| prometheus_target_sync_length_seconds_count | Unknown | ins, instance, ip, scrape_job, job, cls | N/A |
| prometheus_target_sync_length_seconds_sum | Unknown | ins, instance, ip, scrape_job, job, cls | N/A |
| prometheus_template_text_expansion_failures_total | counter | ins, instance, ip, job, cls | The total number of template text expansion failures. |
| prometheus_template_text_expansions_total | counter | ins, instance, ip, job, cls | The total number of template text expansions. |
| prometheus_treecache_watcher_goroutines | gauge | ins, instance, ip, job, cls | The current number of watcher goroutines. |
| prometheus_treecache_zookeeper_failures_total | counter | ins, instance, ip, job, cls | The total number of ZooKeeper failures. |
| prometheus_tsdb_blocks_loaded | gauge | ins, instance, ip, job, cls | Number of currently loaded data blocks |
| prometheus_tsdb_checkpoint_creations_failed_total | counter | ins, instance, ip, job, cls | Total number of checkpoint creations that failed. |
| prometheus_tsdb_checkpoint_creations_total | counter | ins, instance, ip, job, cls | Total number of checkpoint creations attempted. |
| prometheus_tsdb_checkpoint_deletions_failed_total | counter | ins, instance, ip, job, cls | Total number of checkpoint deletions that failed. |
| prometheus_tsdb_checkpoint_deletions_total | counter | ins, instance, ip, job, cls | Total number of checkpoint deletions attempted. |
| prometheus_tsdb_clean_start | gauge | ins, instance, ip, job, cls | -1: lockfile is disabled. 0: a lockfile from a previous execution was replaced. 1: lockfile creation was clean |
| prometheus_tsdb_compaction_chunk_range_seconds_bucket | Unknown | ins, instance, ip, le, job, cls | N/A |
| prometheus_tsdb_compaction_chunk_range_seconds_count | Unknown | ins, instance, ip, job, cls | N/A |
| prometheus_tsdb_compaction_chunk_range_seconds_sum | Unknown | ins, instance, ip, job, cls | N/A |
| prometheus_tsdb_compaction_chunk_samples_bucket | Unknown | ins, instance, ip, le, job, cls | N/A |
| prometheus_tsdb_compaction_chunk_samples_count | Unknown | ins, instance, ip, job, cls | N/A |
| prometheus_tsdb_compaction_chunk_samples_sum | Unknown | ins, instance, ip, job, cls | N/A |
| prometheus_tsdb_compaction_chunk_size_bytes_bucket | Unknown | ins, instance, ip, le, job, cls | N/A |
| prometheus_tsdb_compaction_chunk_size_bytes_count | Unknown | ins, instance, ip, job, cls | N/A |
| prometheus_tsdb_compaction_chunk_size_bytes_sum | Unknown | ins, instance, ip, job, cls | N/A |
| prometheus_tsdb_compaction_duration_seconds_bucket | Unknown | ins, instance, ip, le, job, cls | N/A |
| prometheus_tsdb_compaction_duration_seconds_count | Unknown | ins, instance, ip, job, cls | N/A |
| prometheus_tsdb_compaction_duration_seconds_sum | Unknown | ins, instance, ip, job, cls | N/A |
| prometheus_tsdb_compaction_populating_block | gauge | ins, instance, ip, job, cls | Set to 1 when a block is currently being written to the disk. |
| prometheus_tsdb_compactions_failed_total | counter | ins, instance, ip, job, cls | Total number of compactions that failed for the partition. |
| prometheus_tsdb_compactions_skipped_total | counter | ins, instance, ip, job, cls | Total number of skipped compactions due to disabled auto compaction. |
| prometheus_tsdb_compactions_total | counter | ins, instance, ip, job, cls | Total number of compactions that were executed for the partition. |
| prometheus_tsdb_compactions_triggered_total | counter | ins, instance, ip, job, cls | Total number of triggered compactions for the partition. |
| prometheus_tsdb_data_replay_duration_seconds | gauge | ins, instance, ip, job, cls | Time taken to replay the data on disk. |
| prometheus_tsdb_exemplar_exemplars_appended_total | counter | ins, instance, ip, job, cls | Total number of appended exemplars. |
| prometheus_tsdb_exemplar_exemplars_in_storage | gauge | ins, instance, ip, job, cls | Number of exemplars currently in circular storage. |
| prometheus_tsdb_exemplar_last_exemplars_timestamp_seconds | gauge | ins, instance, ip, job, cls | The timestamp of the oldest exemplar stored in circular storage. Useful to check for what timerange the current exemplar buffer limit allows. This usually means the last timestampfor all exemplars for a typical setup. This is not true though if one of the series timestamp is in future compared to rest series. |
| prometheus_tsdb_exemplar_max_exemplars | gauge | ins, instance, ip, job, cls | Total number of exemplars the exemplar storage can store, resizeable. |
| prometheus_tsdb_exemplar_out_of_order_exemplars_total | counter | ins, instance, ip, job, cls | Total number of out of order exemplar ingestion failed attempts. |
| prometheus_tsdb_exemplar_series_with_exemplars_in_storage | gauge | ins, instance, ip, job, cls | Number of series with exemplars currently in circular storage. |
| prometheus_tsdb_head_active_appenders | gauge | ins, instance, ip, job, cls | Number of currently active appender transactions |
| prometheus_tsdb_head_chunks | gauge | ins, instance, ip, job, cls | Total number of chunks in the head block. |
| prometheus_tsdb_head_chunks_created_total | counter | ins, instance, ip, job, cls | Total number of chunks created in the head |
| prometheus_tsdb_head_chunks_removed_total | counter | ins, instance, ip, job, cls | Total number of chunks removed in the head |
| prometheus_tsdb_head_chunks_storage_size_bytes | gauge | ins, instance, ip, job, cls | Size of the chunks_head directory. |
| prometheus_tsdb_head_gc_duration_seconds_count | Unknown | ins, instance, ip, job, cls | N/A |
| prometheus_tsdb_head_gc_duration_seconds_sum | Unknown | ins, instance, ip, job, cls | N/A |
| prometheus_tsdb_head_max_time | gauge | ins, instance, ip, job, cls | Maximum timestamp of the head block. The unit is decided by the library consumer. |
| prometheus_tsdb_head_max_time_seconds | gauge | ins, instance, ip, job, cls | Maximum timestamp of the head block. |
| prometheus_tsdb_head_min_time | gauge | ins, instance, ip, job, cls | Minimum time bound of the head block. The unit is decided by the library consumer. |
| prometheus_tsdb_head_min_time_seconds | gauge | ins, instance, ip, job, cls | Minimum time bound of the head block. |
| prometheus_tsdb_head_out_of_order_samples_appended_total | counter | ins, instance, ip, job, cls | Total number of appended out of order samples. |
| prometheus_tsdb_head_samples_appended_total | counter | ins, instance, ip, type, job, cls | Total number of appended samples. |
| prometheus_tsdb_head_series | gauge | ins, instance, ip, job, cls | Total number of series in the head block. |
| prometheus_tsdb_head_series_created_total | counter | ins, instance, ip, job, cls | Total number of series created in the head |
| prometheus_tsdb_head_series_not_found_total | counter | ins, instance, ip, job, cls | Total number of requests for series that were not found. |
| prometheus_tsdb_head_series_removed_total | counter | ins, instance, ip, job, cls | Total number of series removed in the head |
| prometheus_tsdb_head_truncations_failed_total | counter | ins, instance, ip, job, cls | Total number of head truncations that failed. |
| prometheus_tsdb_head_truncations_total | counter | ins, instance, ip, job, cls | Total number of head truncations attempted. |
| prometheus_tsdb_isolation_high_watermark | gauge | ins, instance, ip, job, cls | The highest TSDB append ID that has been given out. |
| prometheus_tsdb_isolation_low_watermark | gauge | ins, instance, ip, job, cls | The lowest TSDB append ID that is still referenced. |
| prometheus_tsdb_lowest_timestamp | gauge | ins, instance, ip, job, cls | Lowest timestamp value stored in the database. The unit is decided by the library consumer. |
| prometheus_tsdb_lowest_timestamp_seconds | gauge | ins, instance, ip, job, cls | Lowest timestamp value stored in the database. |
| prometheus_tsdb_mmap_chunk_corruptions_total | counter | ins, instance, ip, job, cls | Total number of memory-mapped chunk corruptions. |
| prometheus_tsdb_mmap_chunks_total | counter | ins, instance, ip, job, cls | Total number of chunks that were memory-mapped. |
| prometheus_tsdb_out_of_bound_samples_total | counter | ins, instance, ip, type, job, cls | Total number of out of bound samples ingestion failed attempts with out of order support disabled. |
| prometheus_tsdb_out_of_order_samples_total | counter | ins, instance, ip, type, job, cls | Total number of out of order samples ingestion failed attempts due to out of order being disabled. |
| prometheus_tsdb_reloads_failures_total | counter | ins, instance, ip, job, cls | Number of times the database failed to reloadBlocks block data from disk. |
| prometheus_tsdb_reloads_total | counter | ins, instance, ip, job, cls | Number of times the database reloaded block data from disk. |
| prometheus_tsdb_retention_limit_bytes | gauge | ins, instance, ip, job, cls | Max number of bytes to be retained in the tsdb blocks, configured 0 means disabled |
| prometheus_tsdb_retention_limit_seconds | gauge | ins, instance, ip, job, cls | How long to retain samples in storage. |
| prometheus_tsdb_size_retentions_total | counter | ins, instance, ip, job, cls | The number of times that blocks were deleted because the maximum number of bytes was exceeded. |
| prometheus_tsdb_snapshot_replay_error_total | counter | ins, instance, ip, job, cls | Total number snapshot replays that failed. |
| prometheus_tsdb_storage_blocks_bytes | gauge | ins, instance, ip, job, cls | The number of bytes that are currently used for local storage by all blocks. |
| prometheus_tsdb_symbol_table_size_bytes | gauge | ins, instance, ip, job, cls | Size of symbol table in memory for loaded blocks |
| prometheus_tsdb_time_retentions_total | counter | ins, instance, ip, job, cls | The number of times that blocks were deleted because the maximum time limit was exceeded. |
| prometheus_tsdb_tombstone_cleanup_seconds_bucket | Unknown | ins, instance, ip, le, job, cls | N/A |
| prometheus_tsdb_tombstone_cleanup_seconds_count | Unknown | ins, instance, ip, job, cls | N/A |
| prometheus_tsdb_tombstone_cleanup_seconds_sum | Unknown | ins, instance, ip, job, cls | N/A |
| prometheus_tsdb_too_old_samples_total | counter | ins, instance, ip, type, job, cls | Total number of out of order samples ingestion failed attempts with out of support enabled, but sample outside of time window. |
| prometheus_tsdb_vertical_compactions_total | counter | ins, instance, ip, job, cls | Total number of compactions done on overlapping blocks. |
| prometheus_tsdb_wal_completed_pages_total | counter | ins, instance, ip, job, cls | Total number of completed pages. |
| prometheus_tsdb_wal_corruptions_total | counter | ins, instance, ip, job, cls | Total number of WAL corruptions. |
| prometheus_tsdb_wal_fsync_duration_seconds | summary | ins, instance, ip, job, cls, quantile | Duration of write log fsync. |
| prometheus_tsdb_wal_fsync_duration_seconds_count | Unknown | ins, instance, ip, job, cls | N/A |
| prometheus_tsdb_wal_fsync_duration_seconds_sum | Unknown | ins, instance, ip, job, cls | N/A |
| prometheus_tsdb_wal_page_flushes_total | counter | ins, instance, ip, job, cls | Total number of page flushes. |
| prometheus_tsdb_wal_segment_current | gauge | ins, instance, ip, job, cls | Write log segment index that TSDB is currently writing to. |
| prometheus_tsdb_wal_storage_size_bytes | gauge | ins, instance, ip, job, cls | Size of the write log directory. |
| prometheus_tsdb_wal_truncate_duration_seconds_count | Unknown | ins, instance, ip, job, cls | N/A |
| prometheus_tsdb_wal_truncate_duration_seconds_sum | Unknown | ins, instance, ip, job, cls | N/A |
| prometheus_tsdb_wal_truncations_failed_total | counter | ins, instance, ip, job, cls | Total number of write log truncations that failed. |
| prometheus_tsdb_wal_truncations_total | counter | ins, instance, ip, job, cls | Total number of write log truncations attempted. |
| prometheus_tsdb_wal_writes_failed_total | counter | ins, instance, ip, job, cls | Total number of write log writes that failed. |
| prometheus_web_federation_errors_total | counter | ins, instance, ip, job, cls | Total number of errors that occurred while sending federation responses. |
| prometheus_web_federation_warnings_total | counter | ins, instance, ip, job, cls | Total number of warnings that occurred while sending federation responses. |
| promhttp_metric_handler_requests_in_flight | gauge | ins, instance, ip, job, cls | Current number of scrapes being served. |
| promhttp_metric_handler_requests_total | counter | ins, instance, ip, job, cls, code | Total number of scrapes by HTTP status code. |
| pushgateway_build_info | gauge | revision, version, ins, instance, ip, tags, goarch, goversion, job, cls, branch, goos | A metric with a constant ‘1’ value labeled by version, revision, branch, goversion from which pushgateway was built, and the goos and goarch for the build. |
| pushgateway_http_requests_total | counter | ins, instance, method, ip, job, cls, code, handler | Total HTTP requests processed by the Pushgateway, excluding scrapes. |
| querier_cache_added_new_total | Unknown | ins, instance, ip, job, cache, cls | N/A |
| querier_cache_added_total | Unknown | ins, instance, ip, job, cache, cls | N/A |
| querier_cache_entries | gauge | ins, instance, ip, job, cache, cls | The total number of entries |
| querier_cache_evicted_total | Unknown | ins, instance, ip, job, reason, cache, cls | N/A |
| querier_cache_gets_total | Unknown | ins, instance, ip, job, cache, cls | N/A |
| querier_cache_memory_bytes | gauge | ins, instance, ip, job, cache, cls | The current cache size in bytes |
| querier_cache_misses_total | Unknown | ins, instance, ip, job, cache, cls | N/A |
| querier_cache_stale_gets_total | Unknown | ins, instance, ip, job, cache, cls | N/A |
| ring_member_heartbeats_total | Unknown | ins, instance, ip, job, cls | N/A |
| ring_member_tokens_owned | gauge | ins, instance, ip, job, cls | The number of tokens owned in the ring. |
| ring_member_tokens_to_own | gauge | ins, instance, ip, job, cls | The number of tokens to own in the ring. |
| scrape_duration_seconds | Unknown | ins, instance, ip, job, cls | N/A |
| scrape_samples_post_metric_relabeling | Unknown | ins, instance, ip, job, cls | N/A |
| scrape_samples_scraped | Unknown | ins, instance, ip, job, cls | N/A |
| scrape_series_added | Unknown | ins, instance, ip, job, cls | N/A |
| up | Unknown | ins, instance, ip, job, cls | N/A |
PING Metrics
PING job has 54 metrics, provided by blackbox_exporter.
| Metric Name | Type | Labels | Description |
|---|---|---|---|
| agent_up | Unknown | ins, ip, job, instance, cls | N/A |
| probe_dns_lookup_time_seconds | gauge | ins, ip, job, instance, cls | Returns the time taken for probe dns lookup in seconds |
| probe_duration_seconds | gauge | ins, ip, job, instance, cls | Returns how long the probe took to complete in seconds |
| probe_icmp_duration_seconds | gauge | ins, ip, job, phase, instance, cls | Duration of icmp request by phase |
| probe_icmp_reply_hop_limit | gauge | ins, ip, job, instance, cls | Replied packet hop limit (TTL for ipv4) |
| probe_ip_addr_hash | gauge | ins, ip, job, instance, cls | Specifies the hash of IP address. It’s useful to detect if the IP address changes. |
| probe_ip_protocol | gauge | ins, ip, job, instance, cls | Specifies whether probe ip protocol is IP4 or IP6 |
| probe_success | gauge | ins, ip, job, instance, cls | Displays whether or not the probe was a success |
| scrape_duration_seconds | Unknown | ins, ip, job, instance, cls | N/A |
| scrape_samples_post_metric_relabeling | Unknown | ins, ip, job, instance, cls | N/A |
| scrape_samples_scraped | Unknown | ins, ip, job, instance, cls | N/A |
| scrape_series_added | Unknown | ins, ip, job, instance, cls | N/A |
| up | Unknown | ins, ip, job, instance, cls | N/A |
PUSH Metrics
PushGateway provides 44 metrics.
| Metric Name | Type | Labels | Description |
|---|---|---|---|
| agent_up | Unknown | job, cls, instance, ins, ip | N/A |
| go_gc_duration_seconds | summary | job, cls, instance, ins, quantile, ip | A summary of the pause duration of garbage collection cycles. |
| go_gc_duration_seconds_count | Unknown | job, cls, instance, ins, ip | N/A |
| go_gc_duration_seconds_sum | Unknown | job, cls, instance, ins, ip | N/A |
| go_goroutines | gauge | job, cls, instance, ins, ip | Number of goroutines that currently exist. |
| go_info | gauge | job, cls, instance, ins, ip, version | Information about the Go environment. |
| go_memstats_alloc_bytes | counter | job, cls, instance, ins, ip | Total number of bytes allocated, even if freed. |
| go_memstats_alloc_bytes_total | counter | job, cls, instance, ins, ip | Total number of bytes allocated, even if freed. |
| go_memstats_buck_hash_sys_bytes | gauge | job, cls, instance, ins, ip | Number of bytes used by the profiling bucket hash table. |
| go_memstats_frees_total | counter | job, cls, instance, ins, ip | Total number of frees. |
| go_memstats_gc_sys_bytes | gauge | job, cls, instance, ins, ip | Number of bytes used for garbage collection system metadata. |
| go_memstats_heap_alloc_bytes | gauge | job, cls, instance, ins, ip | Number of heap bytes allocated and still in use. |
| go_memstats_heap_idle_bytes | gauge | job, cls, instance, ins, ip | Number of heap bytes waiting to be used. |
| go_memstats_heap_inuse_bytes | gauge | job, cls, instance, ins, ip | Number of heap bytes that are in use. |
| go_memstats_heap_objects | gauge | job, cls, instance, ins, ip | Number of allocated objects. |
| go_memstats_heap_released_bytes | gauge | job, cls, instance, ins, ip | Number of heap bytes released to OS. |
| go_memstats_heap_sys_bytes | gauge | job, cls, instance, ins, ip | Number of heap bytes obtained from system. |
| go_memstats_last_gc_time_seconds | gauge | job, cls, instance, ins, ip | Number of seconds since 1970 of last garbage collection. |
| go_memstats_lookups_total | counter | job, cls, instance, ins, ip | Total number of pointer lookups. |
| go_memstats_mallocs_total | counter | job, cls, instance, ins, ip | Total number of mallocs. |
| go_memstats_mcache_inuse_bytes | gauge | job, cls, instance, ins, ip | Number of bytes in use by mcache structures. |
| go_memstats_mcache_sys_bytes | gauge | job, cls, instance, ins, ip | Number of bytes used for mcache structures obtained from system. |
| go_memstats_mspan_inuse_bytes | gauge | job, cls, instance, ins, ip | Number of bytes in use by mspan structures. |
| go_memstats_mspan_sys_bytes | gauge | job, cls, instance, ins, ip | Number of bytes used for mspan structures obtained from system. |
| go_memstats_next_gc_bytes | gauge | job, cls, instance, ins, ip | Number of heap bytes when next garbage collection will take place. |
| go_memstats_other_sys_bytes | gauge | job, cls, instance, ins, ip | Number of bytes used for other system allocations. |
| go_memstats_stack_inuse_bytes | gauge | job, cls, instance, ins, ip | Number of bytes in use by the stack allocator. |
| go_memstats_stack_sys_bytes | gauge | job, cls, instance, ins, ip | Number of bytes obtained from system for stack allocator. |
| go_memstats_sys_bytes | gauge | job, cls, instance, ins, ip | Number of bytes obtained from system. |
| go_threads | gauge | job, cls, instance, ins, ip | Number of OS threads created. |
| process_cpu_seconds_total | counter | job, cls, instance, ins, ip | Total user and system CPU time spent in seconds. |
| process_max_fds | gauge | job, cls, instance, ins, ip | Maximum number of open file descriptors. |
| process_open_fds | gauge | job, cls, instance, ins, ip | Number of open file descriptors. |
| process_resident_memory_bytes | gauge | job, cls, instance, ins, ip | Resident memory size in bytes. |
| process_start_time_seconds | gauge | job, cls, instance, ins, ip | Start time of the process since unix epoch in seconds. |
| process_virtual_memory_bytes | gauge | job, cls, instance, ins, ip | Virtual memory size in bytes. |
| process_virtual_memory_max_bytes | gauge | job, cls, instance, ins, ip | Maximum amount of virtual memory available in bytes. |
| pushgateway_build_info | gauge | job, goversion, cls, branch, instance, tags, revision, goarch, ins, ip, version, goos | A metric with a constant ‘1’ value labeled by version, revision, branch, goversion from which pushgateway was built, and the goos and goarch for the build. |
| pushgateway_http_requests_total | counter | job, cls, method, code, handler, instance, ins, ip | Total HTTP requests processed by the Pushgateway, excluding scrapes. |
| scrape_duration_seconds | Unknown | job, cls, instance, ins, ip | N/A |
| scrape_samples_post_metric_relabeling | Unknown | job, cls, instance, ins, ip | N/A |
| scrape_samples_scraped | Unknown | job, cls, instance, ins, ip | N/A |
| scrape_series_added | Unknown | job, cls, instance, ins, ip | N/A |
| up | Unknown | job, cls, instance, ins, ip | N/A |
6 - FAQ
What components are included in the INFRA module?
The current infra role directly manages these components:
- Nginx: Exposes Grafana, VictoriaMetrics (VMUI), Alertmanager, and other WebUIs, and hosts local YUM/APT repositories.
- DNSMasq: Provides DNS registration and resolution.
- VictoriaMetrics suite: VictoriaMetrics, VMAlert, VictoriaLogs, and VictoriaTraces.
- Alertmanager, Blackbox Exporter, and Grafana: Alert dispatch, blackbox probing, and visualization.
infra.yml also runs the CA, repository, NODE, HAProxy, and node-monitoring roles. These configure supporting services such as the self-signed CA, Chronyd, Node Exporter, and Vector on Infra nodes.
ETCD, PostgreSQL, and Docker are separate modules. The infra.yml playbook does not deploy them. Use etcd.yml, pgsql.yml, and docker.yml, respectively.
How to re-register monitoring targets to VictoriaMetrics?
VictoriaMetrics uses static service discovery through the /infra/targets/<job>/*.yml directory. If target files are accidentally deleted, use the following commands to re-register:
Other modules (such as pg_monitor.yml and mysql.yml) also provide corresponding *_register tags that can be executed as needed.
How to re-register PostgreSQL datasources to Grafana?
PGSQL databases defined in pg_databases are registered as Grafana datasources by default (for use by PGCAT applications).
If you accidentally delete postgres datasources registered in Grafana, you can register them again using the following command:
How to re-register node HAProxy admin pages to Nginx?
If you accidentally delete the registered haproxy proxy settings in /etc/nginx/conf.d/haproxy, you can restore them using the following command:
How to restore DNS registration records in DNSMASQ?
PGSQL cluster/instance domains are registered by default to /etc/dnsmasq.d/pigsty/<name> on infra nodes. You can restore them using the following command:
How to expose new upstream services via Nginx?
You can access services directly through IP:Port. However, we recommend domain names and the Nginx proxy for WebUI access. This centralizes access, reduces exposed ports, and simplifies access control and auditing.
If you want to expose new WebUI services through the Nginx portal, you can add service definitions to the infra_portal parameter.
For example, here’s the Infra portal configuration used by Pigsty’s official demo, exposing several additional services:
After completing the Nginx upstream service definition, use the following configuration and commands to register new services to Nginx.
For HTTPS, delete files/pki/csr/pigsty.csr and files/pki/nginx/pigsty.{key,crt} to force Nginx SSL/TLS certificate regeneration. The new certificates include the new upstream domains.
To use certificates from an authoritative CA instead of the Pigsty self-signed CA, put them in /etc/nginx/conf.d/cert/. Update the corresponding /etc/nginx/conf.d/<name>.conf configuration.
How to manually add upstream repo files to nodes?
Pigsty has a built-in wrapper script bin/repo-add that calls the ansible playbook node.yml to add repo files to corresponding nodes.
7 - Administration
This section covers daily administration and operations for Pigsty deployments.
7.1 - Nginx Management
Pigsty installs Nginx on INFRA nodes as the entry point for all web services. It listens on standard ports 80/443.
In Pigsty, you can configure Nginx to provide various services through inventory:
- Expose web interfaces for monitoring components like Grafana, VictoriaMetrics (VMUI), Alertmanager, and VictoriaLogs
- Serve static files (software repos, documentation sites, websites, etc.)
- Proxy custom application services (internal apps, database management UIs, Docker application interfaces, etc.)
- Automatically issue self-signed HTTPS certificates, or use Certbot to obtain free Let’s Encrypt certificates
- Expose services through a single port using different subdomains for unified access
Basic Configuration
Customize Nginx behavior via infra_portal parameter:
infra_portal is a dictionary where each key defines a service and the value is the service configuration.
Pigsty generates Nginx configuration files only for services with a defined domain.
home: Special default server for homepage and built-in monitoring component reverse proxies- Proxy services: Specify upstream service address via
endpointfor reverse proxy - Static services: Specify local directory via
pathfor static file serving
Server Parameters
Basic Parameters
| Parameter | Description |
|---|---|
domain | Optional proxy domain |
endpoint | Upstream service address (IP:PORT or socket) |
path | Local directory for static content |
scheme | Protocol type (http/https), default http |
domains | Additional domain list (aliases) |
SSL/TLS Options
| Parameter | Description |
|---|---|
certbot | Enable Let’s Encrypt cert management, value is cert name |
cert | Custom certificate file path |
key | Custom private key file path |
enforce_https | Force HTTPS redirect (301) |
Advanced Settings
| Parameter | Description |
|---|---|
config | Custom Nginx config snippet |
index | Enable directory listing (for static) |
log | Custom log file name |
websocket | Enable WebSocket support |
auth | Enable Basic Auth |
realm | Basic Auth prompt message |
Configuration Examples
Reverse Proxy Services
Static Files and Directory Listing
Custom SSL Certificate
Using Let’s Encrypt Certificates
Force HTTPS Redirect
Custom Config Snippet
Management Commands
Domain Resolution
Three ways to resolve domains to Pigsty servers:
- Public domains: Configure via DNS provider
- Internal DNS server: Configure internal DNS resolution
- Local hosts file: Modify
/etc/hosts
For local development, add to /etc/hosts:
Pigsty includes dnsmasq service, configurable via dns_records parameter for internal DNS resolution.
HTTPS Configuration
Configure HTTPS via nginx_sslmode parameter:
| Mode | Description |
|---|---|
disable | Listen HTTP only (nginx_port) |
enable | Also listen HTTPS (nginx_ssl_port), default self-signed cert |
enforce | Force redirect to HTTPS, all port 80 requests get 301 redirect |
For self-signed certificates, several access options:
- Trust the self-signed CA in browser (download at
http://<ip>/ca.crt) - Use browser security bypass (type “thisisunsafe” in Chrome)
- Configure proper CA-signed certs or Let’s Encrypt for production
Certbot Certificates
Pigsty supports using Certbot to request free Let’s Encrypt certificates.
Enable Certbot
- Add
certbotparameter to services ininfra_portal, specifying cert name - Configure
certbot_emailwith a valid email - Set
certbot_signtotruefor auto-signing during deployment
Manual Certificate Signing
Or run the scripts directly on the server:
For more info, see Certbot: Request and Renew HTTPS Certificates
Default Homepage
Pigsty’s default home server provides these built-in routes:
| Path | Description |
|---|---|
/ | Homepage navigation |
/ui/ | Grafana monitoring dashboards |
/vmetrics/ | VictoriaMetrics VMUI |
/vlogs/ | VictoriaLogs log query |
/vtraces/ | VictoriaTraces tracing |
/vmalert/ | VMAlert alerting rules |
/alertmgr/ | AlertManager alert management |
/blackbox/ | Blackbox Exporter |
/pev | PostgreSQL Explain visualization |
/haproxy/<cluster>/ | HAProxy admin interface (if any) |
These routes provide one entry point for all monitoring components. You do not need to configure multiple domains.
Best Practices
- Use domain names instead of IP:PORT for service access
- Properly configure DNS resolution or hosts file
- Enable WebSocket for real-time apps (e.g., Grafana, Jupyter)
- Enable HTTPS for production
- Use meaningful subdomains to organize services
- Monitor Let’s Encrypt certificate expiration
- Use
configparameter for custom Nginx configurations
Full Example
Here’s the Nginx configuration used by Pigsty’s public demo site demo.pigsty.io:
7.2 - Software Repository
Pigsty’s REPO role downloads required packages and creates a local YUM/APT repository under /www/pigsty. Nginx can serve this repository.
The current package candidate is SOW 0.3.0. SOW generates metadata for both repository types. The source no longer calls createrepo_c, modifyrepo_c, or dpkg-scanpackages separately.
Quick Start
Add packages to repo_packages or repo_extra_packages, then run:
If /www/pigsty/repo_complete already exists, the default repo_build skips the build. To force a rebuild, override it explicitly:
To rebuild metadata for packages already present without downloading new ones:
SOW Prerequisites
Both repo_create and cache_create require sow on the target node. A fresh online build automatically adds infra to the effective repo_modules list. It installs SOW from the Pigsty INFRA upstream repository.
Offline bundles and local repositories created before this change may not contain SOW. Before you rebuild from old media, refresh the bundle or local repository. Alternatively, install the current SOW 0.3.0 candidate from Pigsty INFRA. Do not assume that older environments can still fall back to createrepo_c.
On a fresh installation, the role checks whether /www exists. If absent, it creates /data/nginx and points /www to it. It preserves existing directories and symlinks.
Build Flow
| Task | Purpose |
|---|---|
repo_check | Check repo_complete to determine whether the local repository is complete |
repo_prepare | Configure and use an existing repository |
repo_dir | Create /www/pigsty and ACME directories |
repo_upstream | Back up and add upstream YUM or APT definitions |
repo_url_pkg | Download packages from direct URLs |
repo_cache | Run yum makecache or apt update |
repo_boot_pkg | Install sow and the RPM platform’s dnf-utils / yum-utils |
repo_pkg | Download packages and dependencies |
repo_create | Run SOW to clean and atomically publish repository metadata |
repo_use | Write the local Pigsty repository definition on the current host |
repo_nginx | Start a temporary Nginx when no service is already running |
The command executed by repo_create is:
--pigsty removes unneeded packages and packages likely to cause conflicts. It atomically publishes the result only after all metadata is complete. A typical layout is:
repo_complete contains SHA-256 checksums. Do not treat it as an empty marker. Its presence means SOW completed publication of local repository metadata. It does not prove that remote mirrors, signed repositories, or offline bundles have been synchronized.
DNF Module Streams
Pigsty no longer fabricates modules.yaml / ModuleMD metadata for the aggregated local repository. System upstream repositories retain native DNF module filtering. Only an upstream repository that truly needs to replace an EL module stream should set meta explicitly:
The aggregated local repository uses module_hotfixes=1. This prevents system module streams from hiding local PostgreSQL packages. It does not generate artificial ModuleMD metadata.
Package Aliases
The default repo_packages uses these alias groups:
node-bootstrap includes Ansible, Python dependencies, SOW, and SSH tools. infra-package includes Nginx, etcd, HAProxy, Victoria exporters, Redis/Valkey, Silo, mcli, SOW, and Pig. Exact names vary by operating-system mapping. Use roles/node_id/vars/<os>.<arch>.yml as the authoritative source.
Common Commands
7.3 - Domain Management
Use domain names instead of IP addresses to access Pigsty’s various web services.
Quick Start
Add the following static resolution records to /etc/hosts:
Replace IP address with your actual Pigsty node’s IP.
Why Use Domain Names
- Easier to remember than IP addresses
- Flexible pointing to different IPs
- Unified service management through Nginx
- Support for HTTPS encryption
- Prevent ISP hijacking in some regions
- Allow access to internally bound services via proxy
DNS Mechanism
DNS Protocol: Resolves domain names to IP addresses. Multiple domains can point to same IP.
HTTP Protocol: The Host header routes requests to different sites on the same port (80/443).
Default Domains
Pigsty predefines the following default domains:
| Domain | Service | Port | Purpose |
|---|---|---|---|
i.pigsty | Nginx | 80/443 | Default homepage, local repo, unified entry |
m.pigsty | Silo | 9001 | Object storage console |
By default, access Grafana, VictoriaMetrics, and Alertmanager under i.pigsty. Their paths are /ui/, /vmetrics/, and /alertmgr/, respectively. To use dedicated domains such as g.pigsty, p.pigsty, and a.pigsty, configure them explicitly in infra_portal and dns_records.
Resolution Methods
Local Static Resolution
Add entries to /etc/hosts on the client machine:
Add content:
Internal Dynamic Resolution
Pigsty includes dnsmasq as an internal DNS server. Configure managed nodes to use INFRA node as DNS server:
Configure domain records resolved by dnsmasq via dns_records:
Public Domain Names
Purchase a domain and add DNS A record pointing to public IP:
- Purchase domain from registrar (e.g.,
example.com) - Configure A record pointing to server public IP
- Use real domain in
infra_portal
Built-in DNS Service
Pigsty runs dnsmasq on INFRA nodes as a DNS server.
Related Parameters
| Parameter | Default | Description |
|---|---|---|
dns_enabled | true | Enable DNS service |
dns_port | 53 | DNS listen port |
dns_records | See below | Default DNS records |
Default DNS records:
Dynamic DNS Registration
Pigsty automatically registers DNS records for PostgreSQL clusters and instances:
- Instance-level DNS:
<pg_instance>points to instance IP (e.g.,pg-meta-1) - Cluster-level DNS:
<pg_cluster>points to primary IP or VIP (e.g.,pg-meta)
Cluster-level DNS target controlled by pg_dns_target:
| Value | Description |
|---|---|
auto | Auto-select: use VIP if available, else primary IP |
primary | Always point to primary IP |
vip | Always point to VIP (requires VIP enabled) |
none | Don’t register cluster DNS |
<ip> | Specify fixed IP address |
Add suffix to cluster DNS via pg_dns_suffix.
Node DNS Configuration
Pigsty manages DNS configuration on managed nodes.
Static hosts Records
Configure static /etc/hosts records via node_etc_hosts:
DNS Server Configuration
| Parameter | Default | Description |
|---|---|---|
node_dns_method | add | DNS config method |
node_dns_servers | ['${admin_ip}'] | DNS server list |
node_dns_options | See below | resolv.conf options |
node_dns_method options:
| Value | Description |
|---|---|
add | Prepend to existing DNS server list |
overwrite | Completely overwrite DNS config |
none | Don’t modify DNS config |
Default DNS options:
HTTPS Certificates
Pigsty uses self-signed certificates by default. Options include:
- Ignore warnings, use HTTP
- Trust self-signed CA certificate (download at
http://<ip>/ca.crt) - Use real CA or get free public domain certs via Certbot
See CA and Certificates documentation for details.
Extended Domains
Pigsty reserves the following domains for various application services:
| Domain | Purpose |
|---|---|
adm.pigsty | PgAdmin interface |
ddl.pigsty | Bytebase DDL management |
cli.pigsty | PgWeb CLI interface |
api.pigsty | PostgREST API service |
lab.pigsty | Jupyter environment |
git.pigsty | Gitea Git service |
wiki.pigsty | Wiki.js docs |
noco.pigsty | NocoDB |
supa.pigsty | Supabase |
dify.pigsty | Dify AI |
odoo.pigsty | Odoo ERP |
mm.pigsty | Mattermost |
Using these domains requires configuring corresponding services in infra_portal.
Management Commands
7.4 - Module Management
Use this guide for daily INFRA administration. It covers installation, removal, scaling, and component maintenance.
Install INFRA Module
Use the infra.yml playbook to install the INFRA module on the infra group:
Uninstall INFRA Module
Use the infra-rm.yml playbook to uninstall the INFRA module from the infra group:
This playbook has no deletion safeguard. Full execution removes infra_data, nginx_data, nginx_home (default: /www), and /var/lib/grafana.
If you only need to stop services or deregister targets, use -t service or -t deregister. Read the complete removal scope and back up required data before running it.
Scale Out INFRA Module
Assign infra_seq to new nodes and add them to the infra group in the inventory:
Use the -l limit option to execute the playbook on the new node only:
Manage Local Repository
Local repository management tasks:
Complete subtask list:
Manage Nginx
Nginx management tasks:
Request HTTPS certificate:
Manage Infrastructure Components
Management commands for various infrastructure components:
Common maintenance commands:
Manage Grafana Passwords
Grafana uses two password parameters. grafana_admin_password defaults to the public value pigsty. grafana_view_password defaults to DBUser.Viewer.
| Parameter | Rendered configuration |
|---|---|
grafana_admin_password | /etc/grafana/grafana.ini and /infra/env/pigsty |
grafana_view_password | /etc/grafana/provisioning/datasources/pigsty.yml |
Change the public defaults before production. After initialization, a change to grafana_admin_password in the inventory does not reset the live Grafana account password. Change it through Grafana or a supported administration interface. Keep the inventory consistent and regenerate the environment when needed:
grafana_view_password is the password used by the default PostgreSQL metadb data source as dbuser_view. If the database role password changes, update both the declared value and the Grafana data source. A change on only one side breaks the dashboard connection.
7.5 - CA and Certificates
Pigsty maintains a self-signed Certificate Authority (CA) on the admin node by default. It signs certificates for PostgreSQL, Patroni, etcd, Silo, Nginx, and other internal services. Public Nginx entries can use Certbot/Let’s Encrypt certificates configured through infra_portal.
files/pki/ca/ca.key is the trust-root private key for the entire deployment. Never print, commit, upload, or transmit it over an unprotected channel. Back it up with ca.crt. Encrypt the backup and tightly restrict read access.
Self-Signed CA
The ca stage of infra.yml creates or reuses the CA locally on the admin node running Ansible. It does not create the CA on a remote Infra node. The default layout is:
The core defaults match the v4.5.0 roles:
| Parameter | Default | Meaning |
|---|---|---|
ca_create | true | Allow creation when ca.key is missing |
ca_cn | pigsty-ca | Common Name of the CA certificate |
cert_validity | 7300d | Default internal service/client validity (20 years) |
nginx_cert_validity | 397d | Nginx self-signed HTTPS certificate validity |
The role hard-codes the CA certificate lifetime to 36500d (about 100 years). These long-lived certificates serve a controlled internal trust domain. Public browsers do not trust them by default. Clients must explicitly trust ca.crt. Public endpoints should use a publicly trusted CA.
Initialize the local CA stage:
Running ./infra.yml -t ca may create a missing key or certificate and therefore changes PKI state. Confirm the admin node, configuration, and existing CA backup first.
Use an External CA
To reuse an enterprise CA:
- Set
ca_create: falseinpigsty.yml. - Place a matching
files/pki/ca/ca.keyandfiles/pki/ca/ca.crtpair on the admin node. - Set permissions and verify that the public-key digests match.
ca_create: false prevents generation of a new private key only when ca.key is missing. If the key exists and ca.crt is missing, the role still creates a new self-signed CA certificate from the key. Always restore the pair together instead of relying on certificate regeneration.
Before running the CA stage, verify the files that will be used, the existing CA backup, and the admin node.
Back Up and Restore the CA
Retain at least:
files/pki/ca/ca.keyandca.crt- CA state such as
ca.srl,index.txt, and CRL files if issuance/revocation management uses them - backup time, the CA certificate SHA-256 fingerprint, and restoration instructions
Encrypt the backup and store it on controlled offline media or in a secrets-management system. Do not keep an unencrypted tar archive.
First, restore it to an isolated temporary directory. Before replacement, verify the file count, types, permissions, public-key match, and certificate fingerprint.
Loss of ca.key does not immediately prevent verification of existing certificates. Verification still works if clients trust ca.crt and the certificates remain valid and unrevoked.
You can no longer issue, renew, or revoke certificates with the original CA. Recovery usually requires a new CA, reissuance of every certificate, and deployment of a new trust chain.
Issue Certificates with cert.yml
cert.yml runs locally on the admin node and issues generic certificates with the Pigsty CA. Pass cn explicitly instead of relying on the generic script default:
Default outputs:
| Parameter | Default | Meaning |
|---|---|---|
cn | pigsty | Common Name; set explicitly in real use |
san | [DNS:localhost, IP:127.0.0.1] | Subject Alternative Names |
org | pigsty | Organization |
unit | pigsty | Organizational Unit |
expire | 7300d | Validity |
key | files/pki/misc/<cn>.key | Private-key output path |
crt | files/pki/misc/<cn>.crt | Certificate output path |
Advanced examples:
Verify the certificate without displaying or copying private-key content:
For PostgreSQL client certificates, cn must match the database role expected by HBA/cert authentication. Install the certificate, key, and root certificate on the client. Set the private key permissions to 0600. With sslmode=verify-full, the connection hostname must appear in the server certificate SAN.
Trust the CA Certificate
Distribute only the public ca.crt. Never distribute ca.key. Verify its SHA-256 fingerprint through a separate trusted channel before installation.
Debian / Ubuntu
RHEL / Rocky / AlmaLinux
macOS
Windows (Administrator PowerShell)
Infra Nginx normally exposes the public CA certificate at http://<infra_ip>/ca.crt. Verify the fingerprint after download. HTTP transport alone does not prove certificate authenticity.
Nginx and Let’s Encrypt
Each infra_portal entry can name a certbot certificate. Pigsty’s /etc/nginx/sign-cert uses Certbot webroot mode. It groups domain and domains entries that share a certificate name. Then /etc/nginx/link-cert links the resulting certificate into Nginx.
Prerequisites:
- Public DNS A/AAAA records resolve to the intended Infra node.
- Port 80 is publicly reachable for HTTP-01, and Nginx serves the ACME webroot.
certbot_emailis valid and the Certbot package is installed.- Portal domains, additional domains, and certificate names are exact.
Update the Nginx configuration and issue certificates:
In v4.5.0, the nginx_certbot task has ignore_errors: true. A playbook that continues or reports overall success does not prove certificate issuance. Inspect Certbot state, certificate files, Nginx configuration, and a real TLS handshake.
Renewal scheduling depends on the Certbot package for the operating system. Do not add a duplicate cron job before checking existing timers and cron configuration:
After Certbot replaces certificates on disk, Nginx still needs a reload to use them. Configure a renewal deploy hook, such as systemctl reload nginx, or an equivalent managed process. Verify that it works. Treat automatic renewal as proven only after a real or staging renewal exercise.
Troubleshooting and Acceptance
| Symptom | Check |
|---|---|
| Browser rejects an internal cert | Correct ca.crt, SAN hostname, and system time |
verify-full fails | Connection hostname, SAN, chain, and root certificate |
| Certbot HTTP-01 fails | DNS, port 80, ACME webroot, proxy/CDN, and rate limits |
| Playbook succeeds but old cert remains | Ignored nginx_certbot errors, link-cert, and Nginx reload |
| Permission denied | Private key 0600 (deployed Nginx key is 0640 root:nginx) |
| Trust breaks after CA rotation | Roll out client trust, then service certs, then reload services |
For final acceptance, verify each result separately:
- The certificate content and SANs are correct.
- Chain validation succeeds.
- The service has loaded the new certificate.
- Target clients trust the certificate.
- Renewal is configured and passes a dry run.
A generated file or successful playbook alone does not prove these results.
7.6 - Grafana High Availability: Using PostgreSQL Backend
You can use PostgreSQL as Grafana’s backend database.
This tutorial explains the Pigsty deployment system through these tasks:
- How to create a new database cluster
- How to create new business users in an existing cluster
- How to create new business databases in an existing cluster
- How to access databases created by Pigsty
- How to manage Grafana dashboards
- How to manage PostgreSQL datasources in Grafana
- How to upgrade Grafana database in one step
TL;DR
Create Database Cluster
You can define a grafana database on pg-meta. You can also create a dedicated pg-grafana cluster on new nodes.
Define Cluster
To create a new dedicated cluster pg-grafana on machines 10.10.10.11 and 10.10.10.12, use this config:
Create Cluster
Use this command to create the pg-grafana cluster: pgsql.yml.
This command is the Ansible Playbook pgsql.yml for creating database clusters.
Cluster initialization automatically creates the users and databases in pg_users and pg_databases. After cluster creation, any of these connection strings provides database access without DNS:
Pigsty defaults to a single meta node. The following steps use its existing pg-meta cluster for the Grafana user and database. They do not use the pg-grafana cluster created above.
Create Grafana Business User
Create the user before the database. A database with an owner depends on that user.
Define User
To create user dbuser_grafana on the pg-meta cluster, first add this user definition to pg-meta’s cluster definition:
Location: all.children.pg-meta.vars.pg_users
If you define a different password here, replace the corresponding parameter in subsequent steps
Create User
Use this command to create the dbuser_grafana user (either works):
This actually calls the Ansible Playbook pgsql-user.yml to create the user:
The dbrole_admin role has permission to execute DDL changes in the database, which is exactly what Grafana needs.
Create Grafana Business Database
Define Database
Creating a business database follows the same pattern as users. First add the new database grafana definition to pg-meta’s cluster definition.
Location: all.children.pg-meta.vars.pg_databases
Create Database
Use this command to create the grafana database (either works):
This actually calls the Ansible Playbook pgsql-db.yml to create the database:
Use Grafana Business Database
Verify Connection String Reachability
You can access the database using different services or access methods, for example:
Here, we’ll use the Default service that directly accesses the primary through load balancer.
First verify the connection string is reachable and has DDL execution permissions:
Directly Modify Grafana Config
To make Grafana use a Postgres datasource, edit /etc/grafana/grafana.ini and modify the config:
Change the default config to:
Then restart Grafana:
Activity in the new grafana database indicates that Grafana now uses PostgreSQL as its main backend.
The original Grafana dashboards and datasources are absent from this new backend. Import the dashboards and Postgres datasources again.
Manage Grafana Dashboards
As admin user, navigate to the files/grafana directory under the Pigsty directory and run grafana.py init to reload Pigsty dashboards.
Execution result:
The script detects the environment defined in ~/pigsty during installation. It gets Grafana access information and replaces dashboard URL placeholders (*.pigsty) with actual domains.
Use grafana.py clean to delete target dashboards. Use grafana.py load to load all dashboards from the current directory. When Pigsty dashboards change, use these two commands to upgrade all dashboards.
Manage Postgres Datasources
Pigsty registers PostgreSQL datasources in Grafana when pgsql.yml creates a cluster or pgsql-db.yml creates a business database. You can directly access target database instances through Grafana using the default monitoring user. Most pgcat application features depend on this.
To register Postgres databases, use the register_grafana task in pgsql.yml:
One-Step Grafana Upgrade
Change the Pigsty configuration to switch the Grafana backend database in one step. Edit the grafana_pgurl parameter in pigsty.yml:
Then re-run the grafana task from infra.yml to complete the Grafana upgrade: