NOAA ISD Global Weather Station Historical Data Query
Demonstrate how to import data into a database using the ISD dataset as an example
If you have a database and don’t know what to do with it, why not try this open-source project: Vonng/isd
You can directly reuse the monitoring system Grafana to interactively browse sub-hourly meteorological data from nearly 30,000 surface weather stations over the past 120 years.
This is a fully functional data application that can query meteorological observation records from 30,000 global surface weather stations since 1901.
The PostgreSQL instance should have the PostGIS extension enabled. Use the PGURL environment variable to pass database connection information:
# Pigsty uses dbuser_dba as the default admin account with password DBUser.DBAexportPGURL=postgres://dbuser_dba:[email protected]:5432/meta?sslmode=disable
psql "${PGURL}" -c 'SELECT 1'# Check if connection is available
Fetch and import ISD weather station metadata
This is a daily-updated weather station metadata file containing station longitude/latitude, elevation, name, country, province, and other information. Use the following command to download and import:
make reload-station # Equivalent to downloading the latest station data then loading: get-station + load-station
Fetch and import the latest isd.daily data
isd.daily is a daily-updated dataset containing daily observation data summaries from global weather stations. Use the following command to download and import.
Note that raw data downloaded directly from the NOAA website needs to be parsed before it can be loaded into the database, so you need to download or build an ISD data parser.
make get-parser # Download the parser binary from Github, or you can build directly with go using make buildmake reload-daily # Download and import the latest isd.daily data for this year into the database
Load pre-parsed CSV dataset
The ISD Daily dataset has some dirty data and duplicate data. If you don’t want to manually parse and clean it, a stable pre-parsed CSV dataset is also provided here.
This dataset contains isd.daily data up to 2023-06-24. You can download and import it directly into PostgreSQL without needing a parser.
make get-stable # Get the stable isd.daily historical dataset from Githubmake load-stable # Load the downloaded stable historical dataset into the PostgreSQL database
More Data
Two parts of the ISD dataset are updated daily: weather station metadata and the latest year’s isd.daily (e.g., the 2023 tarball).
You can use the following command to download and refresh these two parts. If the dataset hasn’t been updated, these commands won’t re-download the same data package:
make reload # Actually: reload-station + reload-daily
You can also use the following commands to download and load isd.daily data for a specific year:
bin/get-daily 2022# Get daily weather observation summary for 2022 (1900-2023)bin/load-daily "${PGURL}"2022# Load daily weather observation summary for 2022 (1900-2023)
In addition to the daily summary isd.daily, ISD also provides more detailed sub-hourly raw observation records isd.hourly. The download and load methods are similar:
bin/get-hourly 2022# Download hourly observation records for a specific year (e.g., 2022, options 1900-2023)bin/load-hourly "${PGURL}"2022# Load hourly observation records for a specific year
Data
Dataset Overview
ISD provides four datasets: sub-hourly raw observation data, daily statistical summary data, monthly statistical summary, and yearly statistical summary
Dataset
Notes
ISD Hourly
Sub-hourly observation records
ISD Daily
Daily statistical summary
ISD Monthly
Not used, can be calculated from isd.daily
ISD Yearly
Not used, can be calculated from isd.daily
Daily Summary Dataset
Compressed package size 2.8GB (as of 2023-06-24)
Table size 24GB, index size 6GB, total size approximately 30GB in PostgreSQL
If timescaledb compression is enabled, total size can be compressed to 4.5 GB
Sub-hourly Observation Data
Total compressed package size 117GB
After loading into database: table size 1TB+, index size 600GB+, total size 1.6TB
CREATETABLEIFNOTEXISTSisd.daily(stationVARCHAR(12)NOTNULL,-- station number 6USAF+5WBAN
tsDATENOTNULL,-- observation date
-- Temperature & Dew Point
temp_meanNUMERIC(3,1),-- mean temperature ℃
temp_minNUMERIC(3,1),-- min temperature ℃
temp_maxNUMERIC(3,1),-- max temperature ℃
dewp_meanNUMERIC(3,1),-- mean dew point ℃
-- Air Pressure
slp_meanNUMERIC(5,1),-- sea level pressure (hPa)
stp_meanNUMERIC(5,1),-- station pressure (hPa)
-- Visibility
vis_meanNUMERIC(6),-- visible distance (m)
-- Wind Speed
wdsp_meanNUMERIC(4,1),-- average wind speed (m/s)
wdsp_maxNUMERIC(4,1),-- max wind speed (m/s)
gustNUMERIC(4,1),-- max wind gust (m/s)
-- Precipitation / Snow Depth
prcp_meanNUMERIC(5,1),-- precipitation (mm)
prcpNUMERIC(5,1),-- rectified precipitation (mm)
sndpNuMERIC(5,1),-- snow depth (mm)
-- FRSHTT (Fog/Rain/Snow/Hail/Thunder/Tornado)
is_foggyBOOLEAN,-- (F)og
is_rainyBOOLEAN,-- (R)ain or Drizzle
is_snowyBOOLEAN,-- (S)now or pellets
is_hailBOOLEAN,-- (H)ail
is_thunderBOOLEAN,-- (T)hunder
is_tornadoBOOLEAN,-- (T)ornado or Funnel Cloud
-- Record counts used for statistical aggregation
temp_countSMALLINT,-- record count for temp
dewp_countSMALLINT,-- record count for dew point
slp_countSMALLINT,-- record count for sea level pressure
stp_countSMALLINT,-- record count for station pressure
wdsp_countSMALLINT,-- record count for wind speed
visib_countSMALLINT,-- record count for visible distance
-- Temperature flags
temp_min_fBOOLEAN,-- aggregate min temperature
temp_max_fBOOLEAN,-- aggregate max temperature
prcp_flagCHAR,-- precipitation flag: ABCDEFGHI
PRIMARYKEY(station,ts));-- PARTITION BY RANGE (ts);
Sub-hourly Raw Observation Data Table
ISD Hourly
CREATETABLEIFNOTEXISTSisd.hourly(stationVARCHAR(12)NOTNULL,-- station id
tsTIMESTAMPNOTNULL,-- timestamp
-- air
tempNUMERIC(3,1),-- [-93.2,+61.8]
dewpNUMERIC(3,1),-- [-98.2,+36.8]
slpNUMERIC(5,1),-- [8600,10900]
stpNUMERIC(5,1),-- [4500,10900]
visNUMERIC(6),-- [0,160000]
-- wind
wd_angleNUMERIC(3),-- [1,360]
wd_speedNUMERIC(4,1),-- [0,90]
wd_gustNUMERIC(4,1),-- [0,110]
wd_codeVARCHAR(1),-- code that denotes the character of the WIND-OBSERVATION.
-- cloud
cld_heightNUMERIC(5),-- [0,22000]
cld_codeVARCHAR(2),-- cloud code
-- water
sndpNUMERIC(5,1),-- mm snow
prcpNUMERIC(5,1),-- mm precipitation
prcp_hourNUMERIC(2),-- precipitation duration in hour
prcp_codeVARCHAR(1),-- precipitation type code
-- sky
mw_codeVARCHAR(2),-- manual weather observation code
aw_codeVARCHAR(2),-- auto weather observation code
pw_codeVARCHAR(1),-- weather code of past period of time
pw_hourNUMERIC(2),-- duration of pw_code period
-- misc
-- remark TEXT,
-- eqd TEXT,
dataJSONB-- extra data
)PARTITIONBYRANGE(ts);
Parser
The raw data provided by NOAA ISD is in a highly compressed proprietary format that needs to be processed through a parser before it can be converted into database table format.
For the Daily and Hourly datasets, two parsers are provided here: isdd and isdh.
Both parsers take annual data compressed packages as input, produce CSV results as output, and work in pipeline mode as shown below:
NAME
isd -- Integrated Surface Dataset Parser
SYNOPSIS
isd daily [-i <input|stdin>][-o <output|stout>][-v] isd hourly [-i <input|stdin>][-o <output|stout>][-v][-d raw|ts-first|hour-first]DESCRIPTION
The isd program takes noaa isd daily/hourly raw tarball data as input.
and generate parsed data in csv format as output. Works in pipe mode
cat data/daily/2023.tar.gz | bin/isd daily -v | psql ${PGURL} -AXtwqc "COPY isd.daily FROM STDIN CSV;" isd daily -v -i data/daily/2023.tar.gz | psql ${PGURL} -AXtwqc "COPY isd.daily FROM STDIN CSV;" isd hourly -v -i data/hourly/2023.tar.gz | psql ${PGURL} -AXtwqc "COPY isd.hourly FROM STDIN CSV;"OPTIONS
-i <input> input file, stdin by default
-o <output> output file, stdout by default
-p <profpath> pprof file path, enableif specified
-d de-duplicate rows for hourly dataset (raw, ts-first, hour-first) -v verbose mode
-h print help
User Interface
Several dashboards made with Grafana are provided here for exploring the ISD dataset and querying weather stations and historical meteorological data.
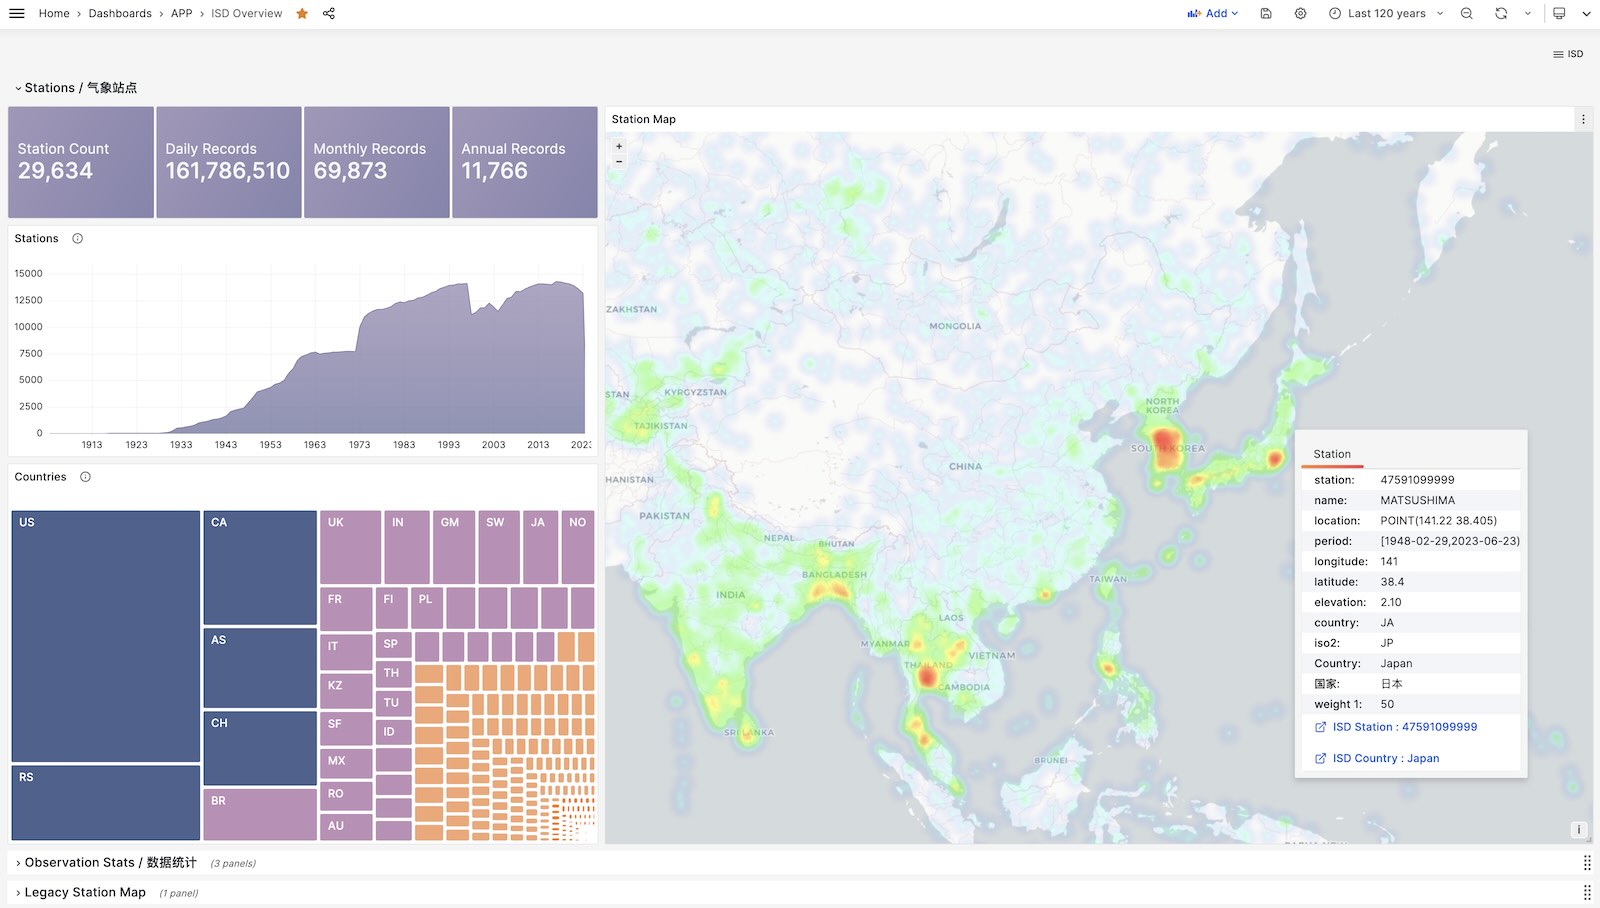
ISD Overview
Global overview with overall metrics and weather station navigation.
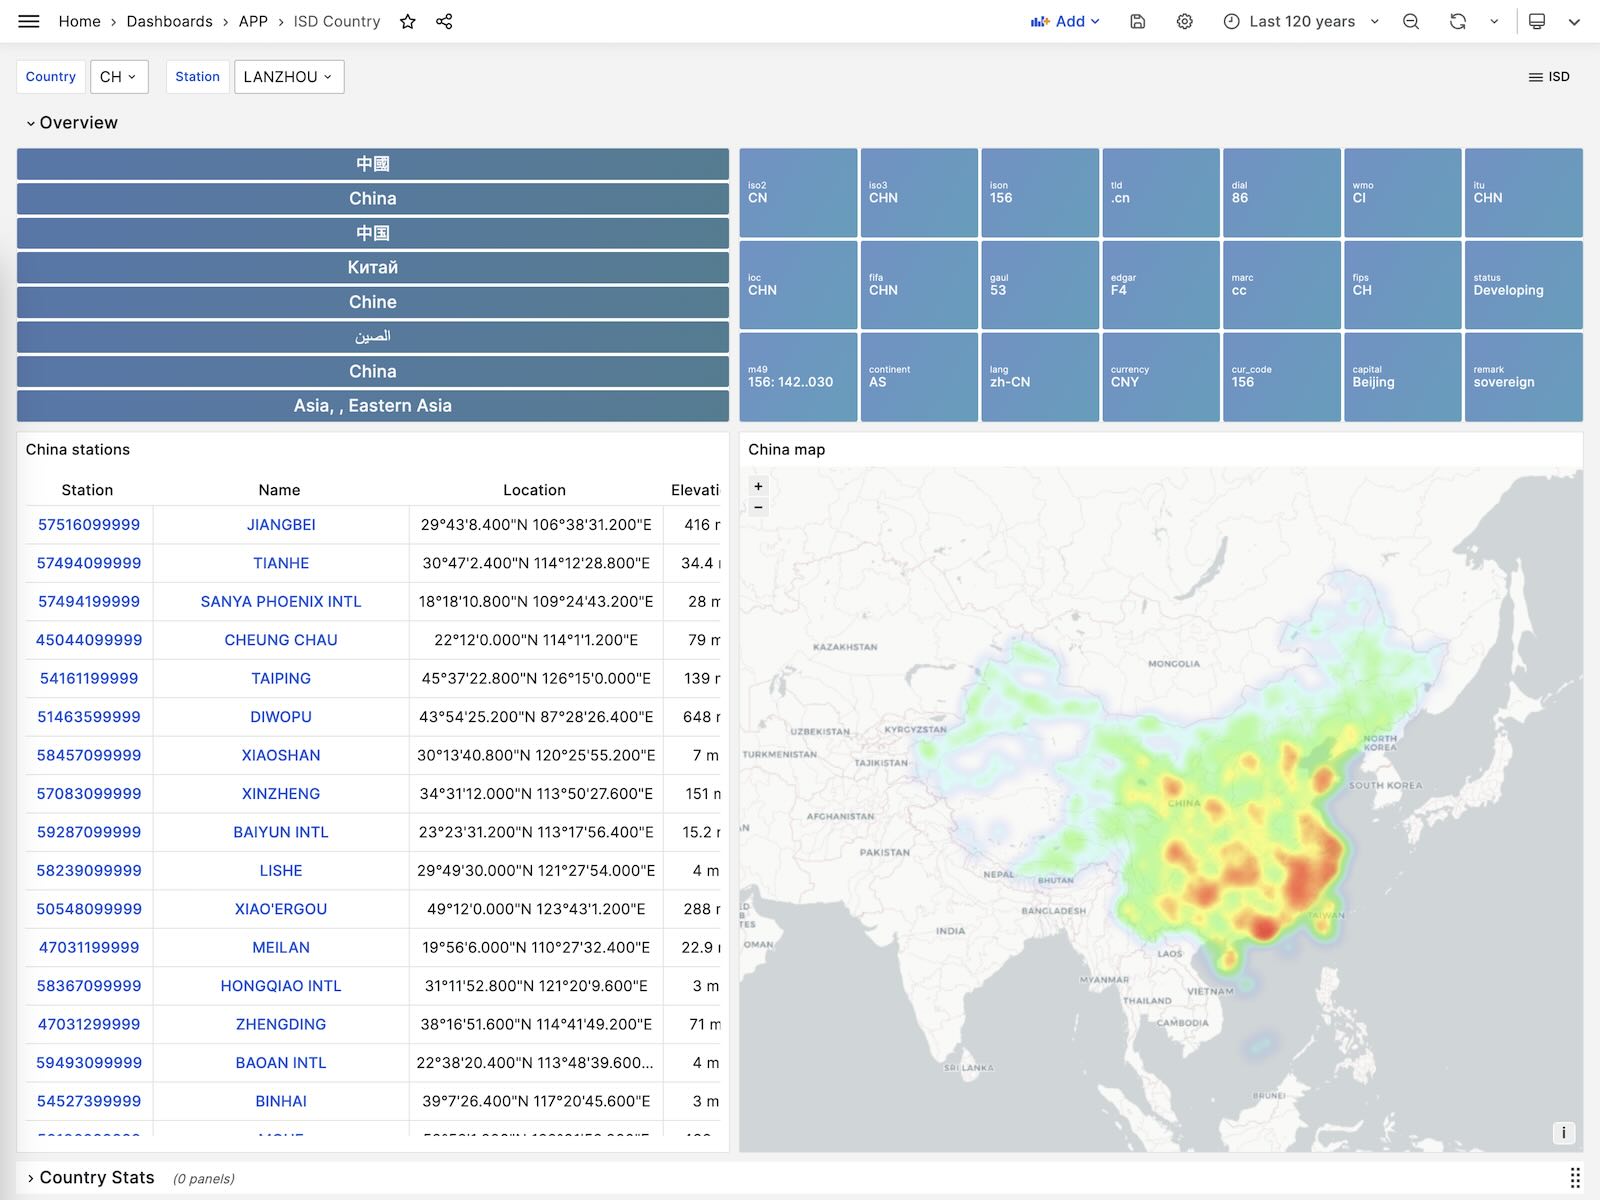
ISD Country
Display all weather stations within a single country/region.
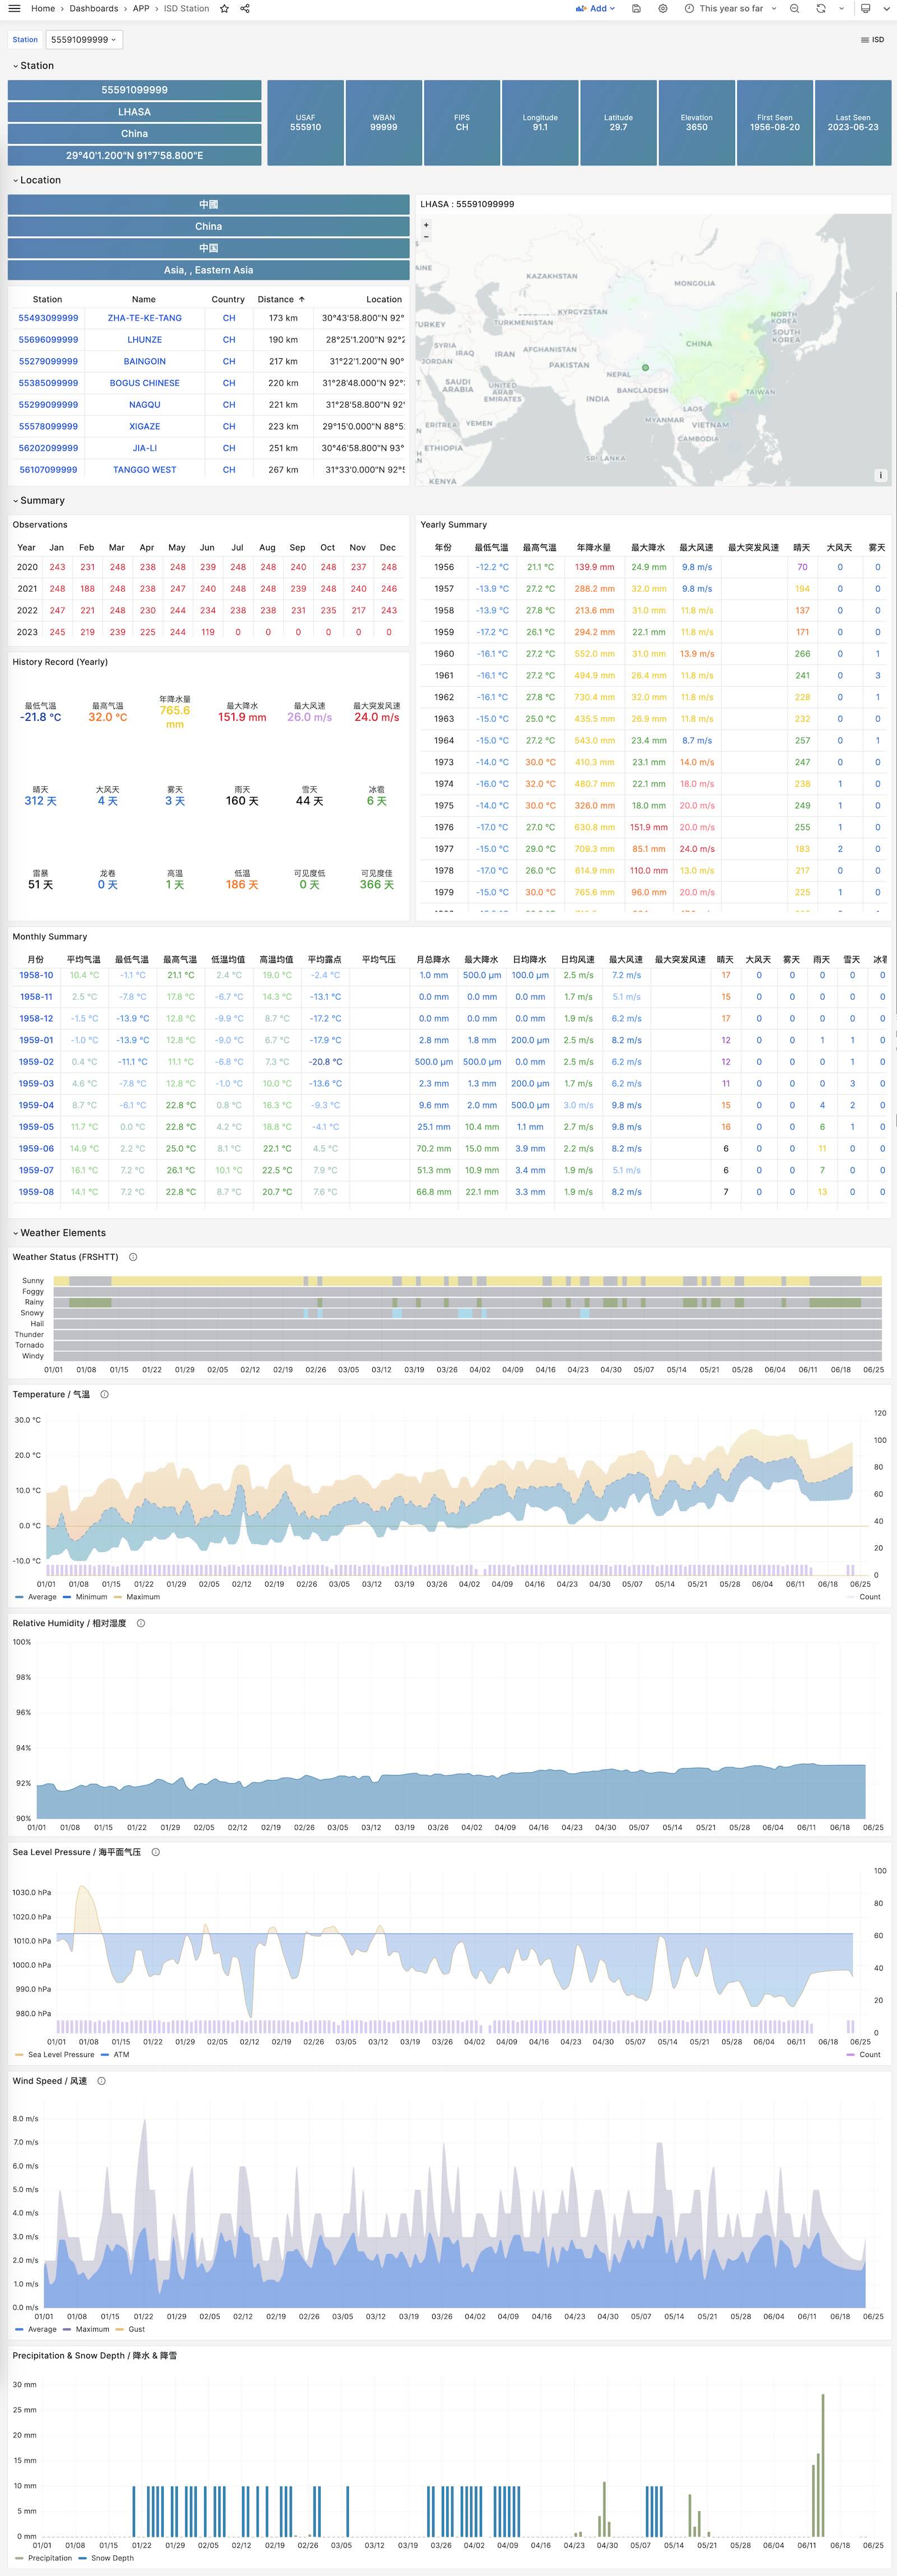
ISD Station
Display detailed information for a single weather station, including metadata and daily/monthly/yearly summary metrics.
ISD Station Dashboard
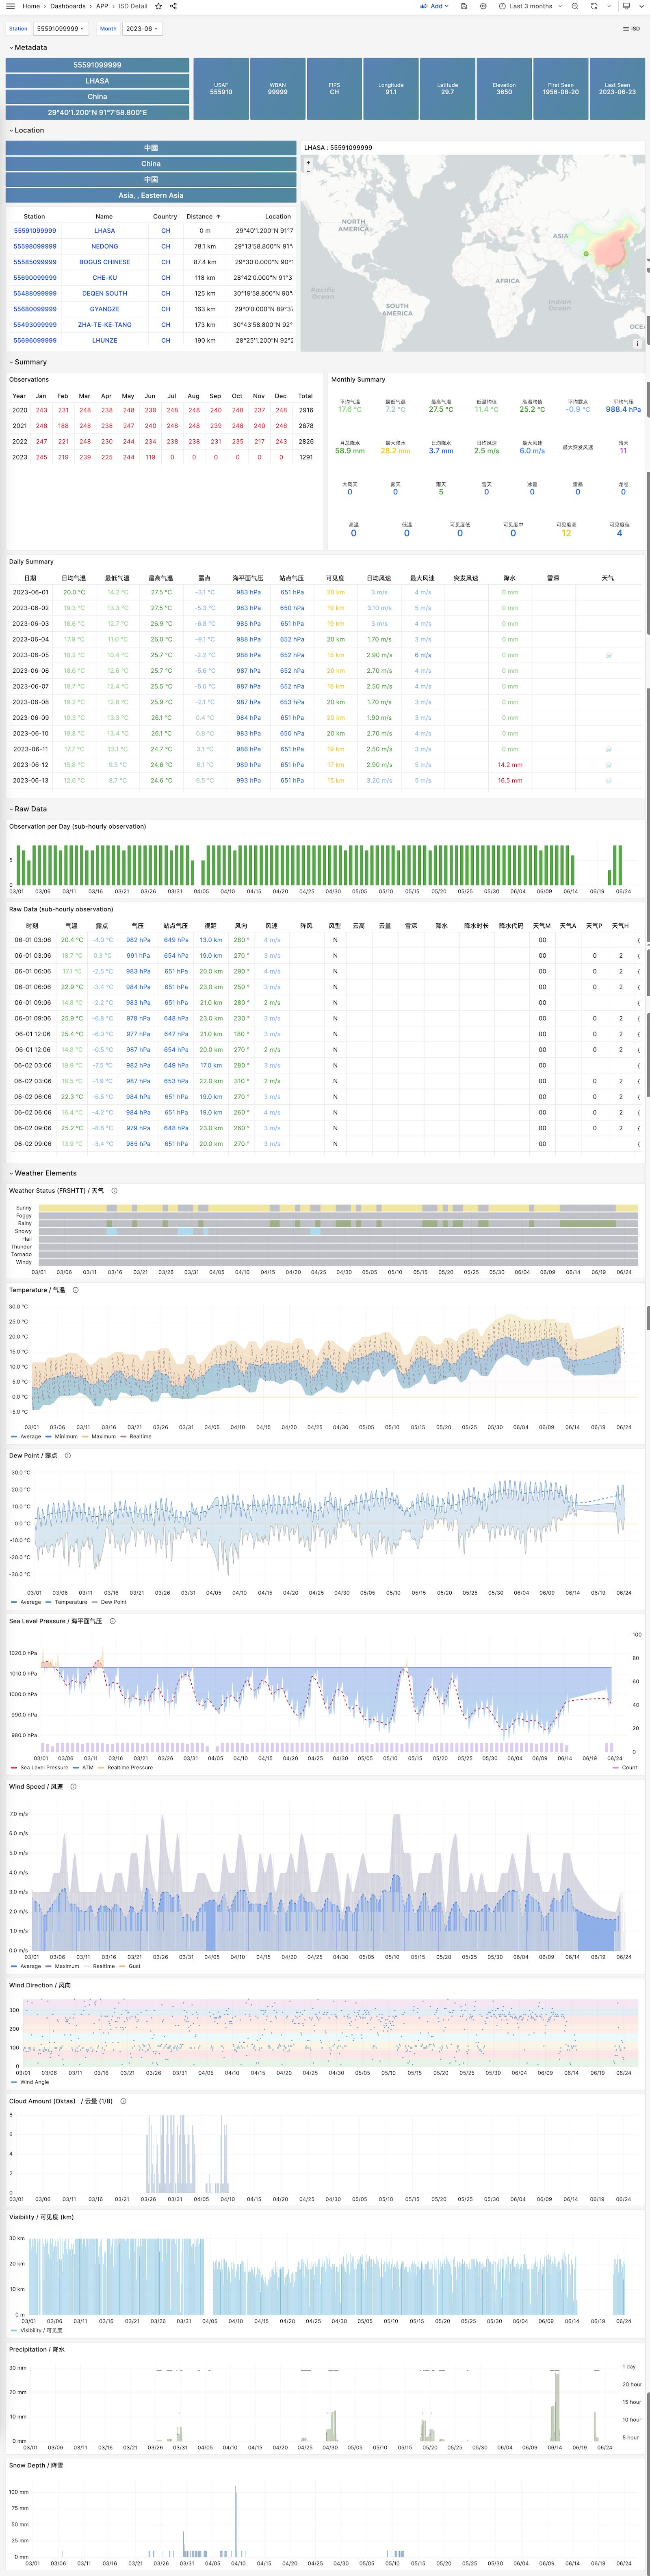
ISD Detail
Display raw sub-hourly observation metric data for a weather station, requires the isd.hourly dataset.