Infrastructure
Running production-grade, highly available PostgreSQL clusters typically requires a comprehensive set of infrastructure services (foundation) for support, such as monitoring and alerting, log collection, time synchronization, DNS resolution, and local software repositories. Pigsty provides the INFRA module to address this—it’s an optional module, but we strongly recommend enabling it.
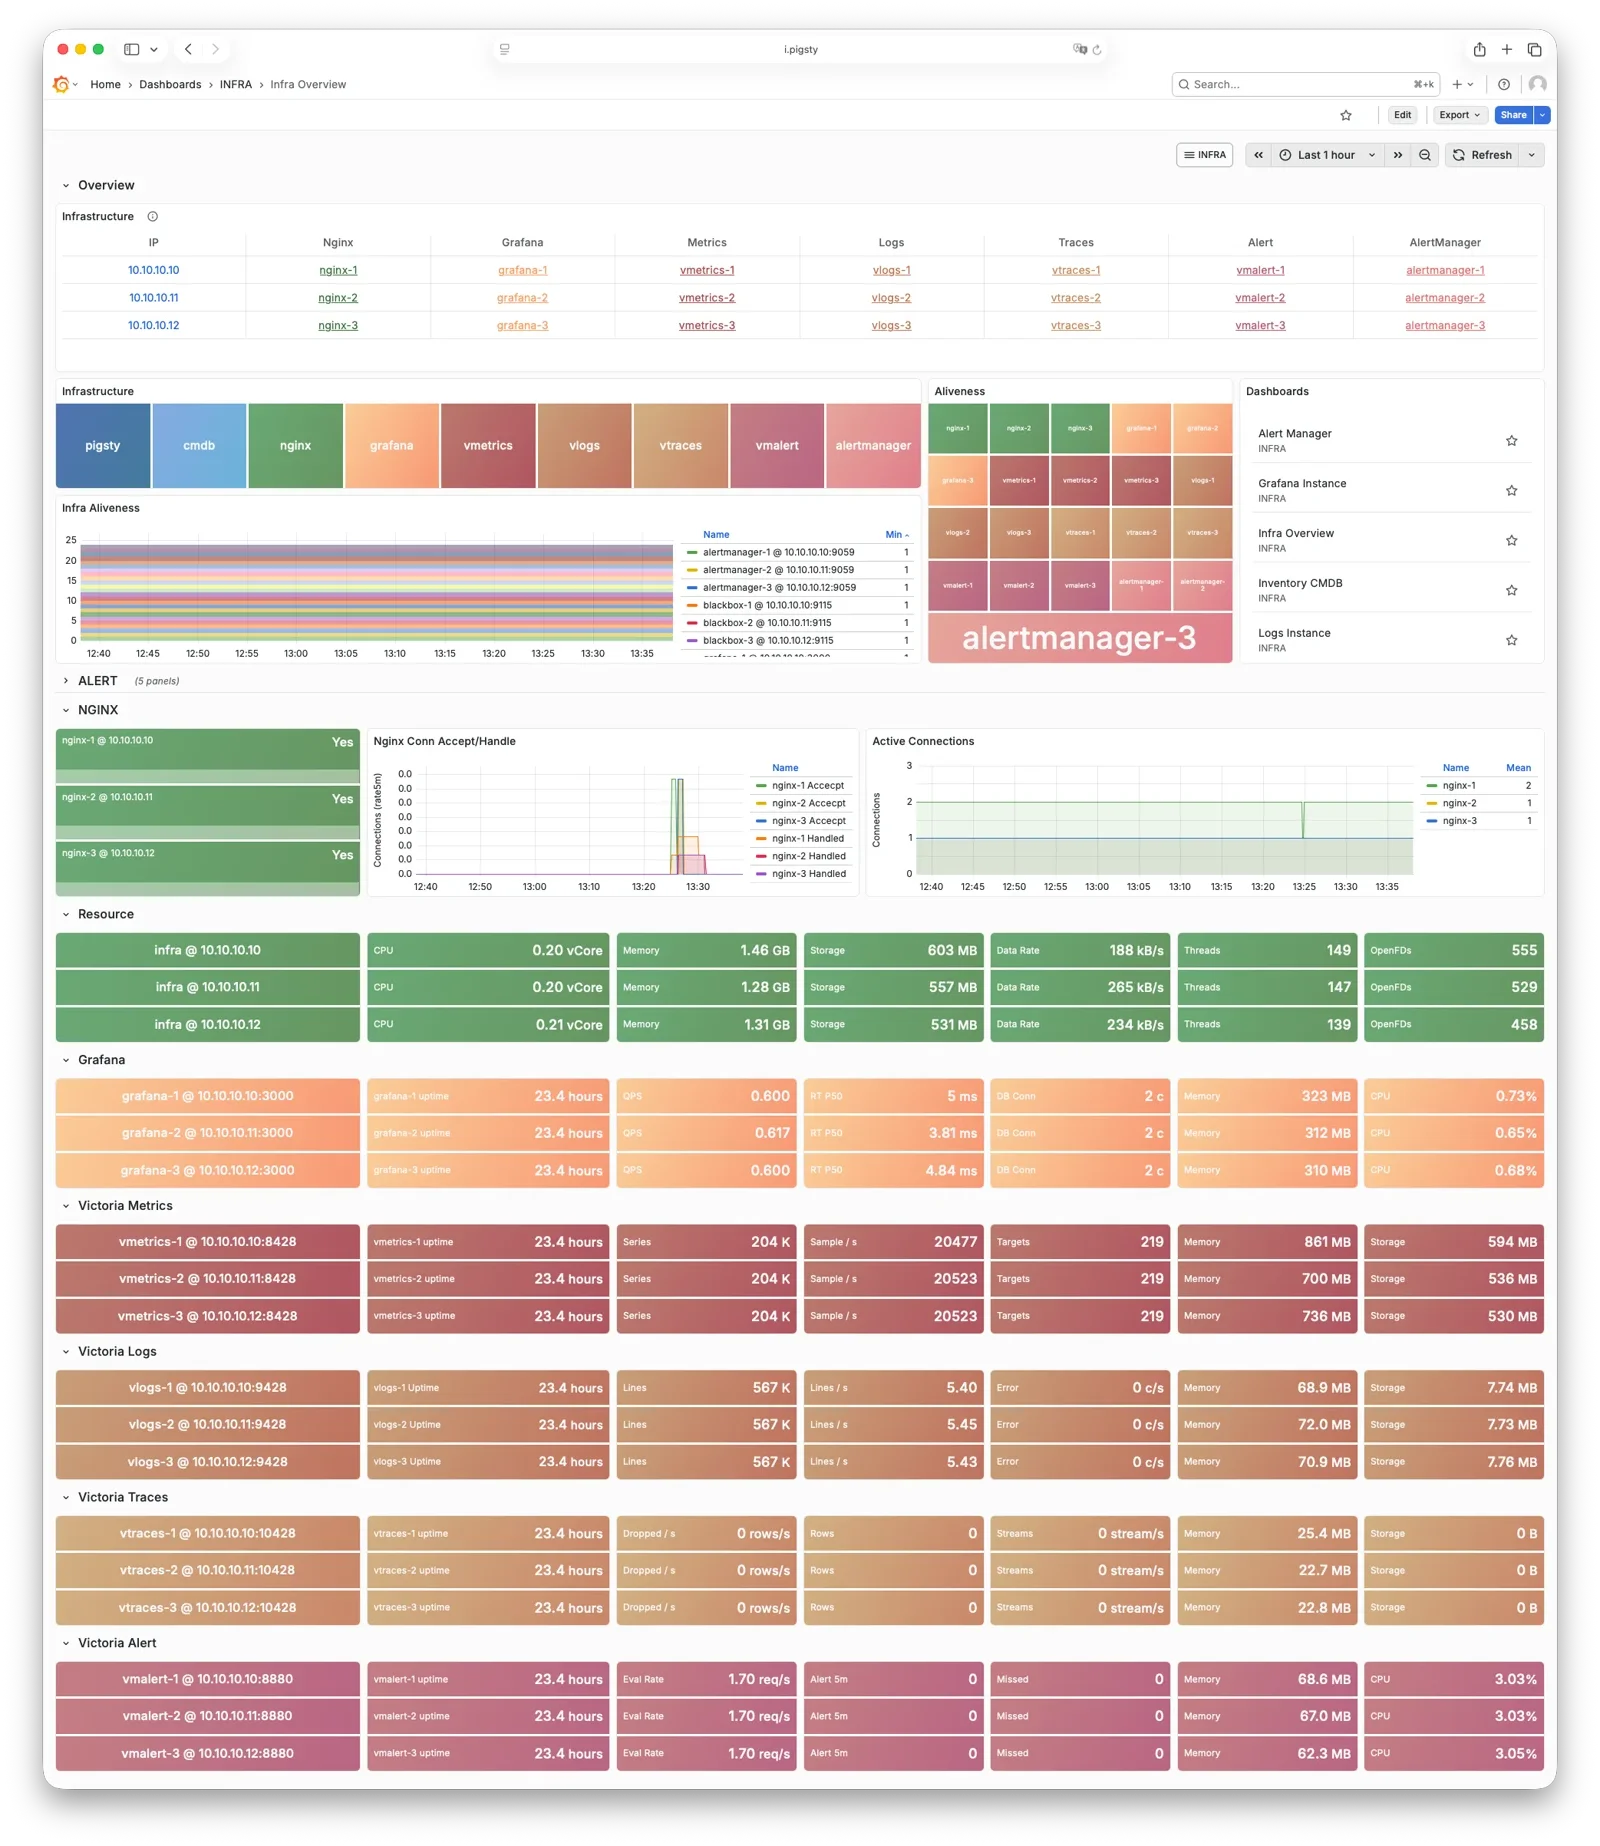
Overview
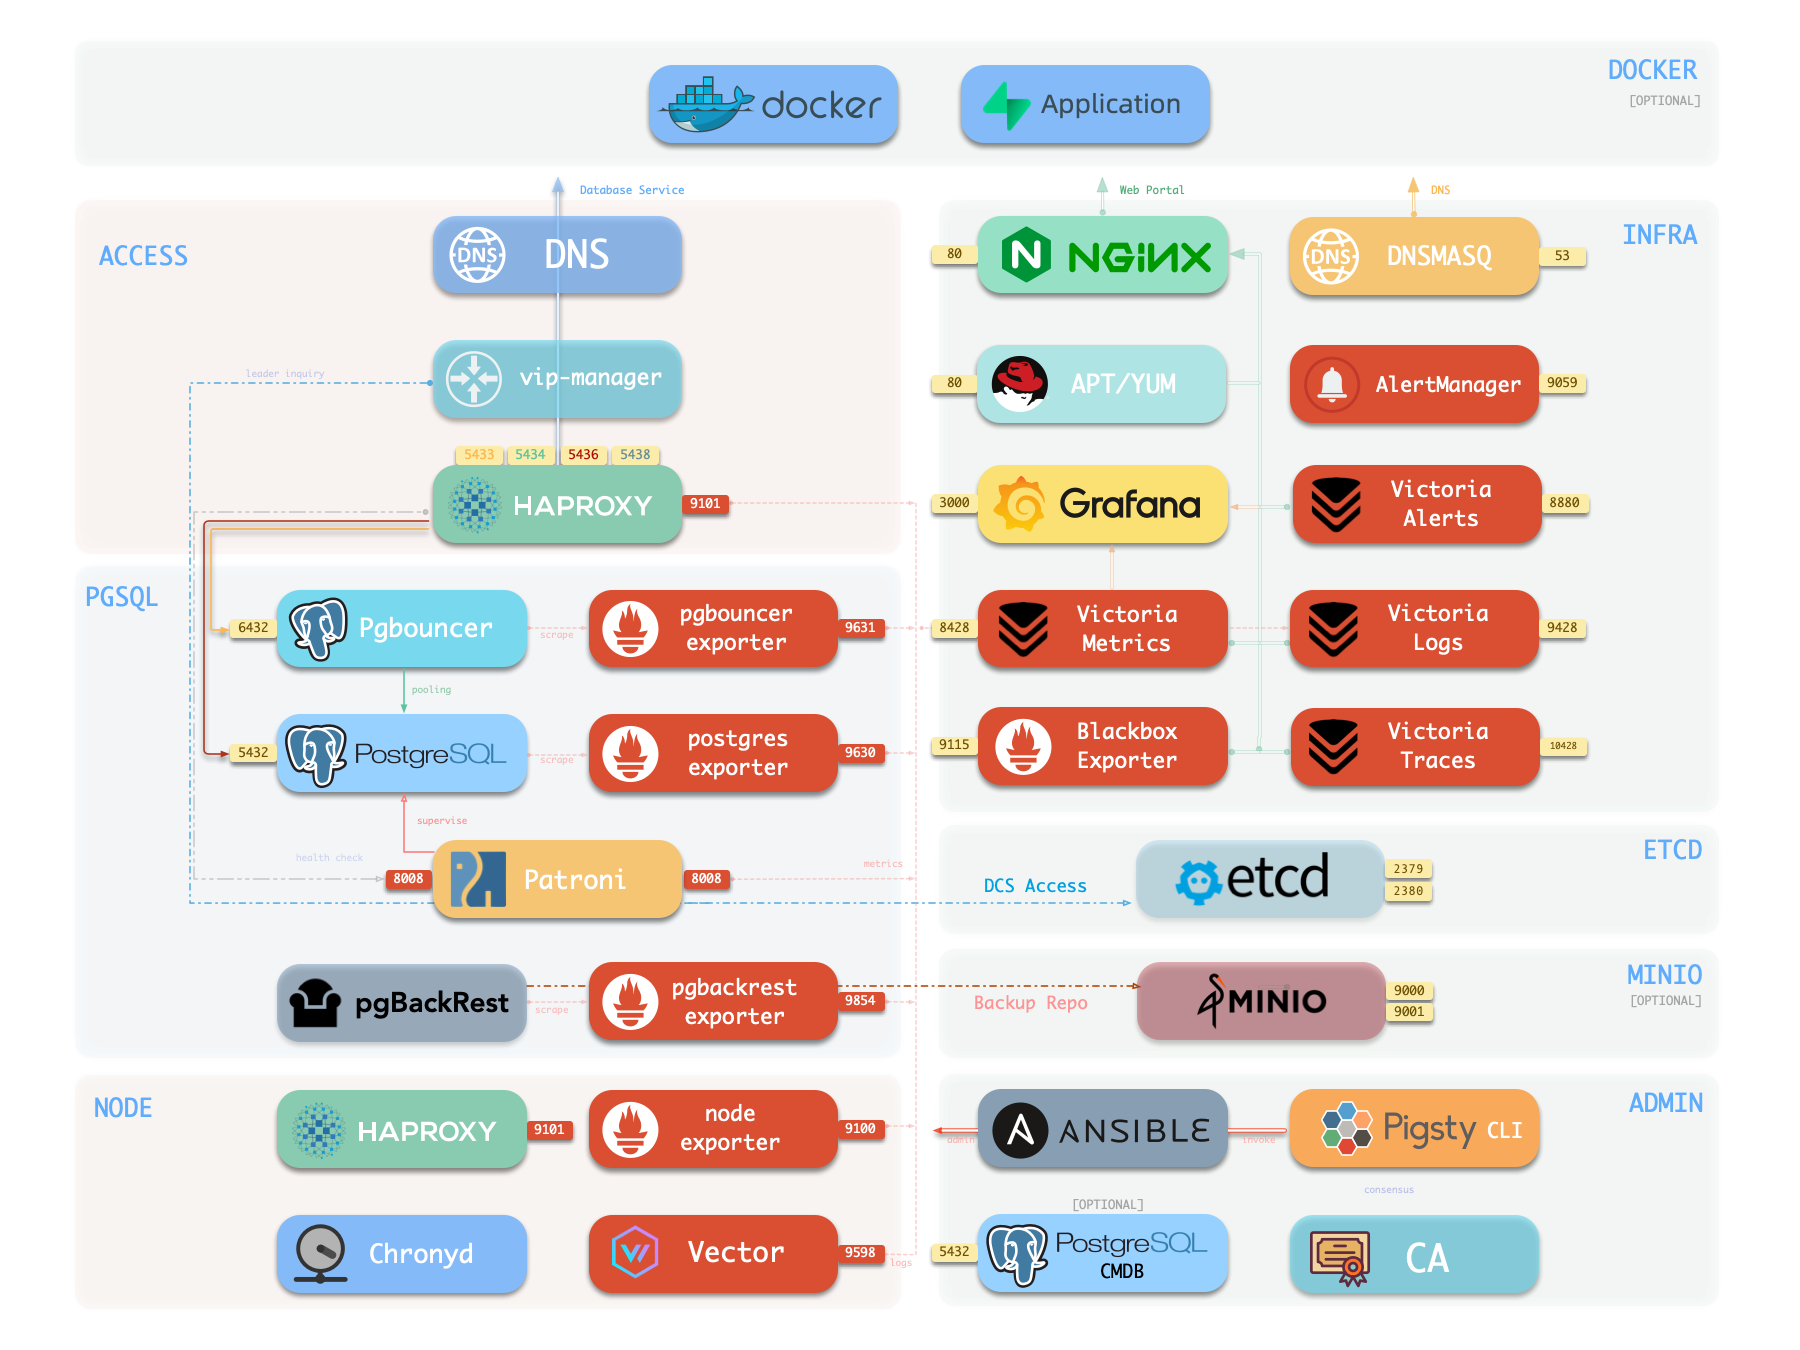
The diagram below shows the architecture of a single-node deployment. The right half represents the components included in the INFRA module:
| Component | Type | Description |
|---|---|---|
| Nginx | Web Server | Unified entry for WebUI, local repo, reverse proxy for internal services |
| Repo | Software Repo | APT/DNF repository with all RPM/DEB packages needed for deployment |
| Grafana | Visualization | Displays metrics, logs, and traces; hosts dashboards, reports, and custom data apps |
| VictoriaMetrics | Time Series DB | Scrapes all metrics, Prometheus API compatible, provides VMUI query interface |
| VictoriaLogs | Log Platform | Centralized log storage; all nodes run Vector by default, pushing logs here |
| VictoriaTraces | Tracing | Collects slow SQL, service traces, and other tracing data |
| VMAlert | Eval Rule/Alert | Evaluates alerting rules, pushes events to Alertmanager |
| AlertManager | Alert Manager | Aggregates alerts, dispatches notifications via email, Webhook, etc. |
| BlackboxExporter | Blackbox Probe | Probes reachability of IPs/VIPs/URLs |
| DNSMASQ | DNS Service | Provides DNS resolution for domains used within Pigsty [Optional] |
| Chronyd | Time Sync | Provides NTP time synchronization to ensure consistent time across nodes [Optional] |
| CA | Certificate | Issues encryption certificates within the environment |
| Ansible | Orchestration | Batch, declarative, agentless tool for managing large numbers of servers |
Nginx
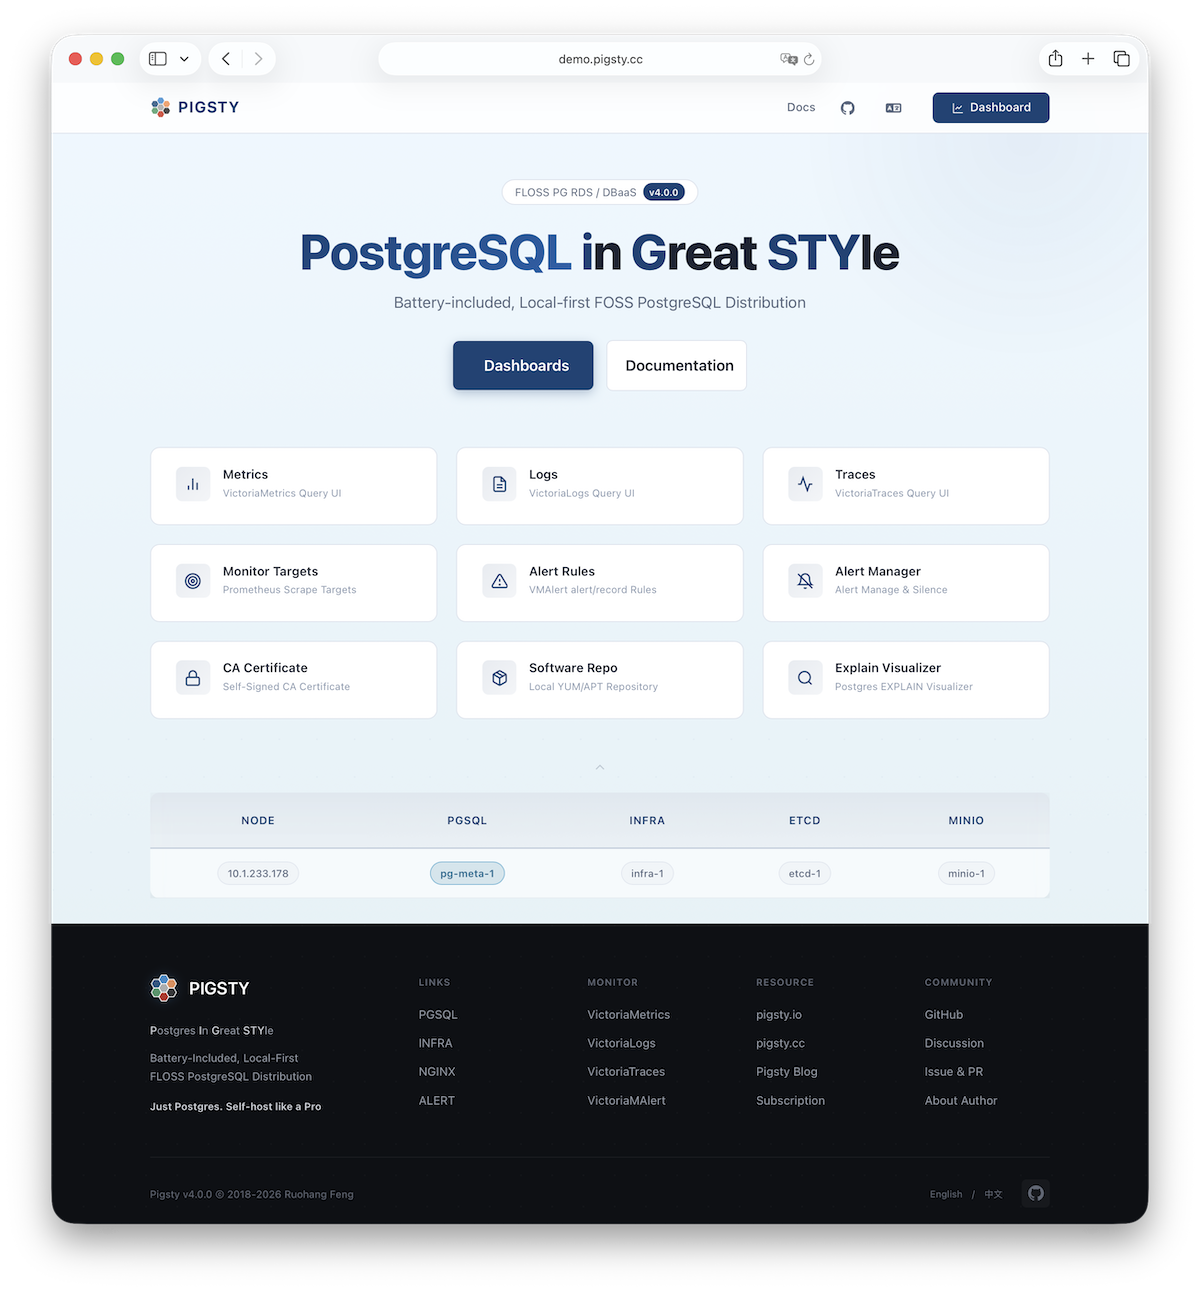
Nginx is the access entry point for all WebUI services in Pigsty, using ports 80 / 443 for HTTP/HTTPS by default. Live Demo
| IP Access (replace) | Domain (HTTP) | Domain (HTTPS) | Public Demo |
|---|---|---|---|
http://10.10.10.10 | http://i.pigsty | https://i.pigsty | https://demo.pigsty.io |
Infrastructure components with WebUIs can be exposed uniformly through Nginx, such as Grafana, VictoriaMetrics (VMUI), AlertManager, and HAProxy console. Additionally, the local software repository and other static resources are served via Nginx.
Nginx configures local web servers or reverse proxy servers based on definitions in infra_portal.
infra_portal:
  home : { domain: i.pigsty }
By default, it exposes Pigsty’s admin homepage: i.pigsty. Different endpoints on this page proxy different components:
| Endpoint | Component | Native Port | Notes | Public Demo |
|---|---|---|---|---|
/ | Nginx | 80/443 | Homepage, local repo, file server | demo.pigsty.io |
/ui/ | Grafana | 3000 | Grafana dashboard entry | demo.pigsty.io/ui/ |
/vmetrics/ | VictoriaMetrics | 8428 | Time series DB Web UI | demo.pigsty.io/vmetrics/ |
/vlogs/ | VictoriaLogs | 9428 | Log DB Web UI | demo.pigsty.io/vlogs/ |
/vtraces/ | VictoriaTraces | 10428 | Tracing Web UI | demo.pigsty.io/vtraces/ |
/vmalert/ | VMAlert | 8880 | Alert rule management | demo.pigsty.io/vmalert/ |
/alertmgr/ | AlertManager | 9059 | Alert management Web UI | demo.pigsty.io/alertmgr/ |
/blackbox/ | Blackbox | 9115 | Blackbox probe |
Pigsty allows rich customization of Nginx as a local file server or reverse proxy, with self-signed or real HTTPS certificates.
For more information, see: Tutorial: Nginx—Expose Web Services via Proxy and Tutorial: Certbot—Request and Renew HTTPS Certificates
Repo
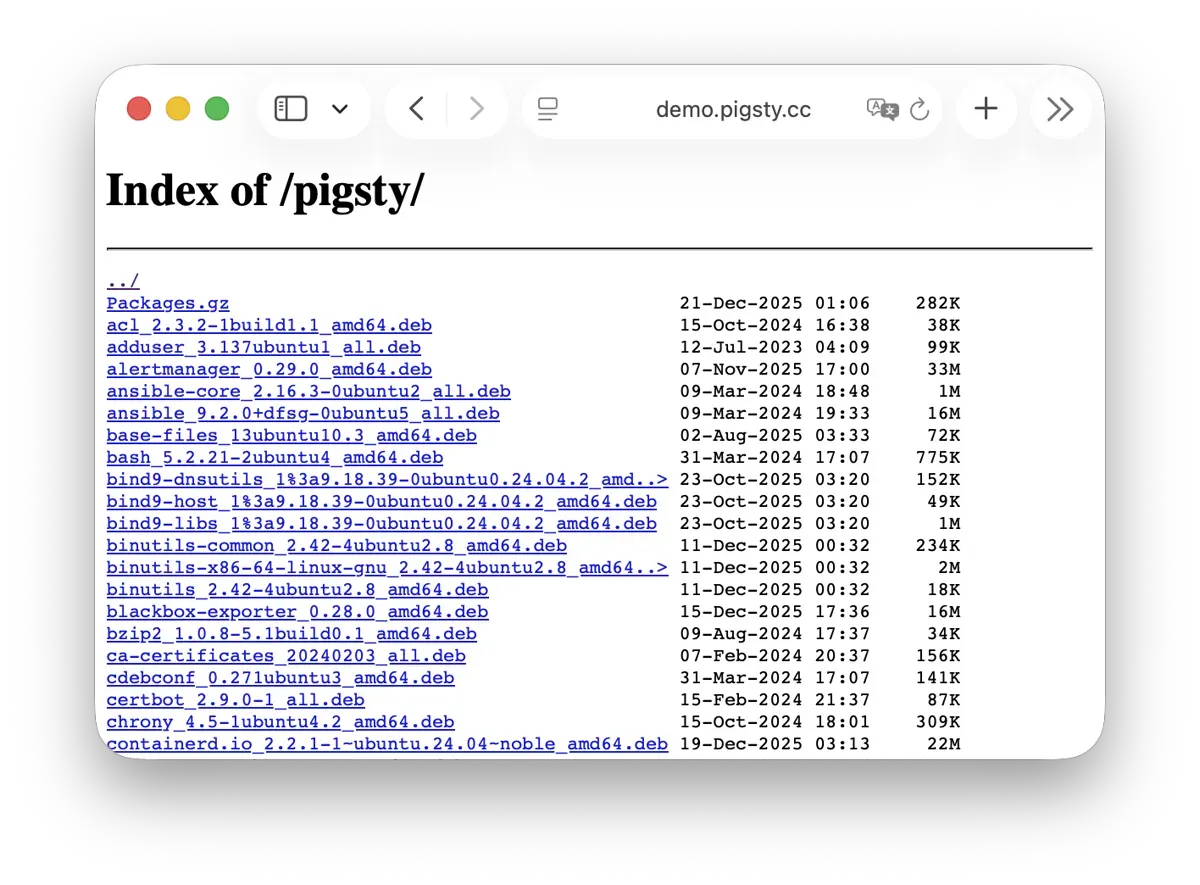
Pigsty creates a local software repository on the Infra node during installation to accelerate subsequent software installations. Live Demo
This repository defaults to the /www/pigsty directory,
served by Nginx and mounted at the /pigsty path:
| IP Access (replace) | Domain (HTTP) | Domain (HTTPS) | Public Demo |
|---|---|---|---|
http://10.10.10.10/pigsty | http://i.pigsty/pigsty | https://i.pigsty/pigsty | https://demo.pigsty.io/pigsty |
Pigsty supports offline installation, which essentially pre-copies a prepared local software repository to the target environment.
When Pigsty performs production deployment and needs to create a local software repository, if it finds the /www/pigsty/repo_complete marker file already exists locally, it skips downloading packages from upstream and uses existing packages directly, avoiding internet downloads.
For more information, see: Config: INFRA - REPO
Grafana
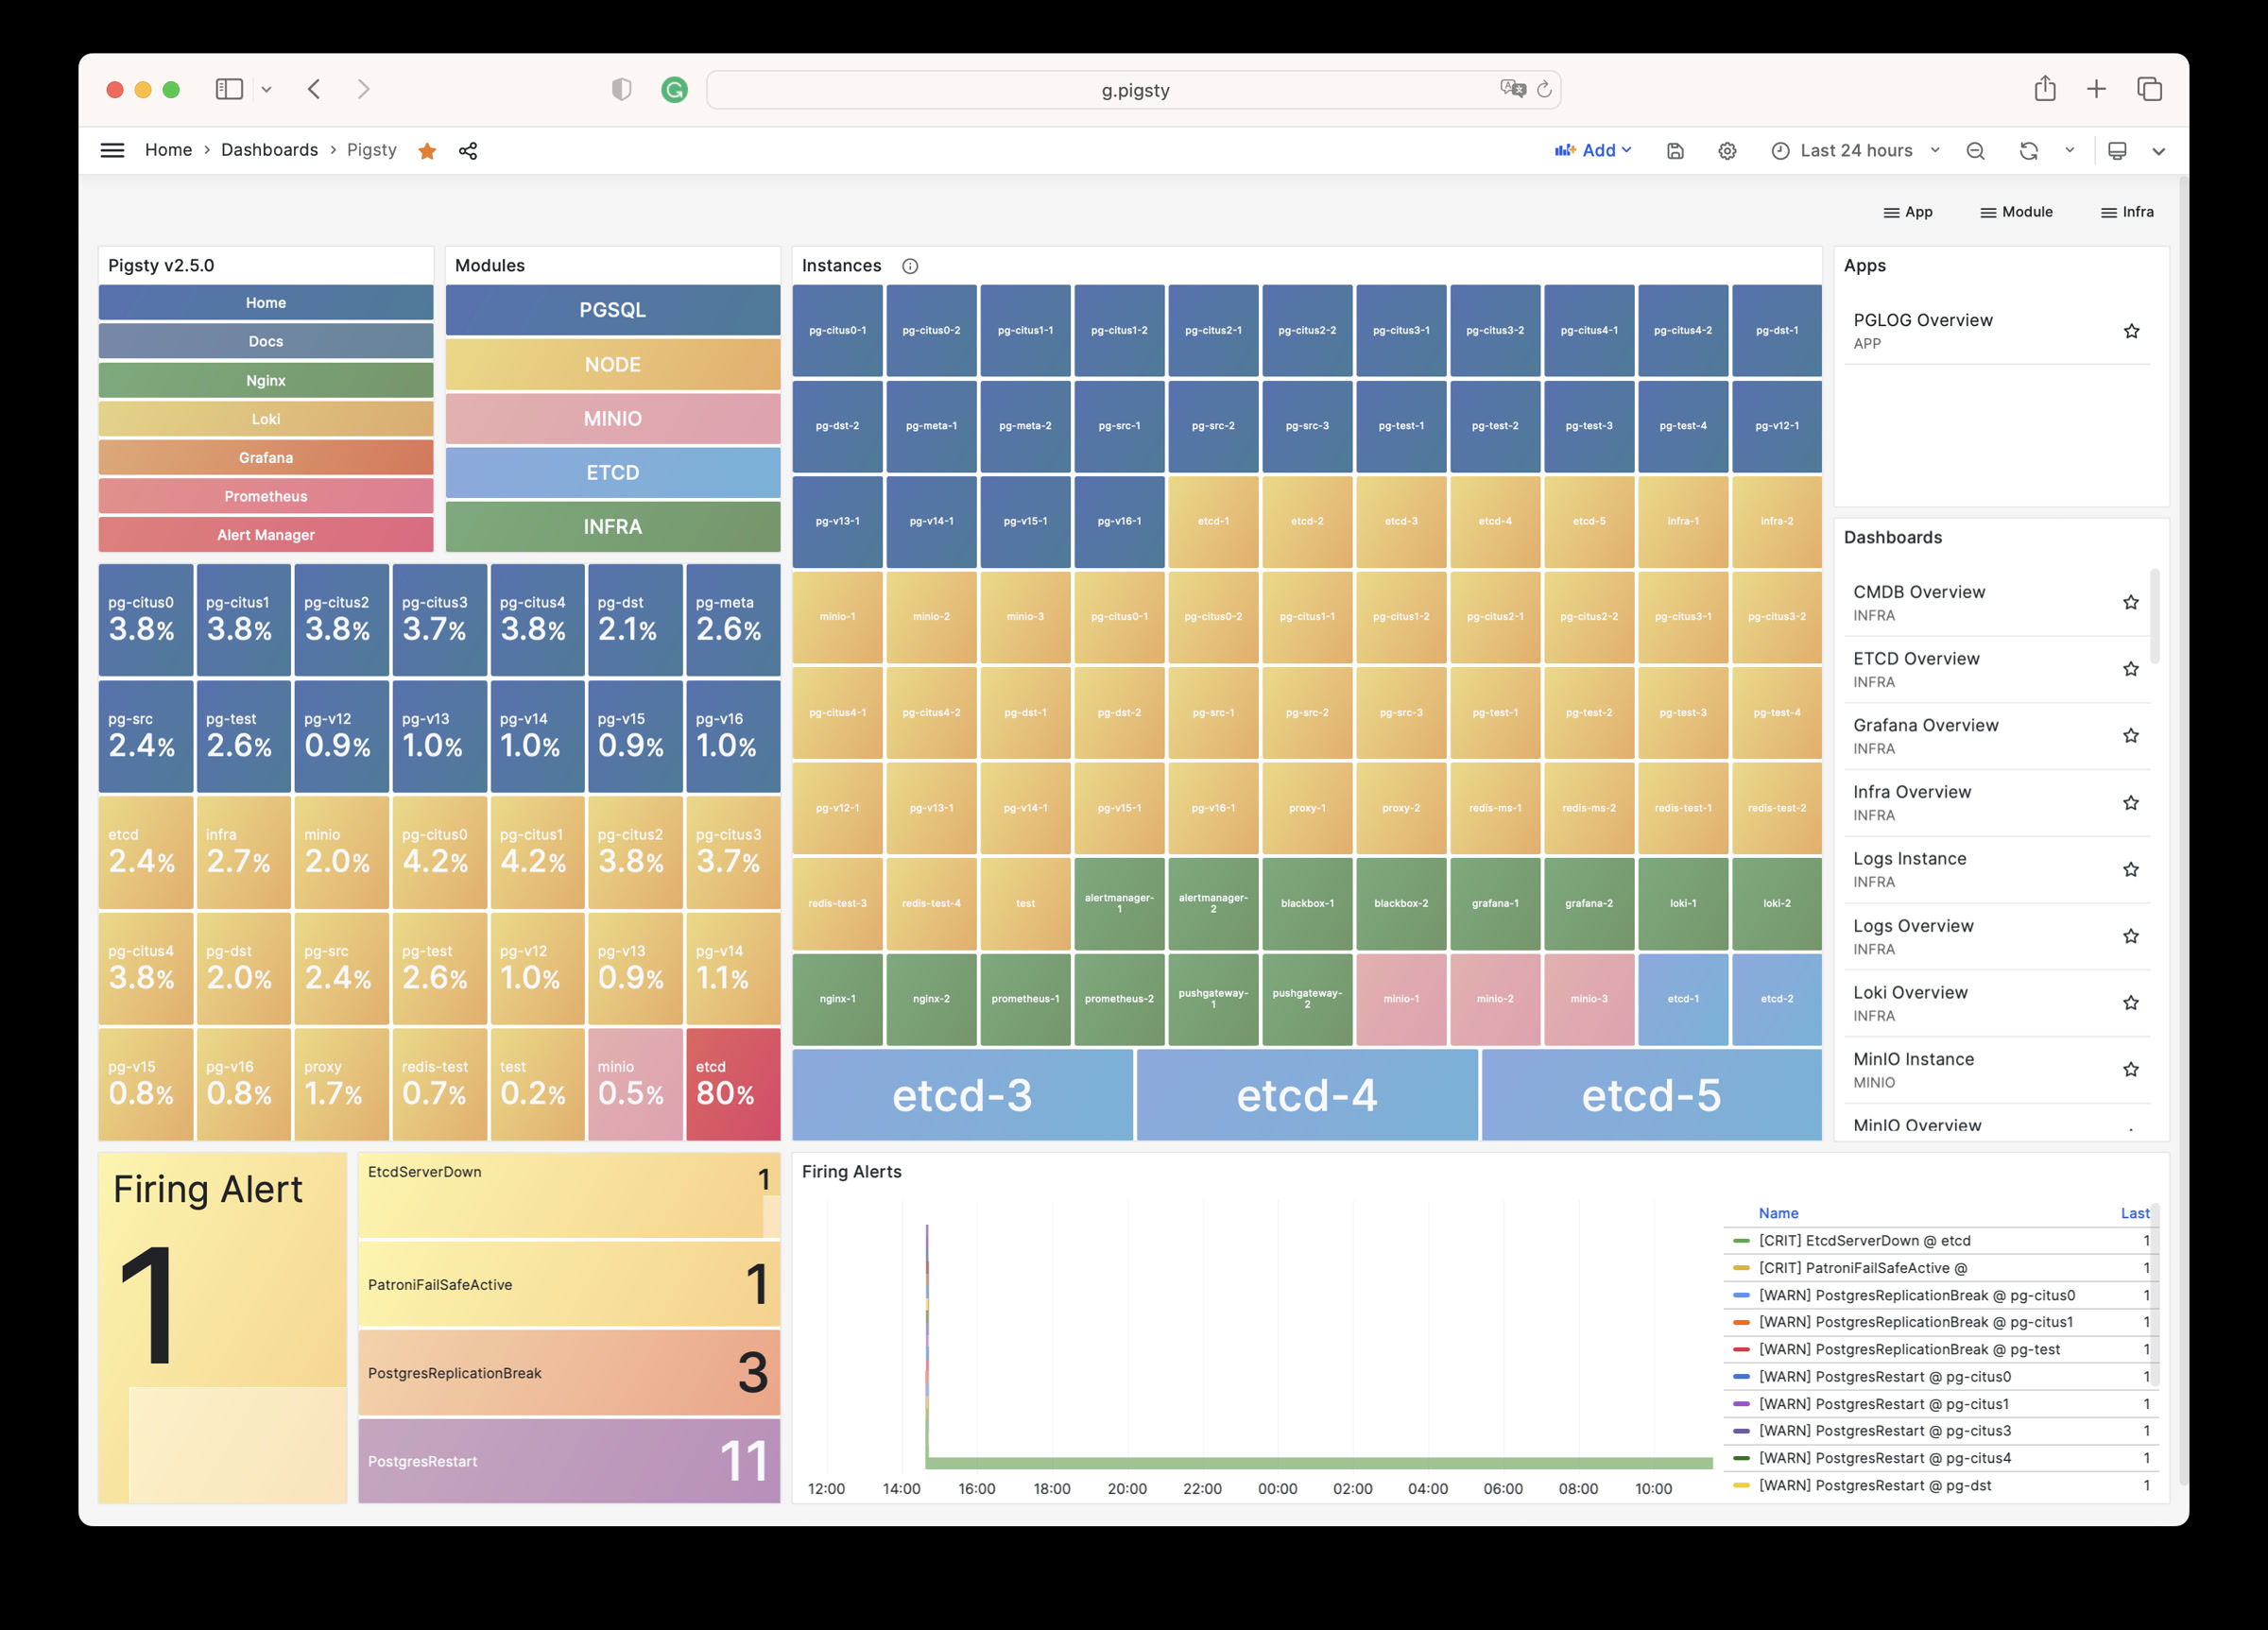
Grafana is the core component of Pigsty’s monitoring system, used for visualizing metrics, logs, and various information. Live Demo
Grafana listens on port 3000 by default and is proxied via Nginx at the /ui path:
| IP Access (replace) | Domain (HTTP) | Domain (HTTPS) | Public Demo |
|---|---|---|---|
http://10.10.10.10/ui | http://i.pigsty/ui | https://i.pigsty/ui | https://demo.pigsty.io/ui |
Pigsty provides pre-built dashboards based on VictoriaMetrics / Logs / Traces, with one-click drill-down and roll-up via URL jumps for rapid troubleshooting.
Grafana can also serve as a low-code visualization platform, so ECharts, victoriametrics-datasource, victorialogs-datasource plugins are installed by default,
with Vector / Victoria datasources registered uniformly as vmetrics-*, vlogs-*, vtraces-* for easy custom dashboard extension.
For more information, see: Config: INFRA - GRAFANA.
VictoriaMetrics
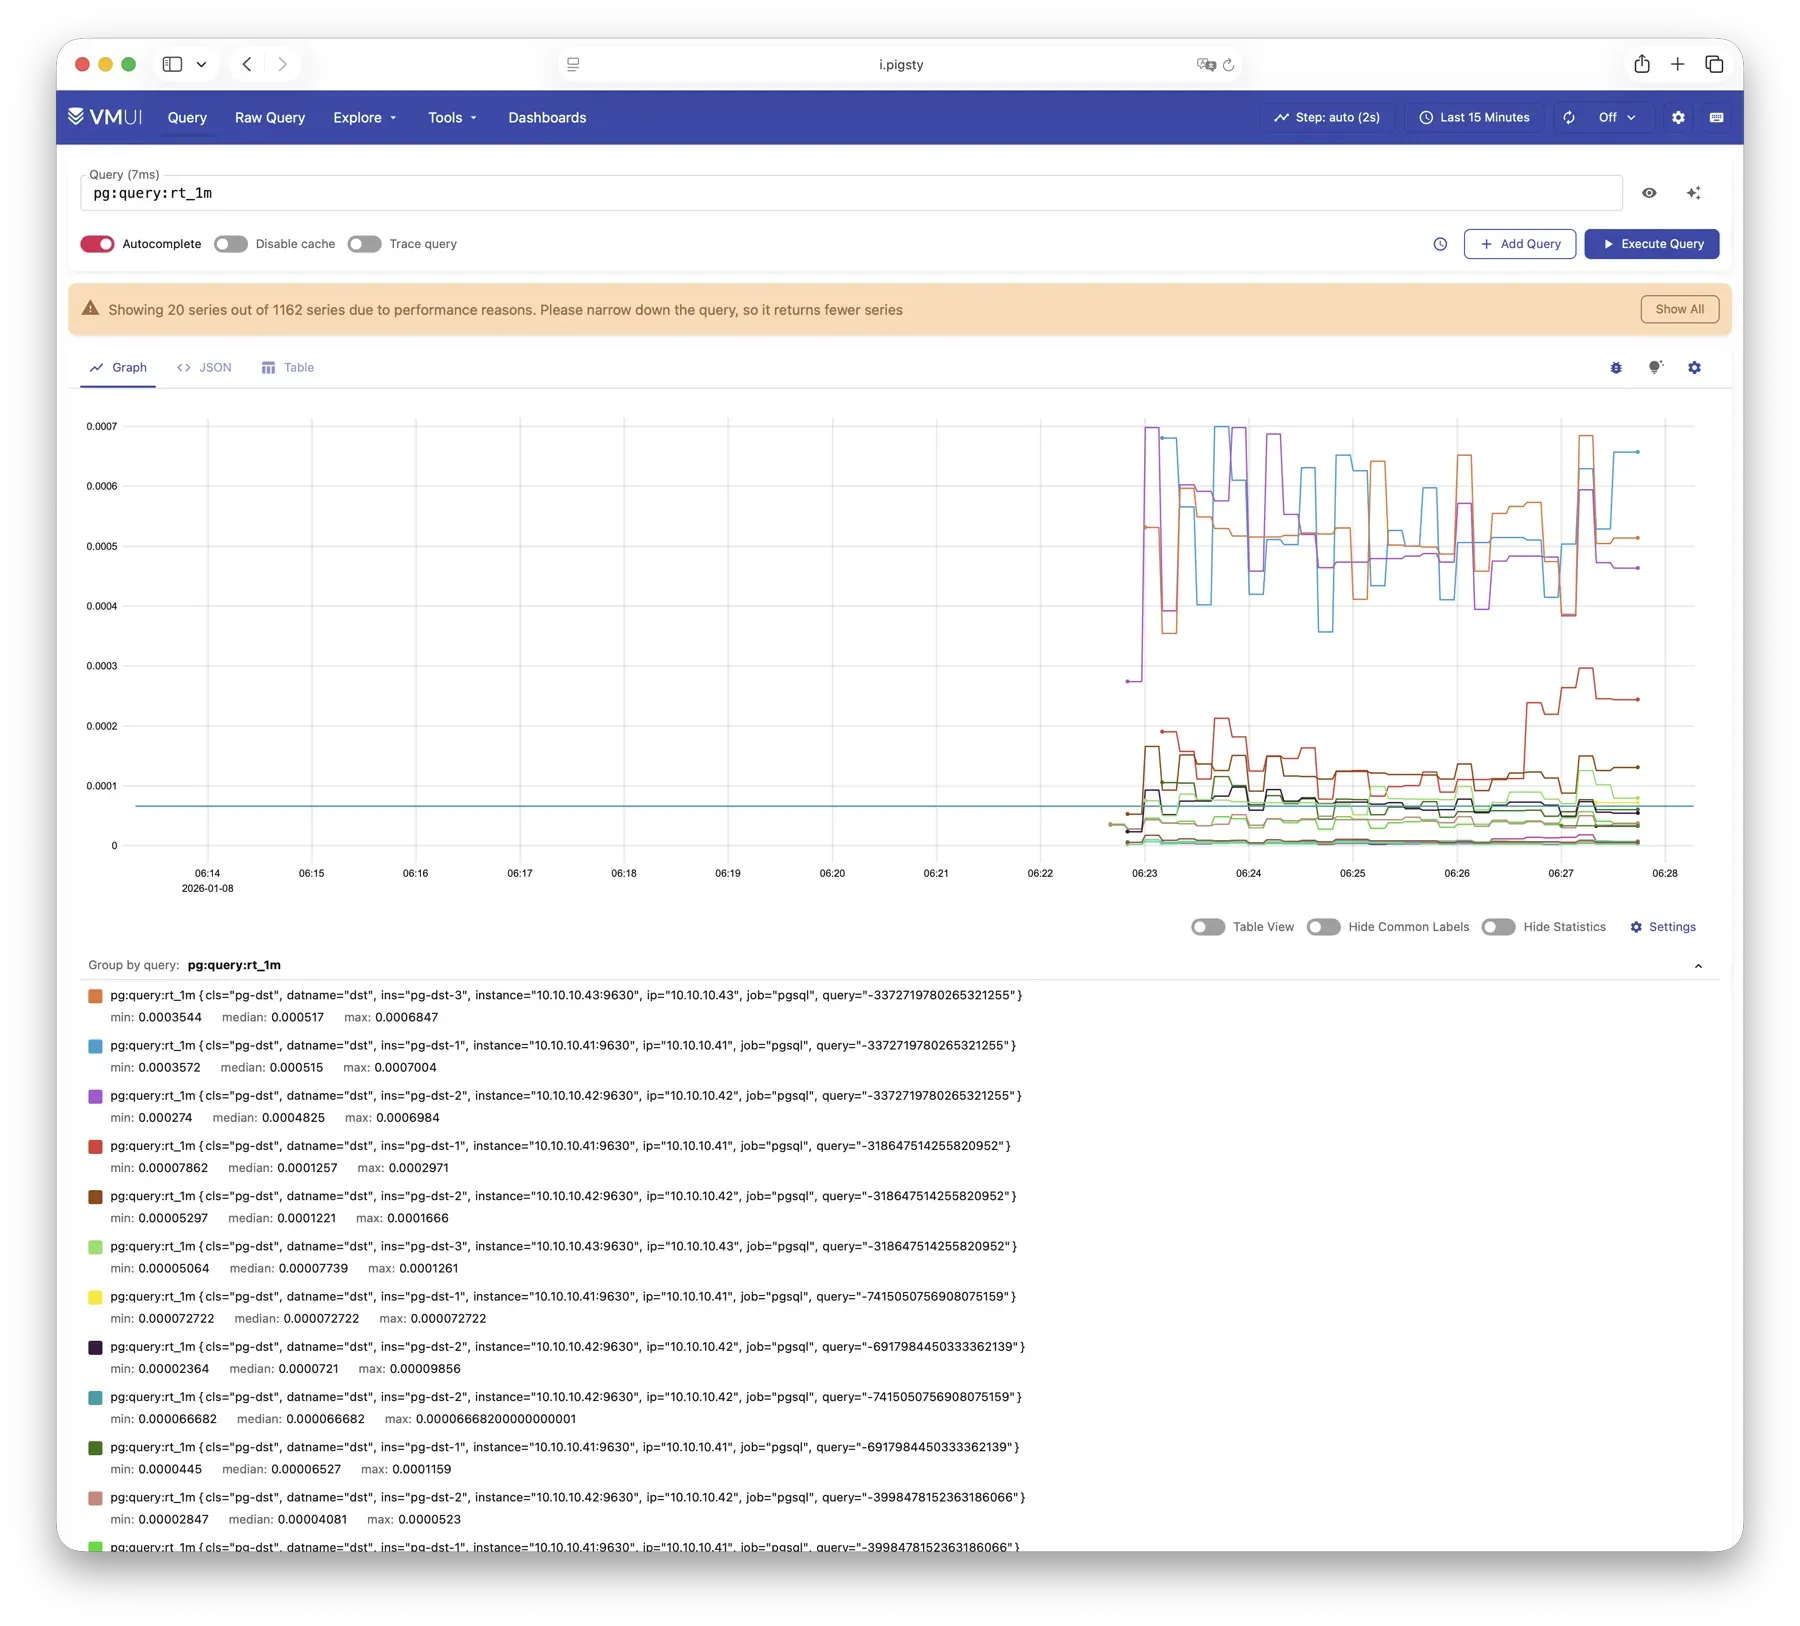
VictoriaMetrics is Pigsty’s time series database, responsible for scraping and storing all monitoring metrics. Live Demo
It listens on port 8428 by default, mounted at Nginx /vmetrics path, and also accessible via the p.pigsty domain:
| IP Access (replace) | Domain (HTTP) | Domain (HTTPS) | Public Demo |
|---|---|---|---|
http://10.10.10.10/vmetrics | http://p.pigsty | https://i.pigsty/vmetrics | https://demo.pigsty.io/vmetrics |
VictoriaMetrics is fully compatible with the Prometheus API, supporting PromQL queries, remote read/write protocols, and the Alertmanager API. The built-in VMUI provides an ad-hoc query interface for exploring metrics data directly, and also serves as a Grafana datasource.
For more information, see: Config: INFRA - VMETRICS
VictoriaLogs
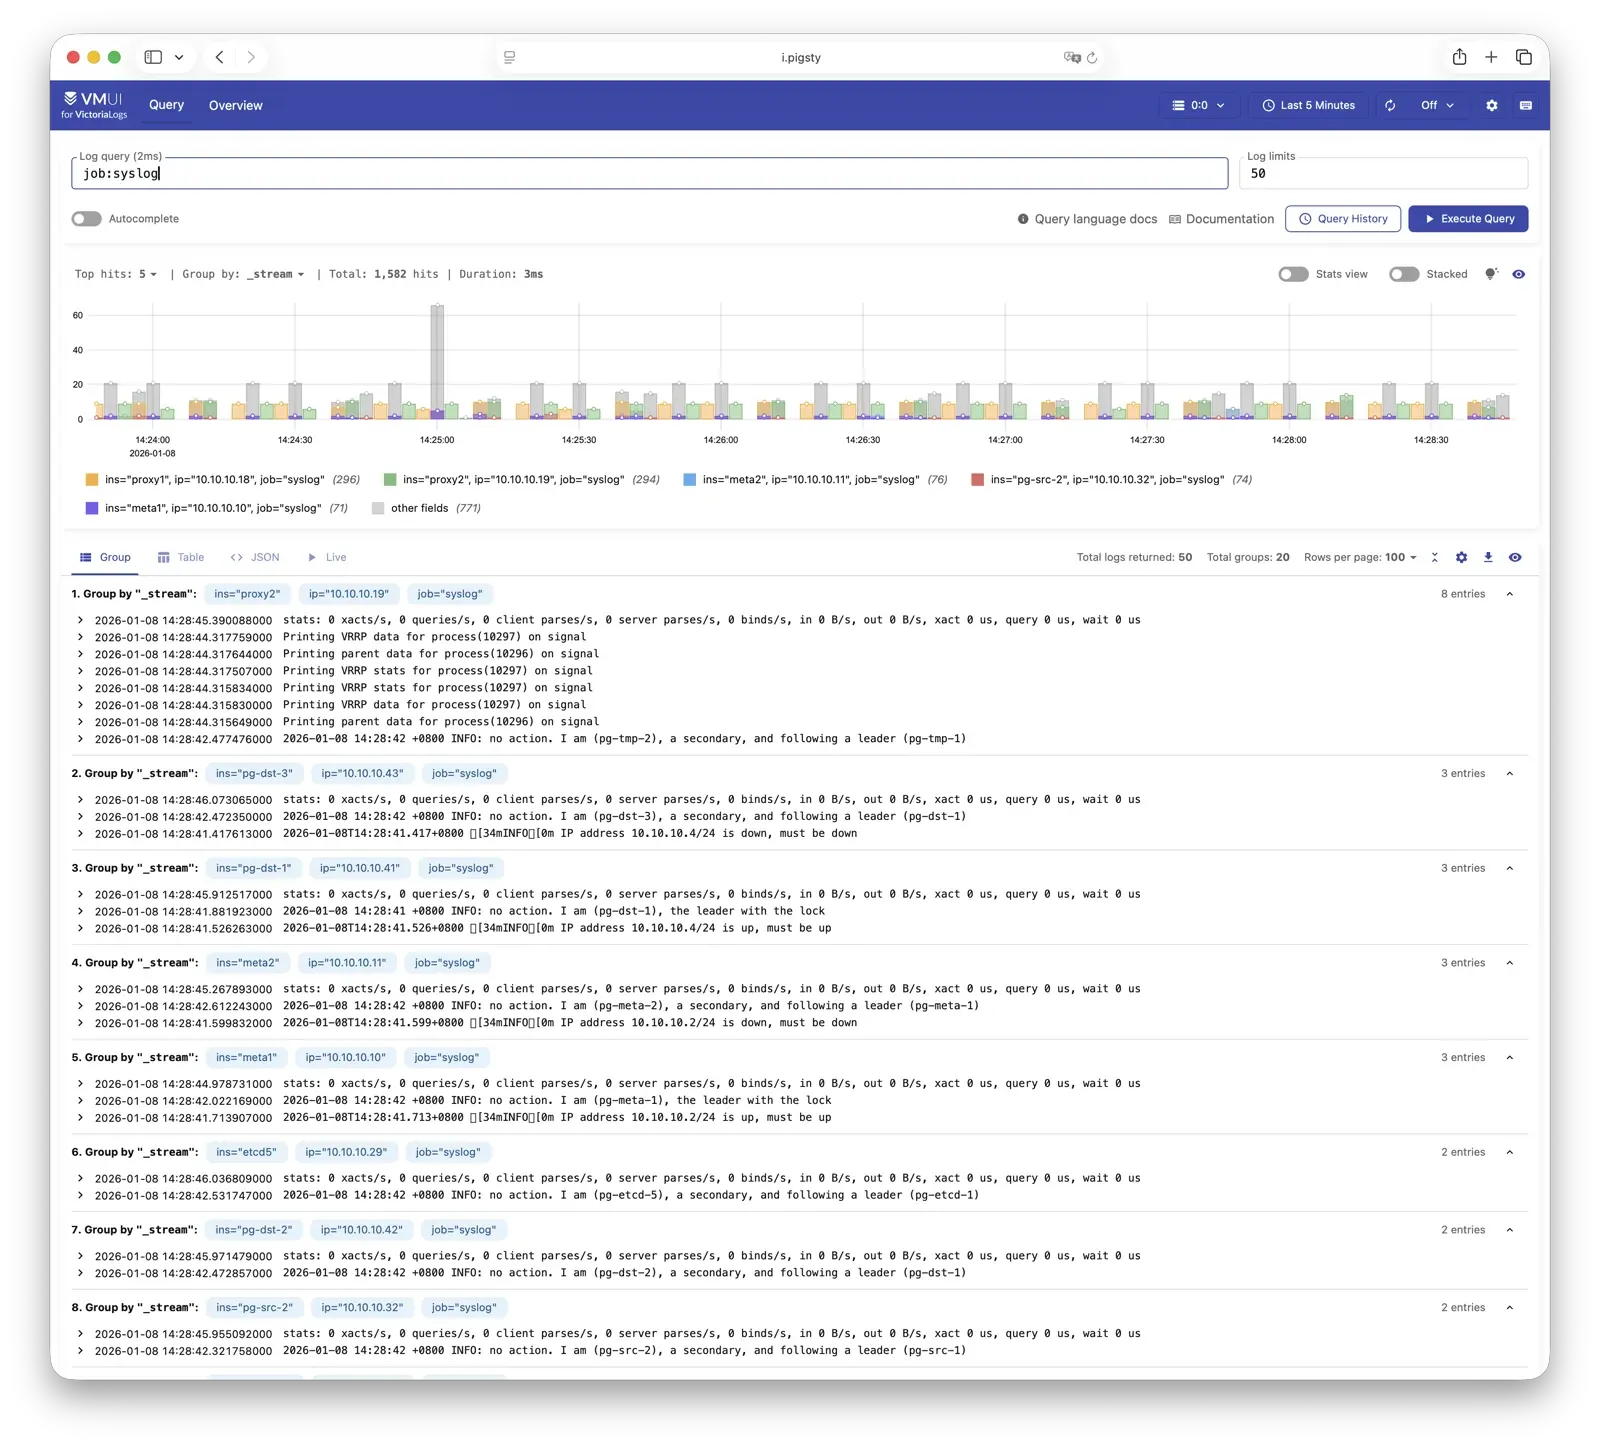
VictoriaLogs is Pigsty’s log platform, centrally storing structured logs from all nodes. Live Demo
It listens on port 9428 by default, mounted at Nginx /vlogs path:
| IP Access (replace) | Domain (HTTP) | Domain (HTTPS) | Public Demo |
|---|---|---|---|
http://10.10.10.10/vlogs | http://i.pigsty/vlogs | https://i.pigsty/vlogs | https://demo.pigsty.io/vlogs |
All managed nodes run Vector Agent by default, collecting system logs, PostgreSQL logs, Patroni logs, Pgbouncer logs, etc., processing them into structured format and pushing to VictoriaLogs. The built-in Web UI supports log search and filtering, and can be integrated with Grafana’s victorialogs-datasource plugin for visual analysis.
For more information, see: Config: INFRA - VLOGS
VictoriaTraces
VictoriaTraces is used for collecting trace data and slow SQL records. Live Demo
It listens on port 10428 by default, mounted at Nginx /vtraces path:
| IP Access (replace) | Domain (HTTP) | Domain (HTTPS) | Public Demo |
|---|---|---|---|
http://10.10.10.10/vtraces | http://i.pigsty/vtraces | https://i.pigsty/vtraces | https://demo.pigsty.io/vtraces |
VictoriaTraces provides a Jaeger-compatible interface for analyzing service call chains and database slow queries. Combined with Grafana dashboards, it enables rapid identification of performance bottlenecks and root cause tracing.
For more information, see: Config: INFRA - VTRACES
VMAlert
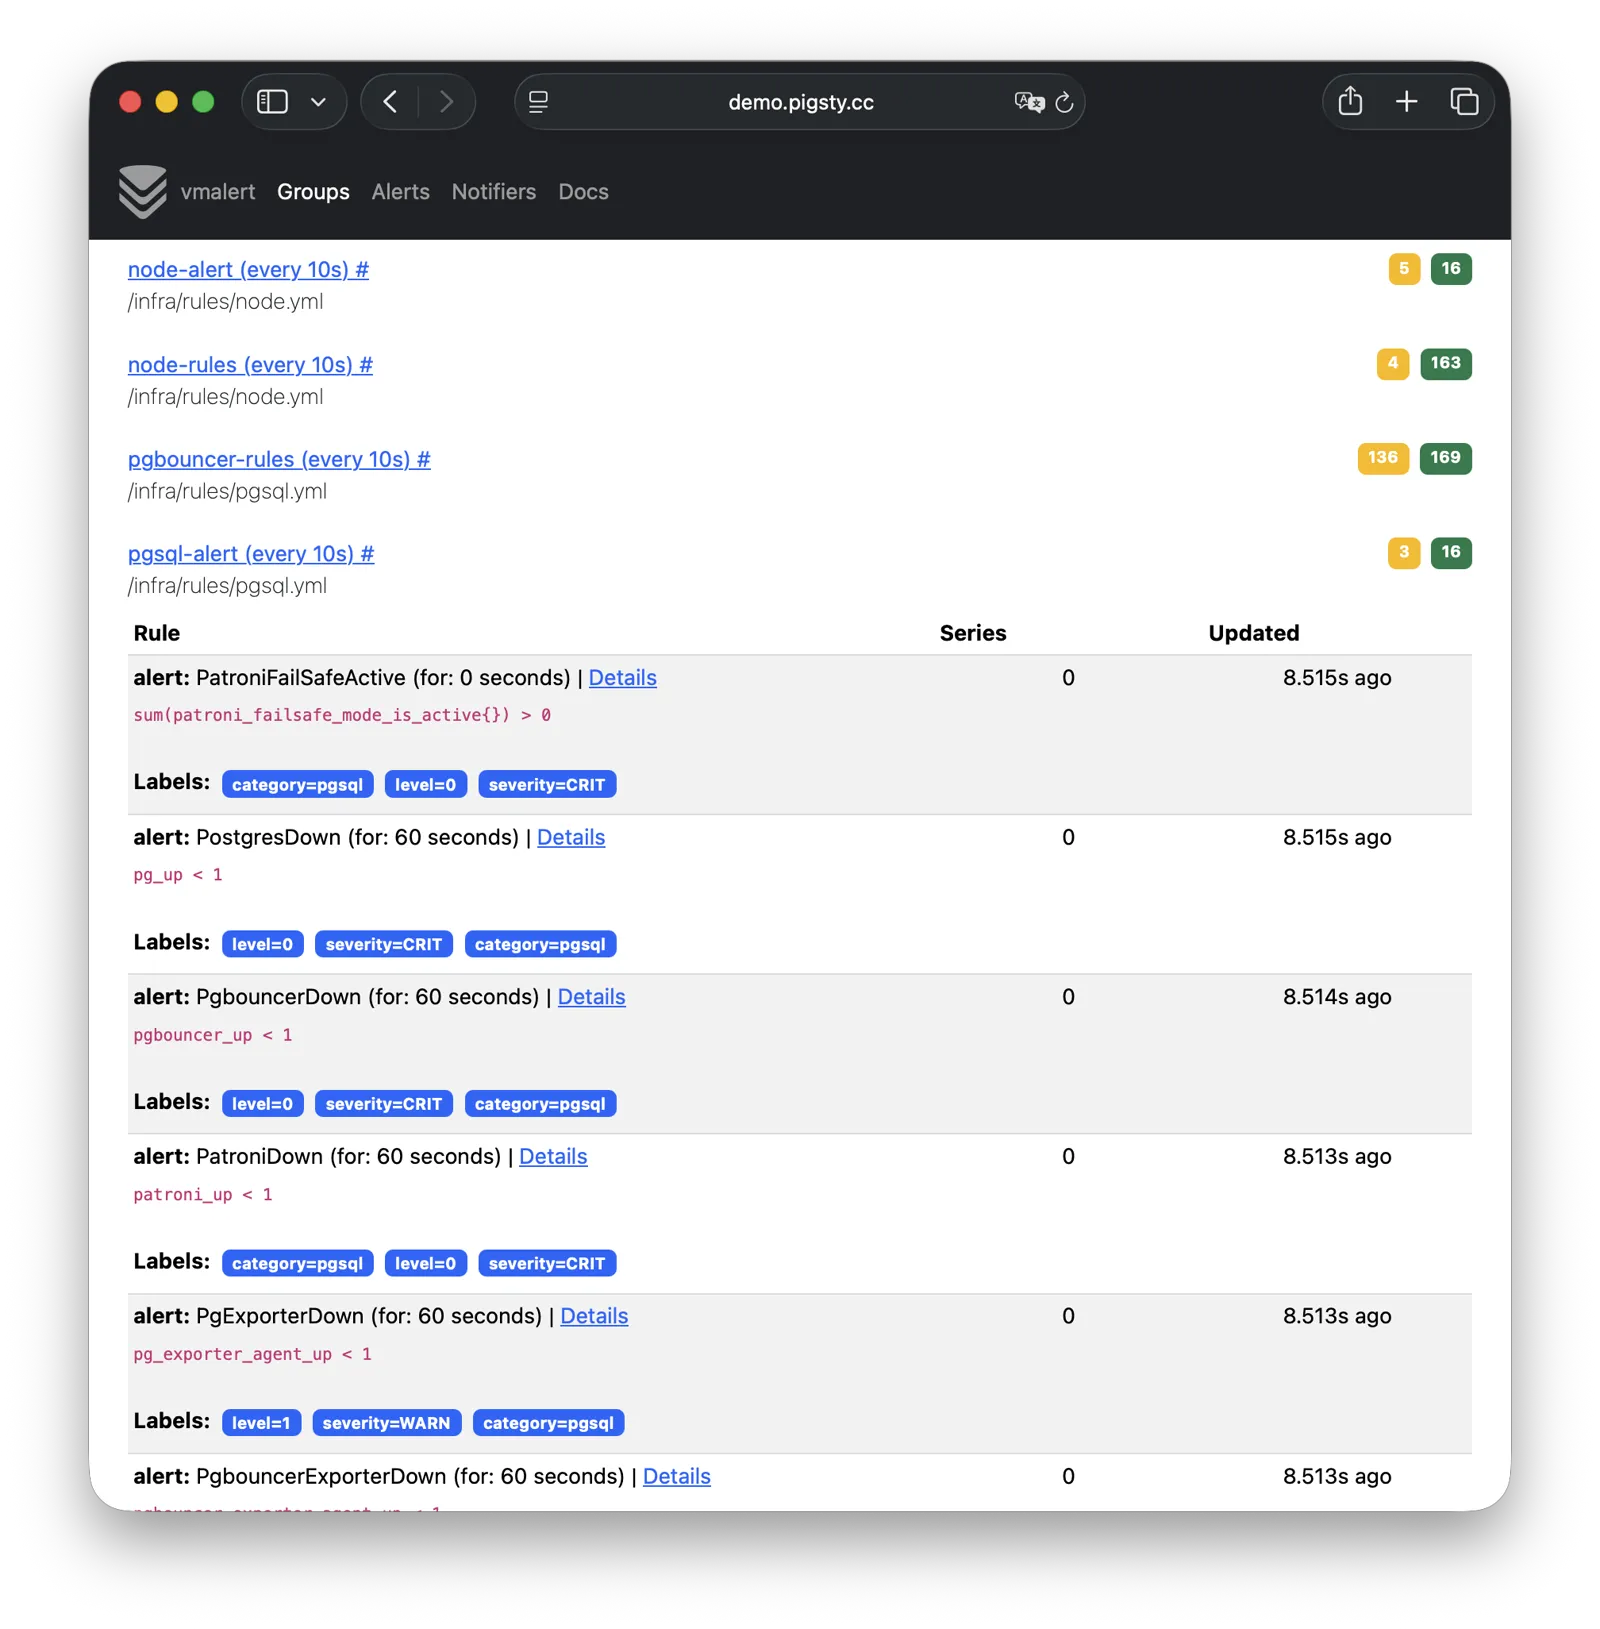
VMAlert is the alerting rule computation engine, responsible for evaluating alert rules and pushing triggered events to Alertmanager. Live Demo
It listens on port 8880 by default, mounted at Nginx /vmalert path:
| IP Access (replace) | Domain (HTTP) | Domain (HTTPS) | Public Demo |
|---|---|---|---|
http://10.10.10.10/vmalert | http://i.pigsty/vmalert | https://i.pigsty/vmalert | https://demo.pigsty.io/vmalert |
VMAlert reads metrics data from VictoriaMetrics and periodically evaluates alerting rules. Pigsty provides pre-built alerting rules for PGSQL, NODE, REDIS, and other modules, covering common failure scenarios out of the box.
For more information, see: Config: INFRA - VMALERT
AlertManager
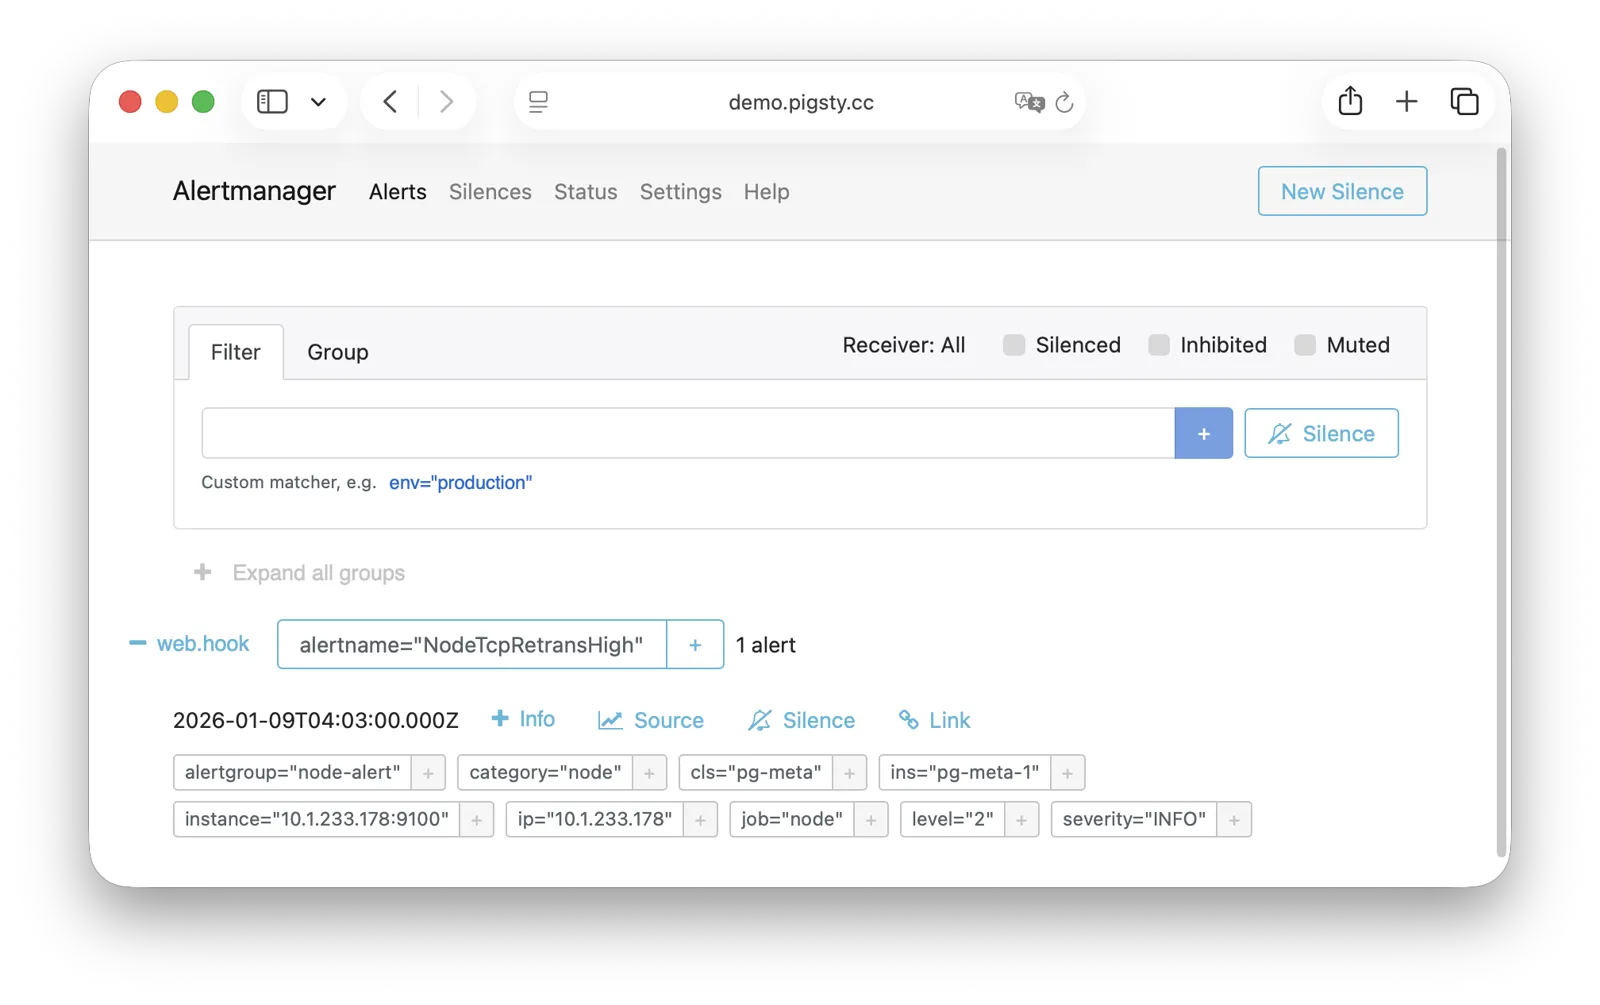
AlertManager handles alert event aggregation, deduplication, grouping, and dispatch. Live Demo
It listens on port 9059 by default, mounted at Nginx /alertmgr path, and also accessible via the a.pigsty domain:
| IP Access (replace) | Domain (HTTP) | Domain (HTTPS) | Public Demo |
|---|---|---|---|
http://10.10.10.10/alertmgr | http://a.pigsty | https://i.pigsty/alertmgr | https://demo.pigsty.io/alertmgr |
AlertManager supports multiple notification channels: email, Webhook, Slack, PagerDuty, WeChat Work, etc. Through alert routing rules, differentiated dispatch based on severity level and module type is possible, with support for silencing, inhibition, and other advanced features.
For more information, see: Config: INFRA - AlertManager
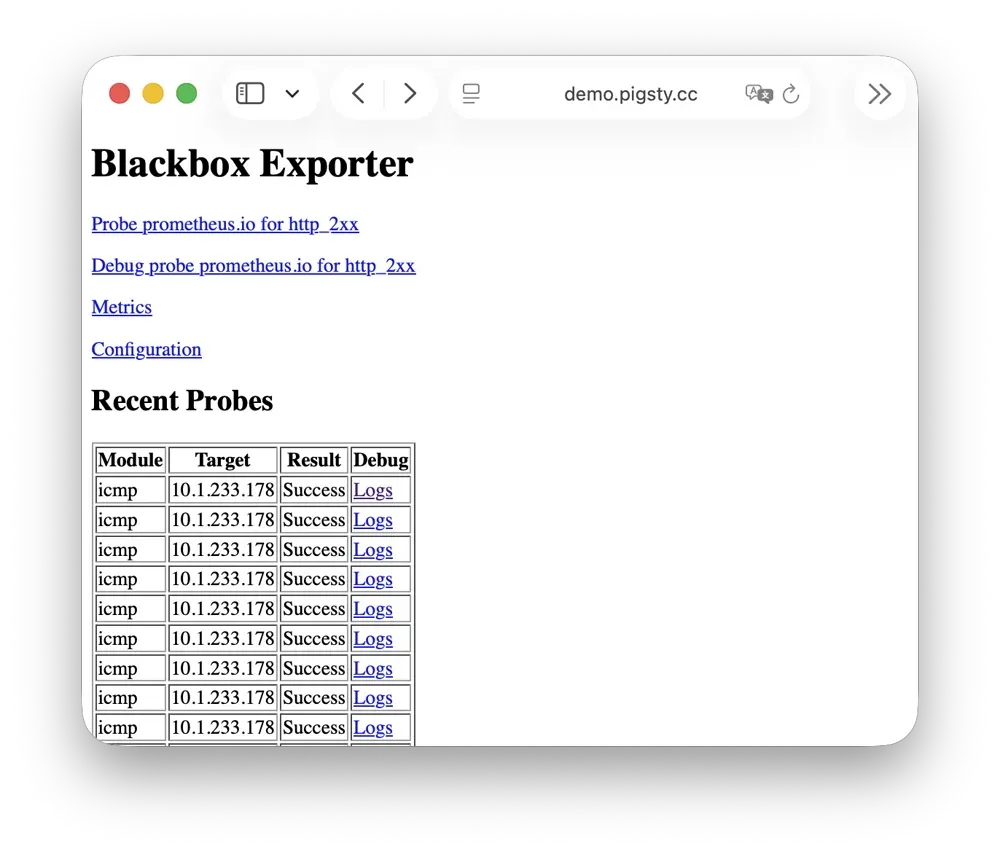
BlackboxExporter
Blackbox Exporter is used for active probing of target reachability, enabling blackbox monitoring.
It listens on port 9115 by default, mounted at Nginx /blackbox path:
| IP Access (replace) | Domain (HTTP) | Domain (HTTPS) | Public Demo |
|---|---|---|---|
http://10.10.10.10/blackbox | http://i.pigsty/blackbox | https://i.pigsty/blackbox | https://demo.pigsty.io/blackbox |
It supports multiple probe methods including ICMP Ping, TCP ports, and HTTP/HTTPS endpoints. Useful for monitoring VIP reachability, service port availability, external dependency health, etc.—an important tool for assessing failure impact scope.
For more information, see: Config: INFRA - BLACKBOX
Ansible
Ansible is Pigsty’s core orchestration tool; all deployment, configuration, and management operations are performed through Ansible Playbooks.
Pigsty automatically installs Ansible on the admin node (Infra node) during installation. It adopts a declarative configuration style and idempotent playbook design: the same playbook can be run repeatedly, and the system automatically converges to the desired state without side effects.
Ansible’s core advantages:
- Agentless: Executes remotely via SSH, no additional software needed on target nodes.
- Declarative: Describes the desired state rather than execution steps; configuration is documentation.
- Idempotent: Multiple executions produce consistent results; supports retry after partial failures.
For more information, see: Playbooks: Pigsty Playbook
DNSMASQ
DNSMASQ provides DNS resolution on INFRA nodes, resolving domain names to their corresponding IP addresses.
DNSMASQ listens on port 53 (UDP/TCP) by default, providing DNS resolution for all nodes. Records are stored in the /infra/hosts directory.
Other modules automatically register their domain names with DNSMASQ during deployment, which you can use as needed. DNS is completely optional—Pigsty works normally without it. Client nodes can configure INFRA nodes as their DNS servers, allowing access to services via domain names without remembering IP addresses.
dns_records: Default DNS records written to INFRA nodesnode_dns_servers: Configure DNS servers for nodes, defaults to INFRA node viaadmin_ip(can also be disabled)
For more information, see: Config: INFRA - DNS and Tutorial: DNS—Configure Domain Resolution
Chronyd
Chronyd provides NTP time synchronization, ensuring consistent clocks across all nodes. It listens on port 123 (UDP) by default as the time source.
Time synchronization is critical for distributed systems: log analysis requires aligned timestamps, certificate validation depends on accurate clocks, and PostgreSQL streaming replication is sensitive to clock drift. In isolated network environments, the INFRA node can serve as an internal NTP server with other nodes synchronizing to it.
In Pigsty, all nodes run chronyd by default for time sync. The default upstream is pool.ntp.org public NTP servers.
Chronyd is essentially managed by the Node module, but in isolated networks, you can use admin_ip to point to the INFRA node’s Chronyd service as the internal time source.
In this case, the Chronyd service on the INFRA node serves as the internal time synchronization infrastructure.
For more information, see: Config: NODE - TIME
INFRA Node vs Regular Node
In Pigsty, the relationship between nodes and infrastructure is a weak circular dependency: node_monitor → infra → node
The NODE module itself doesn’t depend on the INFRA module, but the monitoring functionality (node_monitor) requires the monitoring platform and services provided by the infrastructure module.
Therefore, in the infra.yml and deploy playbooks, an “interleaved deployment” technique is used:
- First, initialize the NODE module on all regular nodes, but skip monitoring config since infrastructure isn’t deployed yet.
- Then, initialize the INFRA module on the INFRA node—monitoring is now available.
- Finally, reconfigure monitoring on all regular nodes, connecting to the now-deployed monitoring platform.
If you don’t need “one-shot” deployment of all nodes, you can use phased deployment: initialize INFRA nodes first, then regular nodes.
How Are Nodes Coupled to Infrastructure?
Regular nodes reference an INFRA node via the admin_ip parameter as their infrastructure provider.
For example, when you configure global admin_ip = 10.10.10.10, all nodes will typically use infrastructure services at this IP.
This design allows quick, batch switching of infrastructure providers. Parameters that may reference ${admin_ip}:
| Parameter | Module | Default Value | Description |
|---|---|---|---|
repo_endpoint | INFRA | http://${admin_ip}:80 | Software repo URL |
repo_upstream.baseurl | INFRA | http://${admin_ip}/pigsty | Local repo baseurl |
infra_portal.endpoint | INFRA | ${admin_ip}:<port> | Nginx proxy backend |
dns_records | INFRA | ["${admin_ip} i.pigsty", ...] | DNS records |
node_default_etc_hosts | NODE | ["${admin_ip} i.pigsty"] | Default static DNS |
node_etc_hosts | NODE | [] | Custom static DNS |
node_dns_servers | NODE | ["${admin_ip}"] | Dynamic DNS servers |
node_ntp_servers | NODE | ["pool pool.ntp.org iburst"] | NTP servers (optional) |
For example, when a node installs software, the local repo points to the Nginx local software repository at admin_ip:80/pigsty. The DNS server also points to DNSMASQ at admin_ip:53.
However, this isn’t mandatory—nodes can ignore the local repo and install directly from upstream internet sources (most single-node config templates); DNS servers can also remain unconfigured, as Pigsty has no DNS dependency.
INFRA Node vs ADMIN Node
The management-initiating ADMIN node typically coincides with the INFRA node.
In single-node deployment, this is exactly the case. In multi-node deployment with multiple INFRA nodes, the admin node is usually the first in the infra group; others serve as backups.
However, exceptions exist. You might separate them for various reasons:
For example, in large-scale production deployments, a classic pattern uses 1-2 dedicated management hosts (tiny VMs suffice) belonging to the DBA team as the control hub, with 2-3 high-spec physical machines (or more!) as monitoring infrastructure. Here, admin nodes are separate from infrastructure nodes. In this case, the admin_ip in your config should point to an INFRA node’s IP, not the current ADMIN node’s IP. This is for historical reasons: initially ADMIN and INFRA nodes were tightly coupled concepts, with separation capabilities evolving later, so the parameter name wasn’t changed.
Another common scenario is managing cloud nodes locally. For example, you can install Ansible on your laptop and specify cloud nodes as “managed targets.” In this case, your laptop acts as the ADMIN node, while cloud servers act as INFRA nodes.
all:
  children:
    infra:   { hosts: { 10.10.10.10: { infra_seq: 1 , ansible_host: your_ssh_alias } } }  # <--- Use ansible_host to point to cloud node (fill in ssh alias)
    etcd:    { hosts: { 10.10.10.10: { etcd_seq: 1 } }, vars: { etcd_cluster: etcd } }    # SSH connection will use: ssh your_ssh_alias
    pg-meta: { hosts: { 10.10.10.10: { pg_seq: 1, pg_role: primary } }, vars: { pg_cluster: pg-meta } }
  vars:
    version: v4.2.2
    admin_ip: 10.10.10.10
    region: default
Multiple INFRA Nodes
By default, Pigsty only needs one INFRA node for most requirements. Even if the INFRA module goes down, it won’t affect database services on other nodes.
However, in production environments with high monitoring and alerting requirements, you may want multiple INFRA nodes to improve infrastructure availability. A common deployment uses two Infra nodes for redundancy, monitoring each other… or more nodes to deploy a distributed Victoria cluster for unlimited horizontal scaling.
Each Infra node is independent—Nginx points to services on the local machine. VictoriaMetrics independently scrapes metrics from all services in the environment, and logs are pushed to all VictoriaLogs collection endpoints by default. The only exception is Grafana: every Grafana instance registers all VictoriaMetrics / Logs / Traces / PostgreSQL instances as datasources. Therefore, each Grafana instance can see complete monitoring data.
If you modify Grafana—such as adding new dashboards or changing datasource configs—these changes only affect the Grafana instance on that node. To keep Grafana consistent across all nodes, use a PostgreSQL database as shared storage. See Tutorial: Configure Grafana High Availability for details.
Feedback
Was this page helpful?
Thanks for the feedback! Please let us know how we can improve.
Sorry to hear that. Please let us know how we can improve.