Dashboards
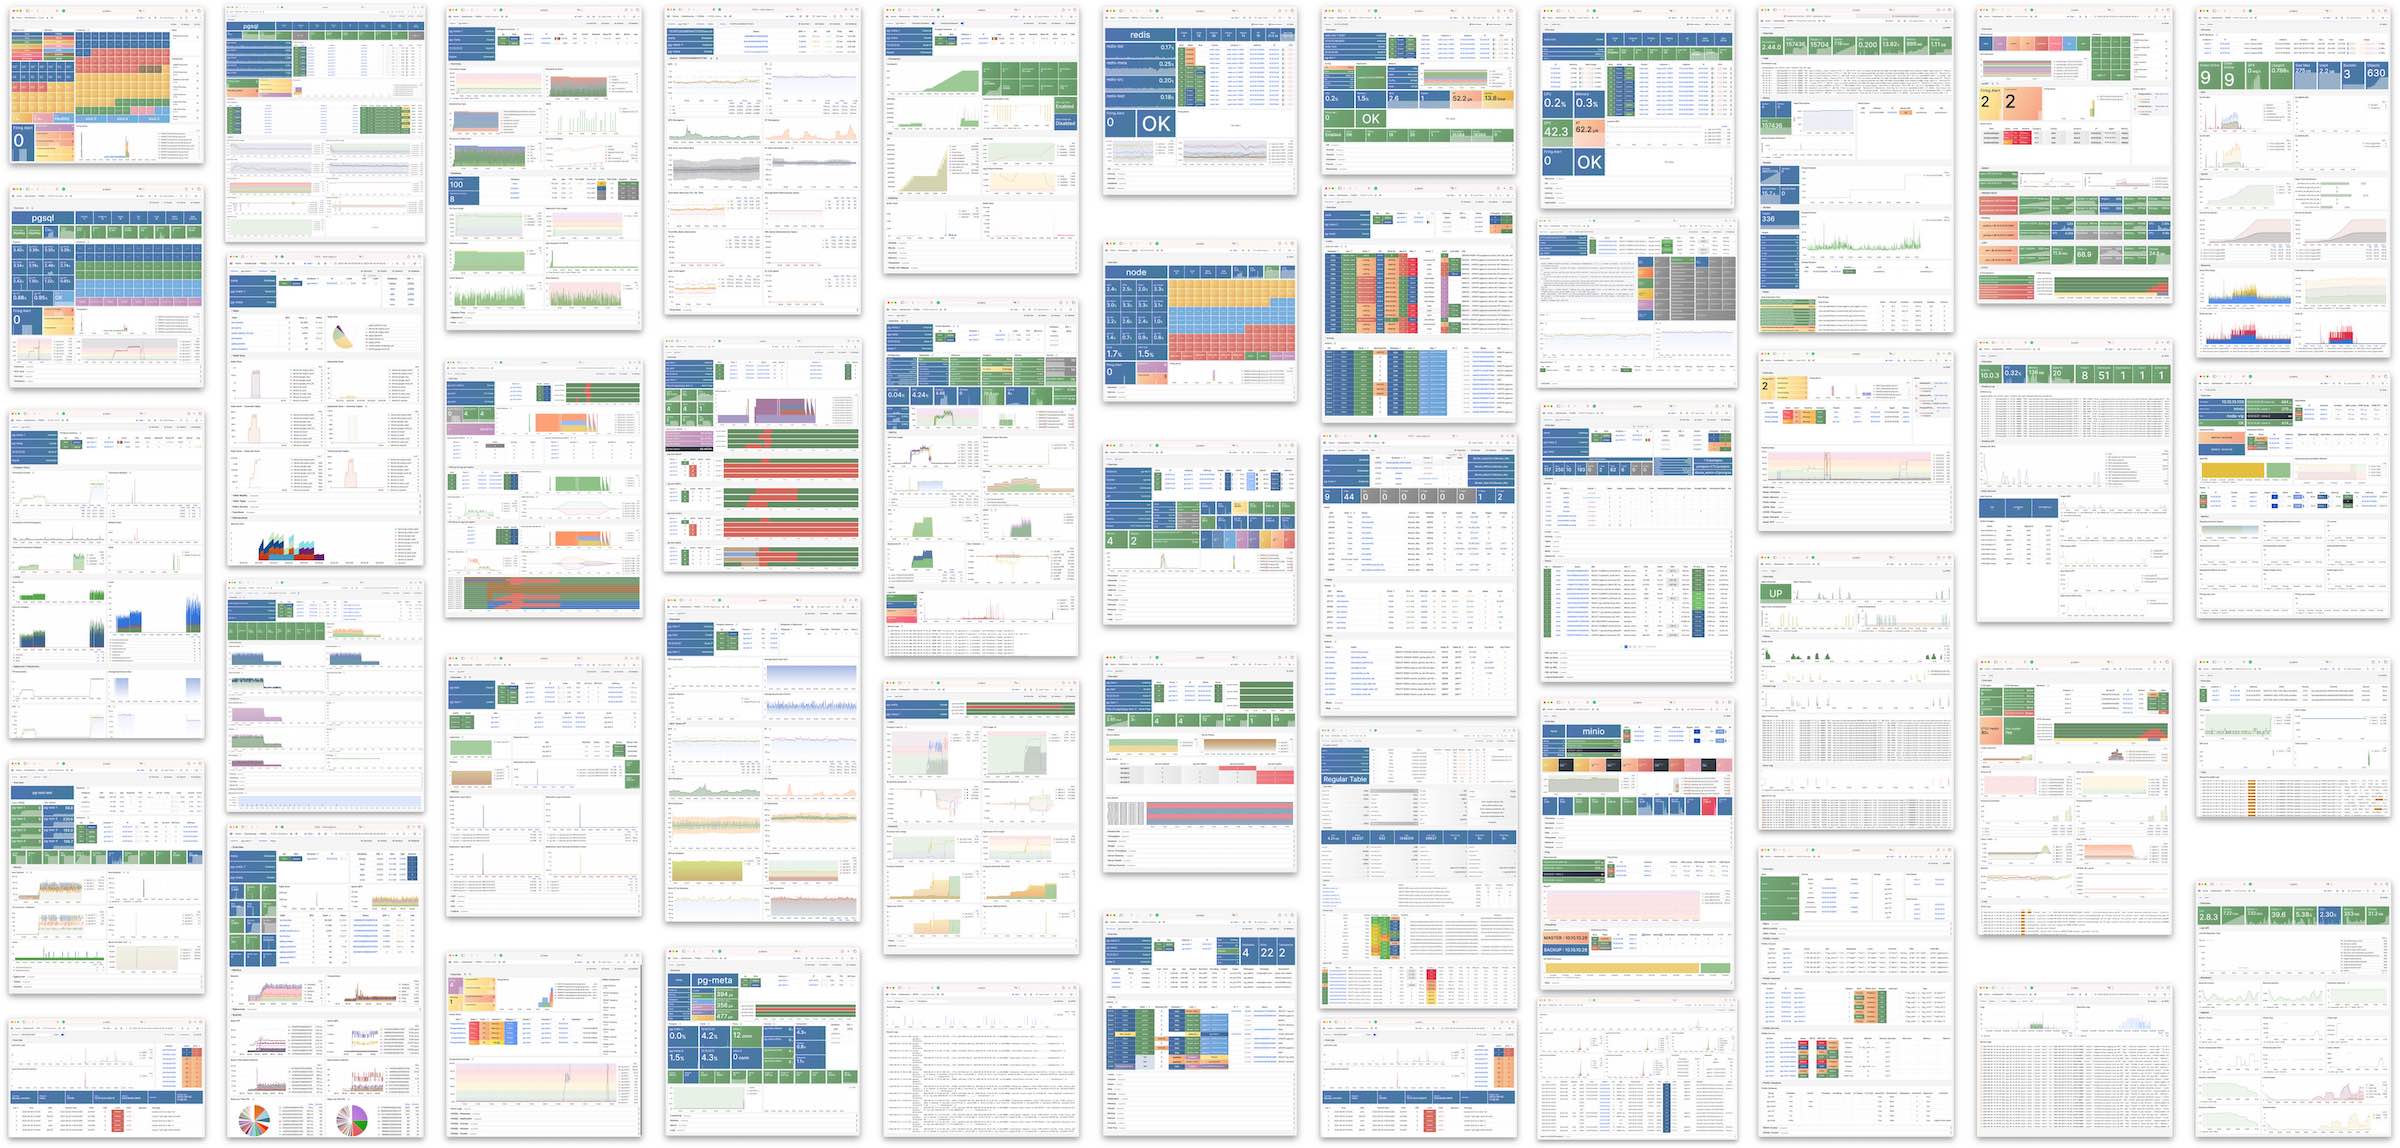
Pigsty provides many out-of-the-box Grafana monitoring dashboards for PostgreSQL: Demo & Gallery.
There are 26 PostgreSQL-related monitoring dashboards in Pigsty, organized hierarchically into Overview, Cluster, Instance, and Database categories, and by data source into PGSQL, PGCAT, and PGLOG categories.
Overview
Overview
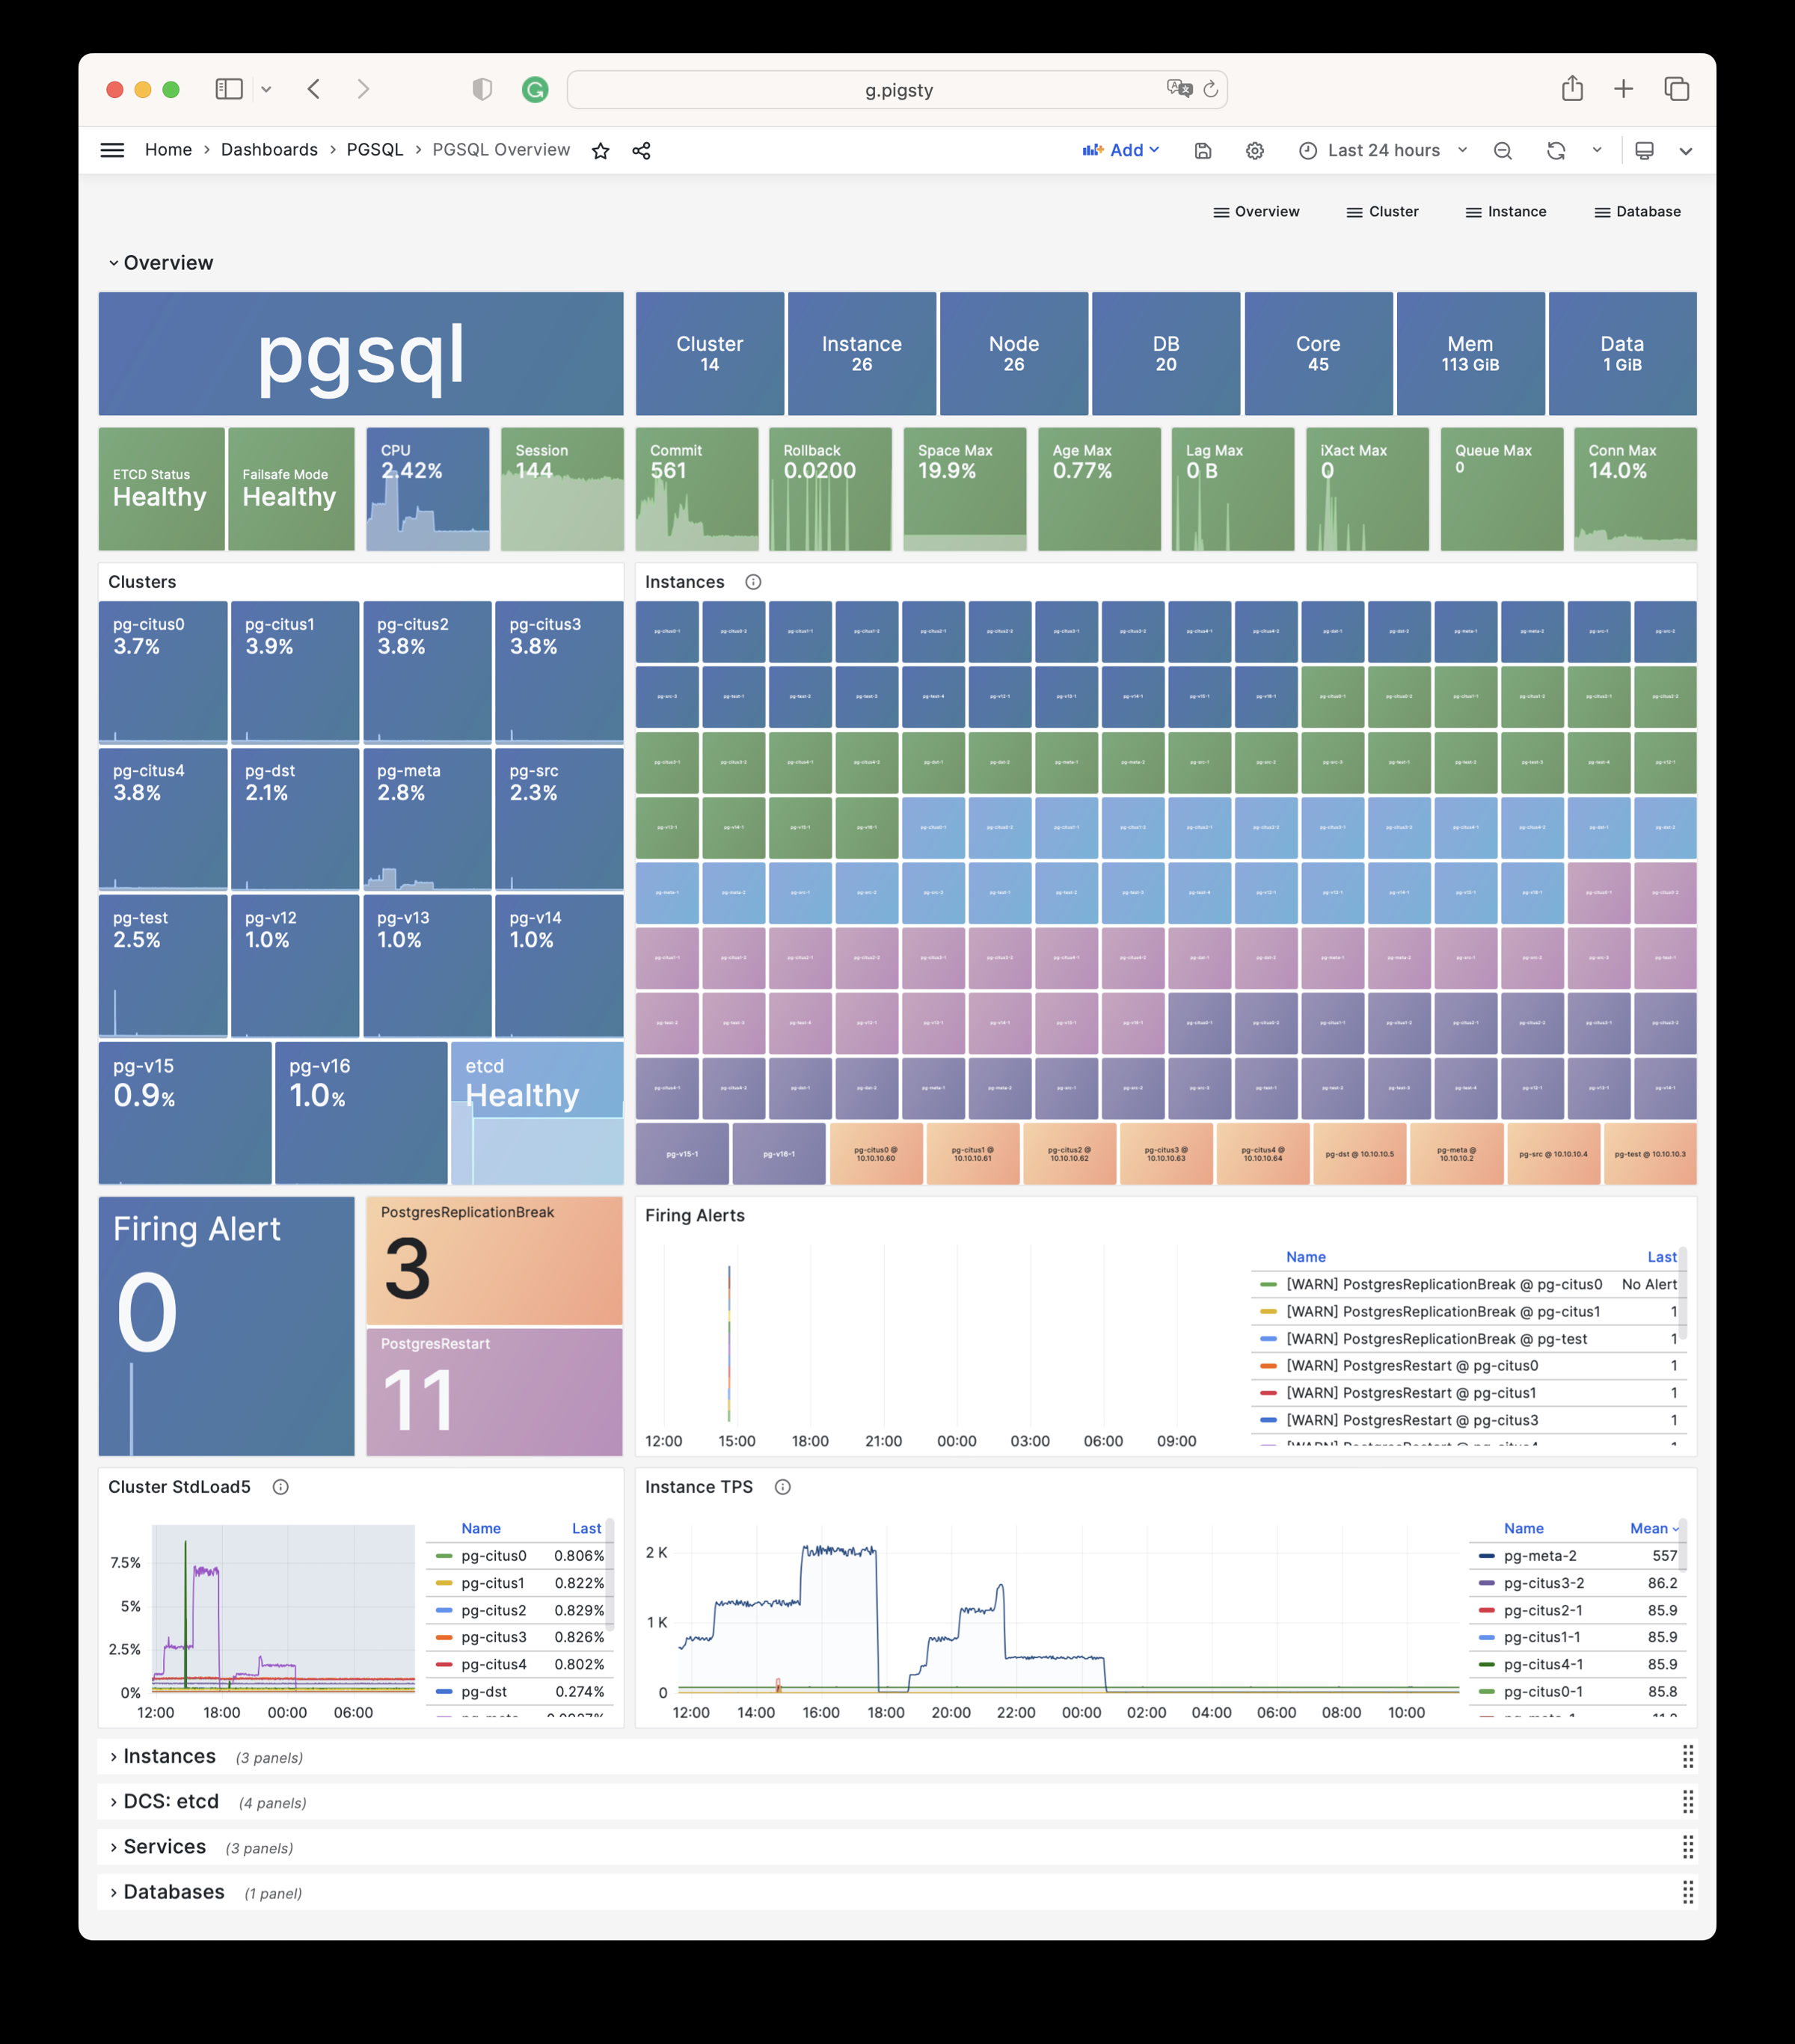
- pgsql-overview: Main dashboard for the PGSQL module
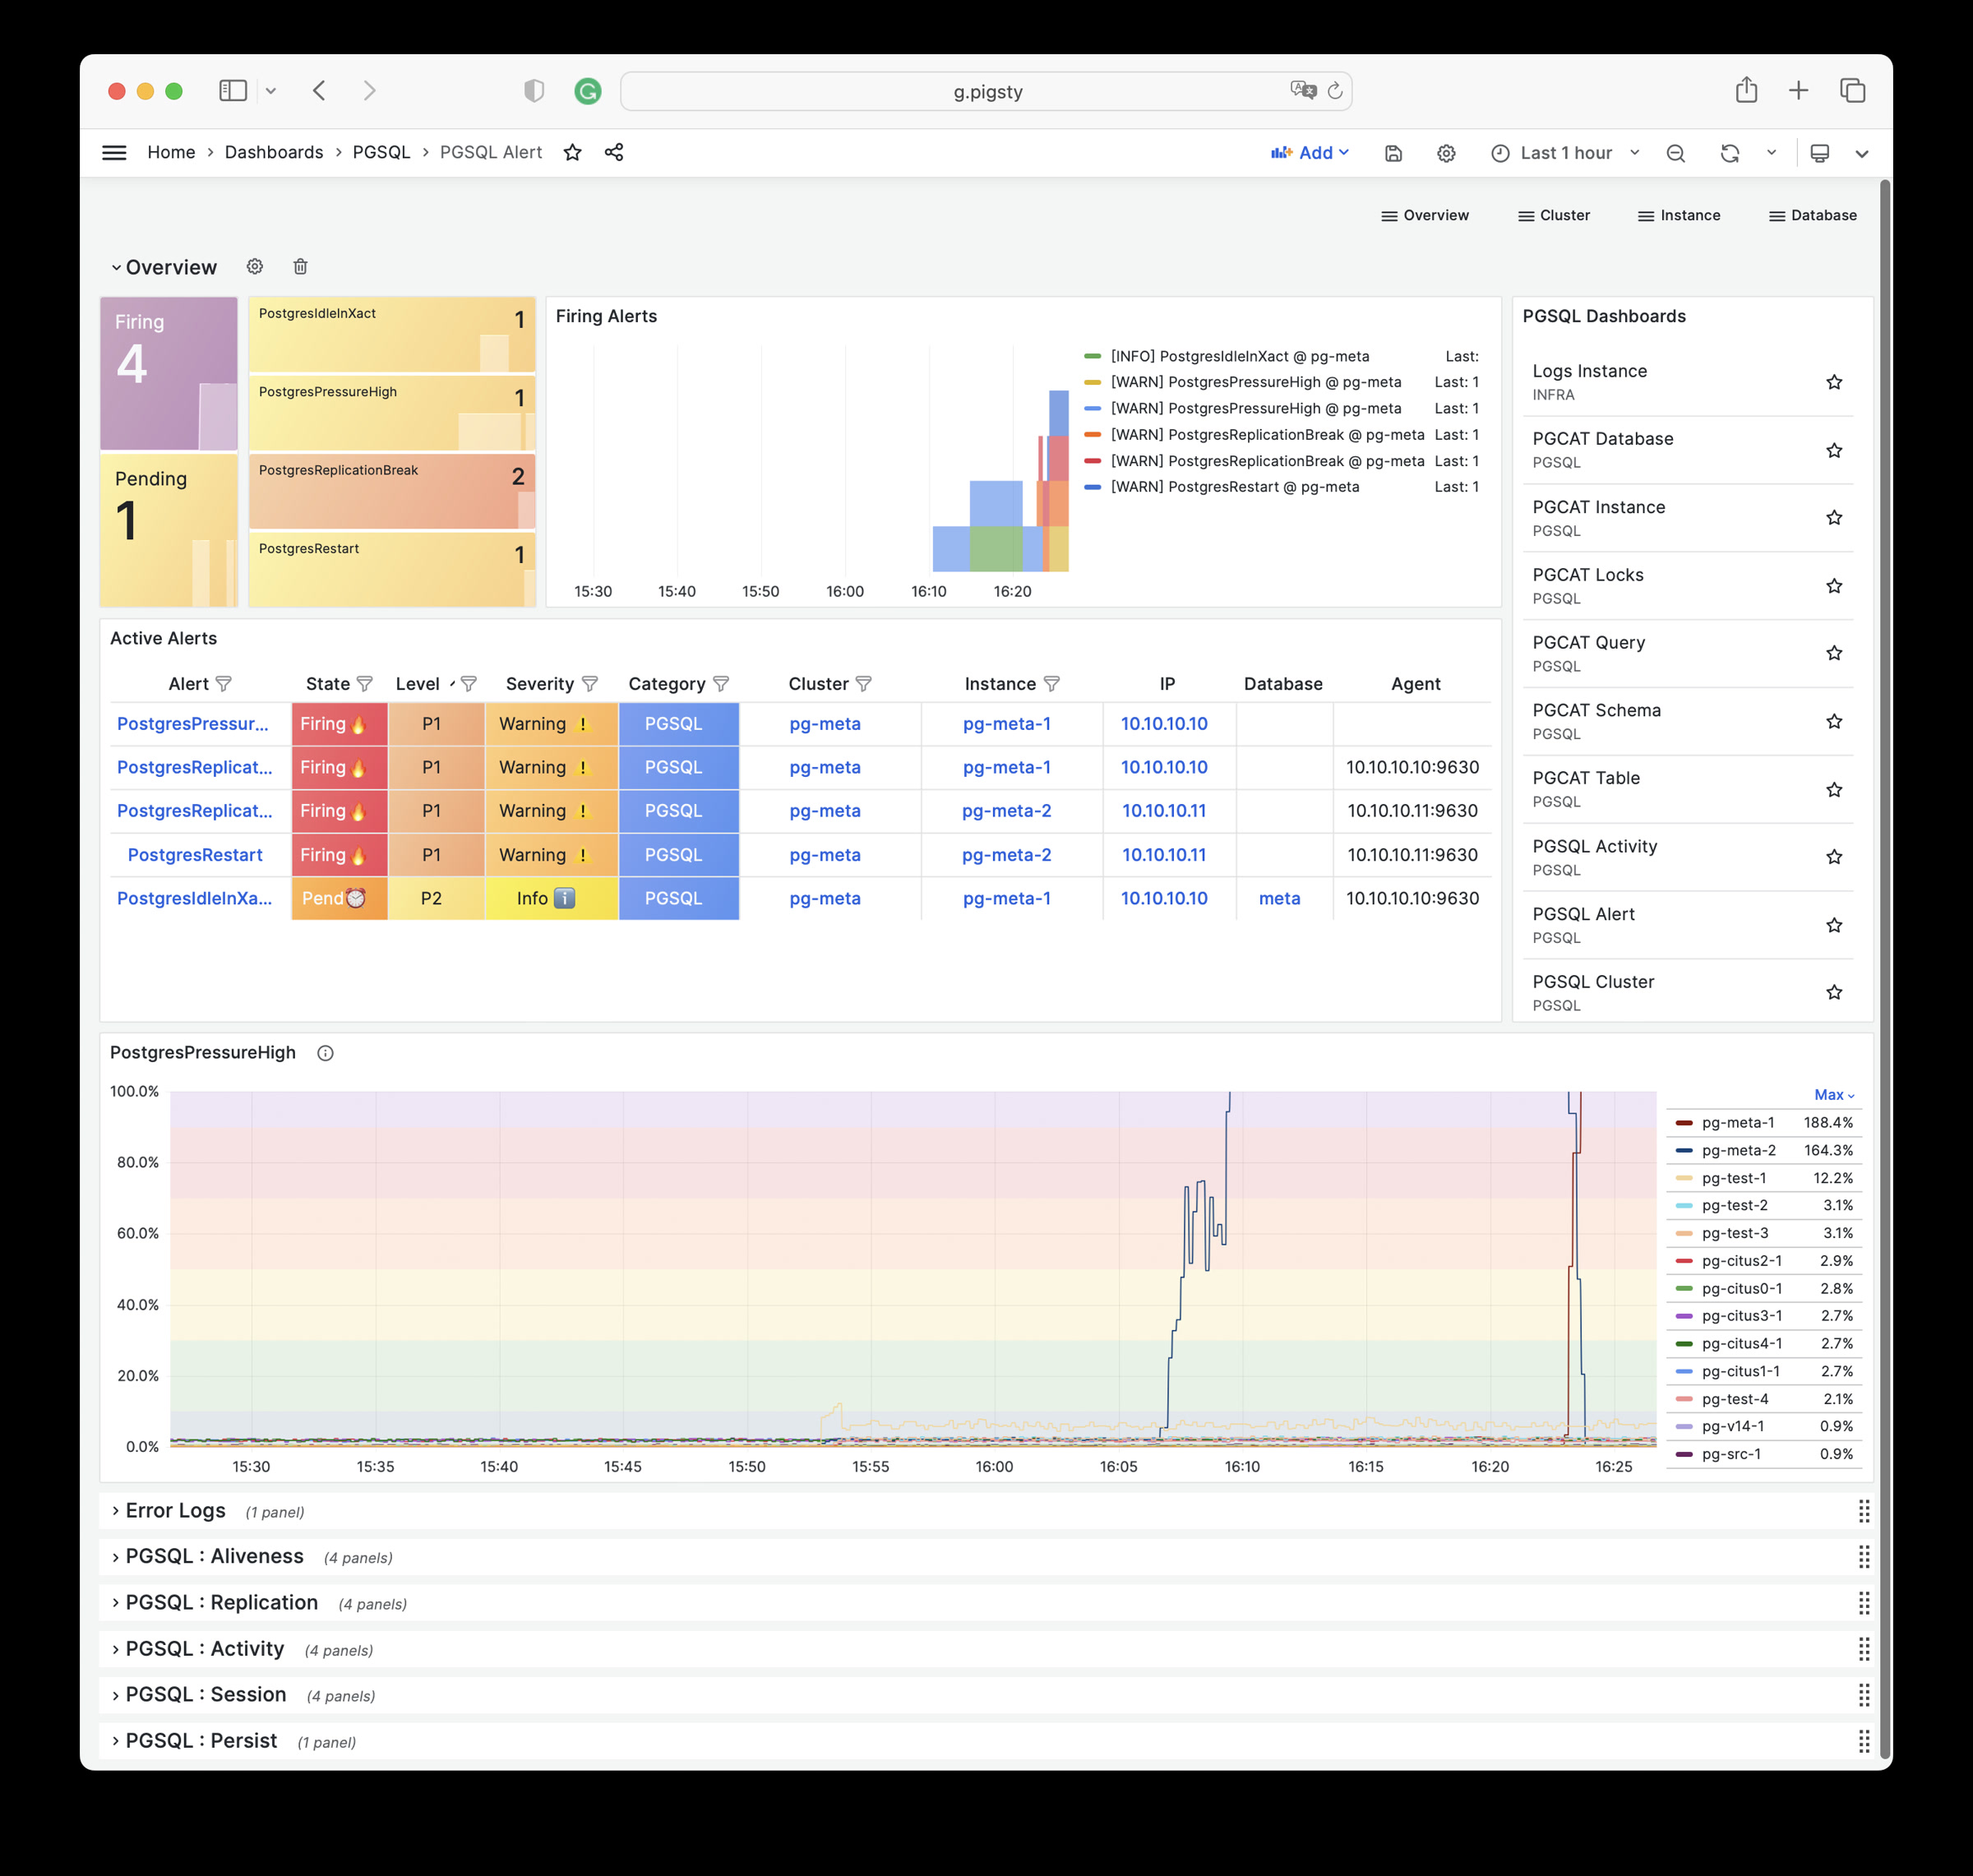
- pgsql-alert: Global critical metrics and alert events for PGSQL
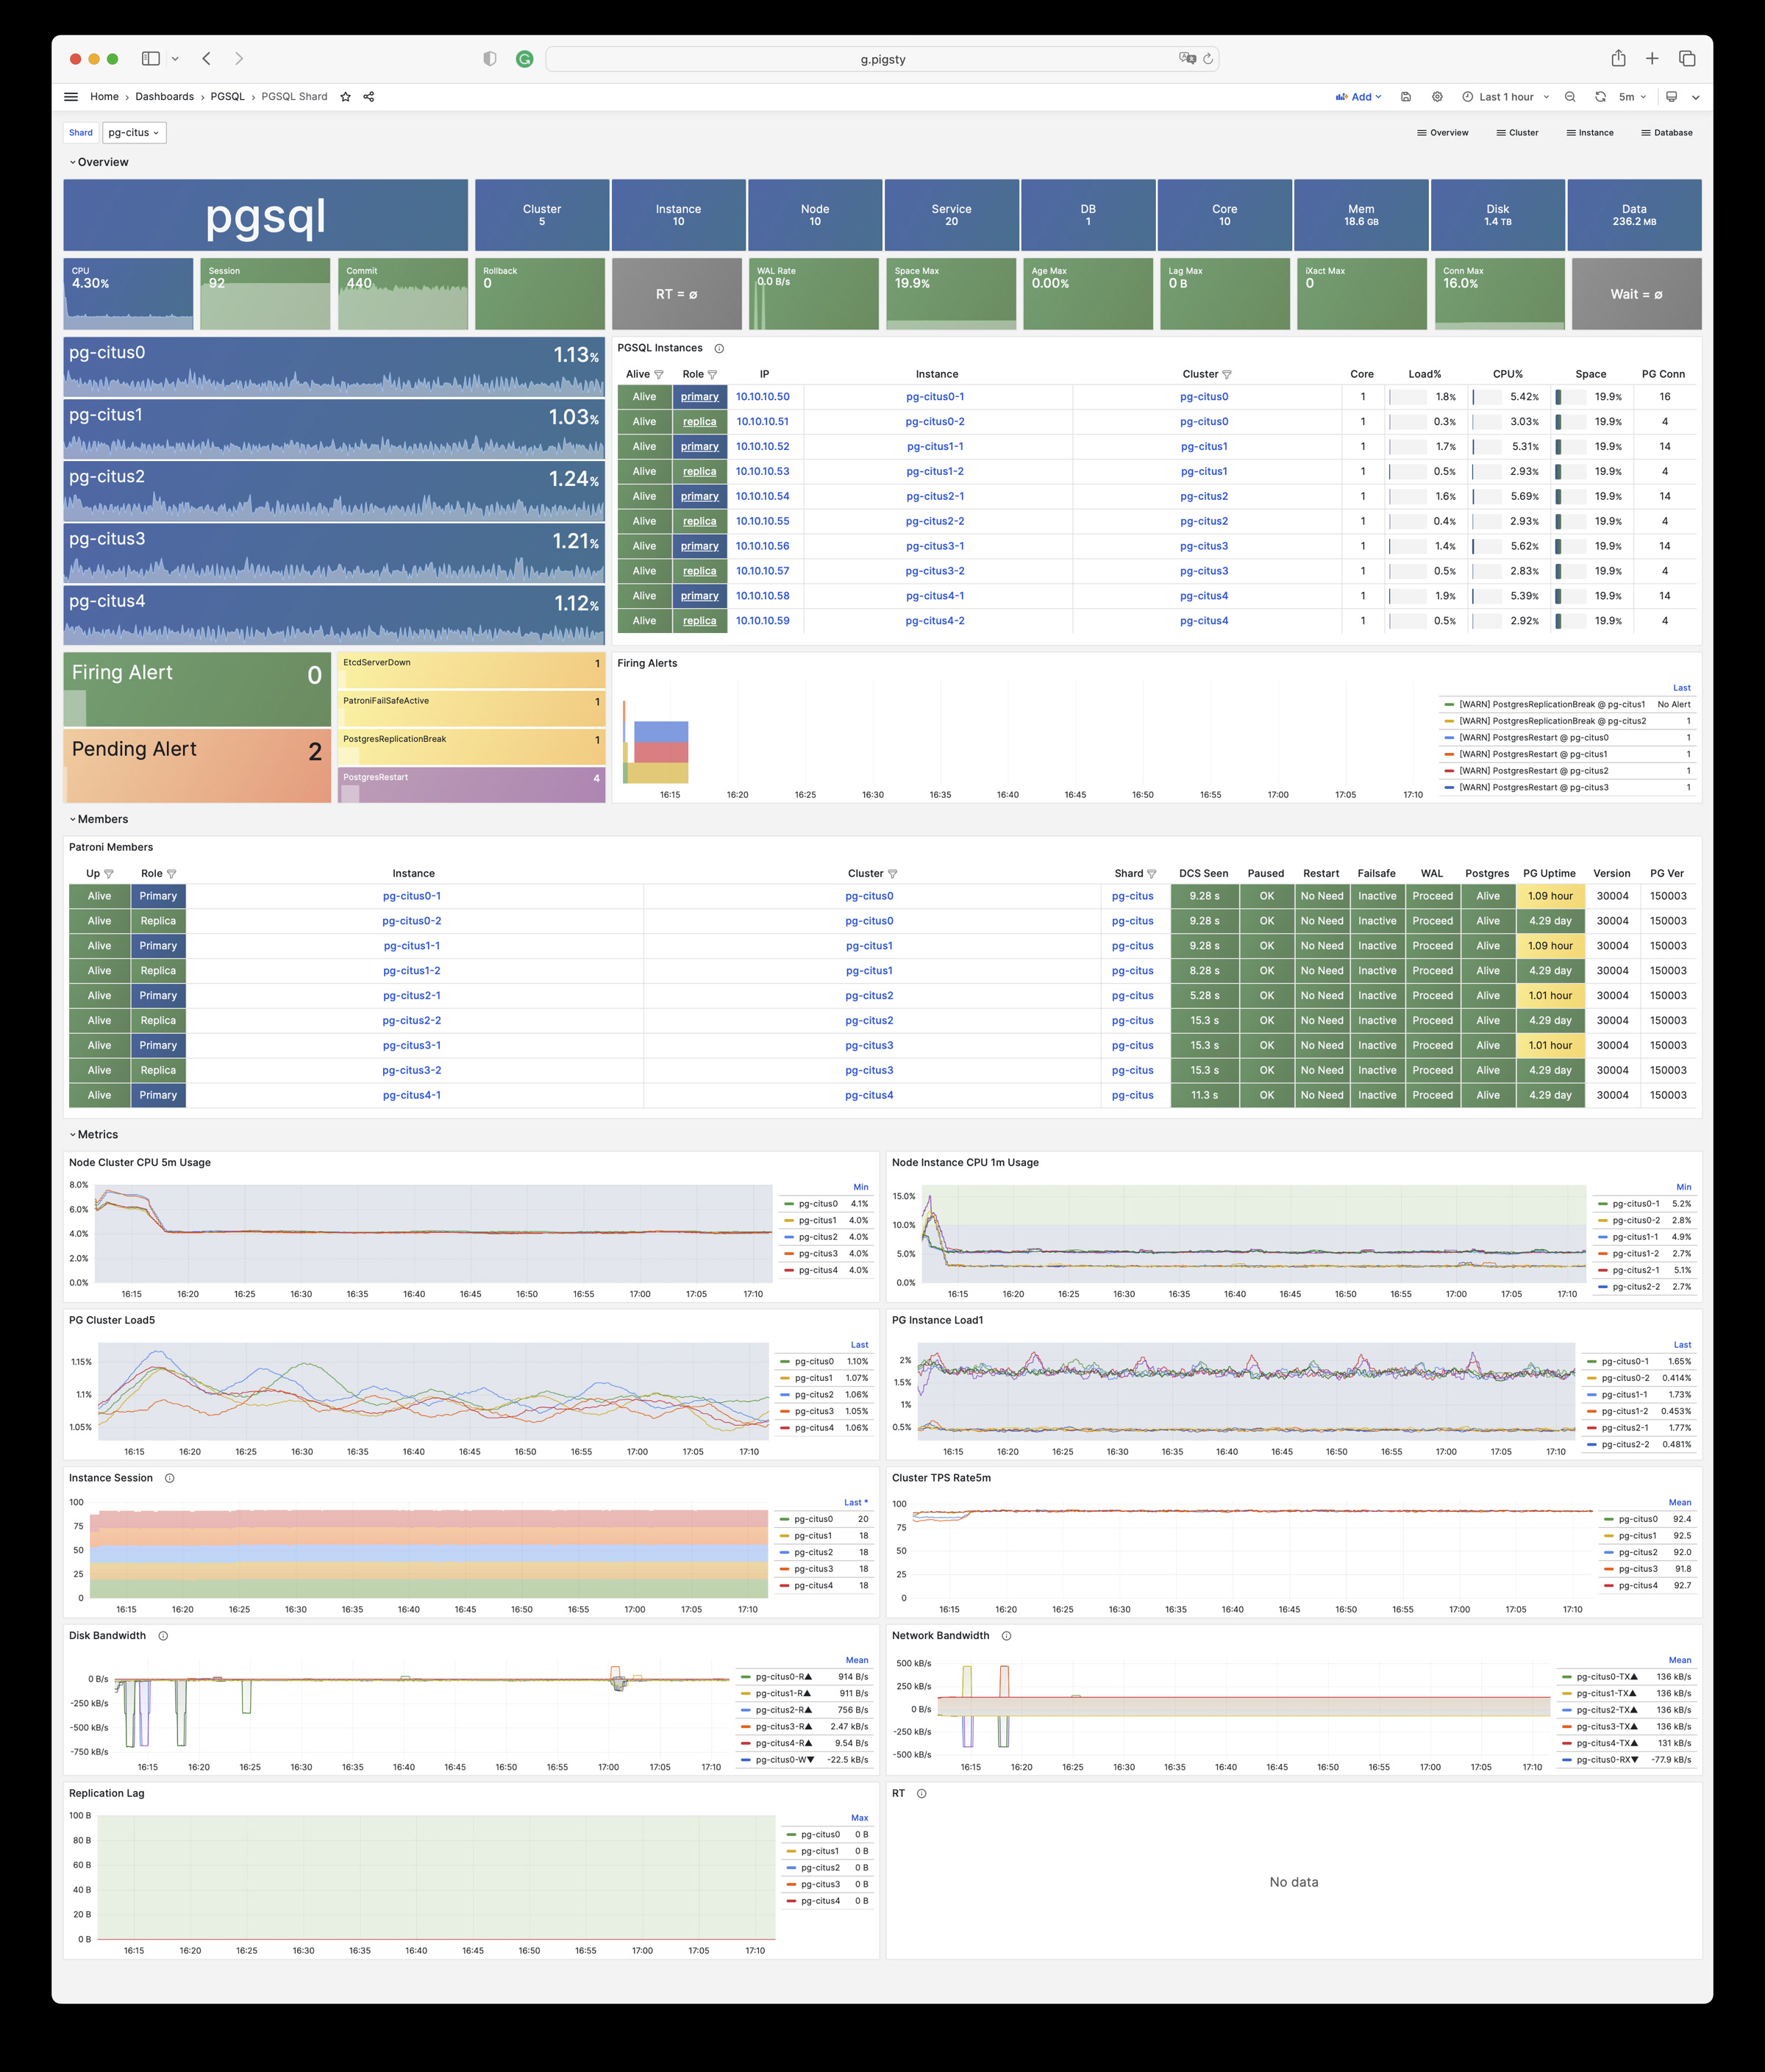
- pgsql-shard: Overview of horizontally sharded PGSQL clusters, such as Citus / GPSQL clusters
Cluster
- pgsql-cluster: Main dashboard for a PGSQL cluster
- pgrds-cluster: RDS version of PGSQL Cluster, focused on all PostgreSQL-specific metrics
- pgsql-activity: Focus on PGSQL cluster sessions/load/QPS/TPS/locks
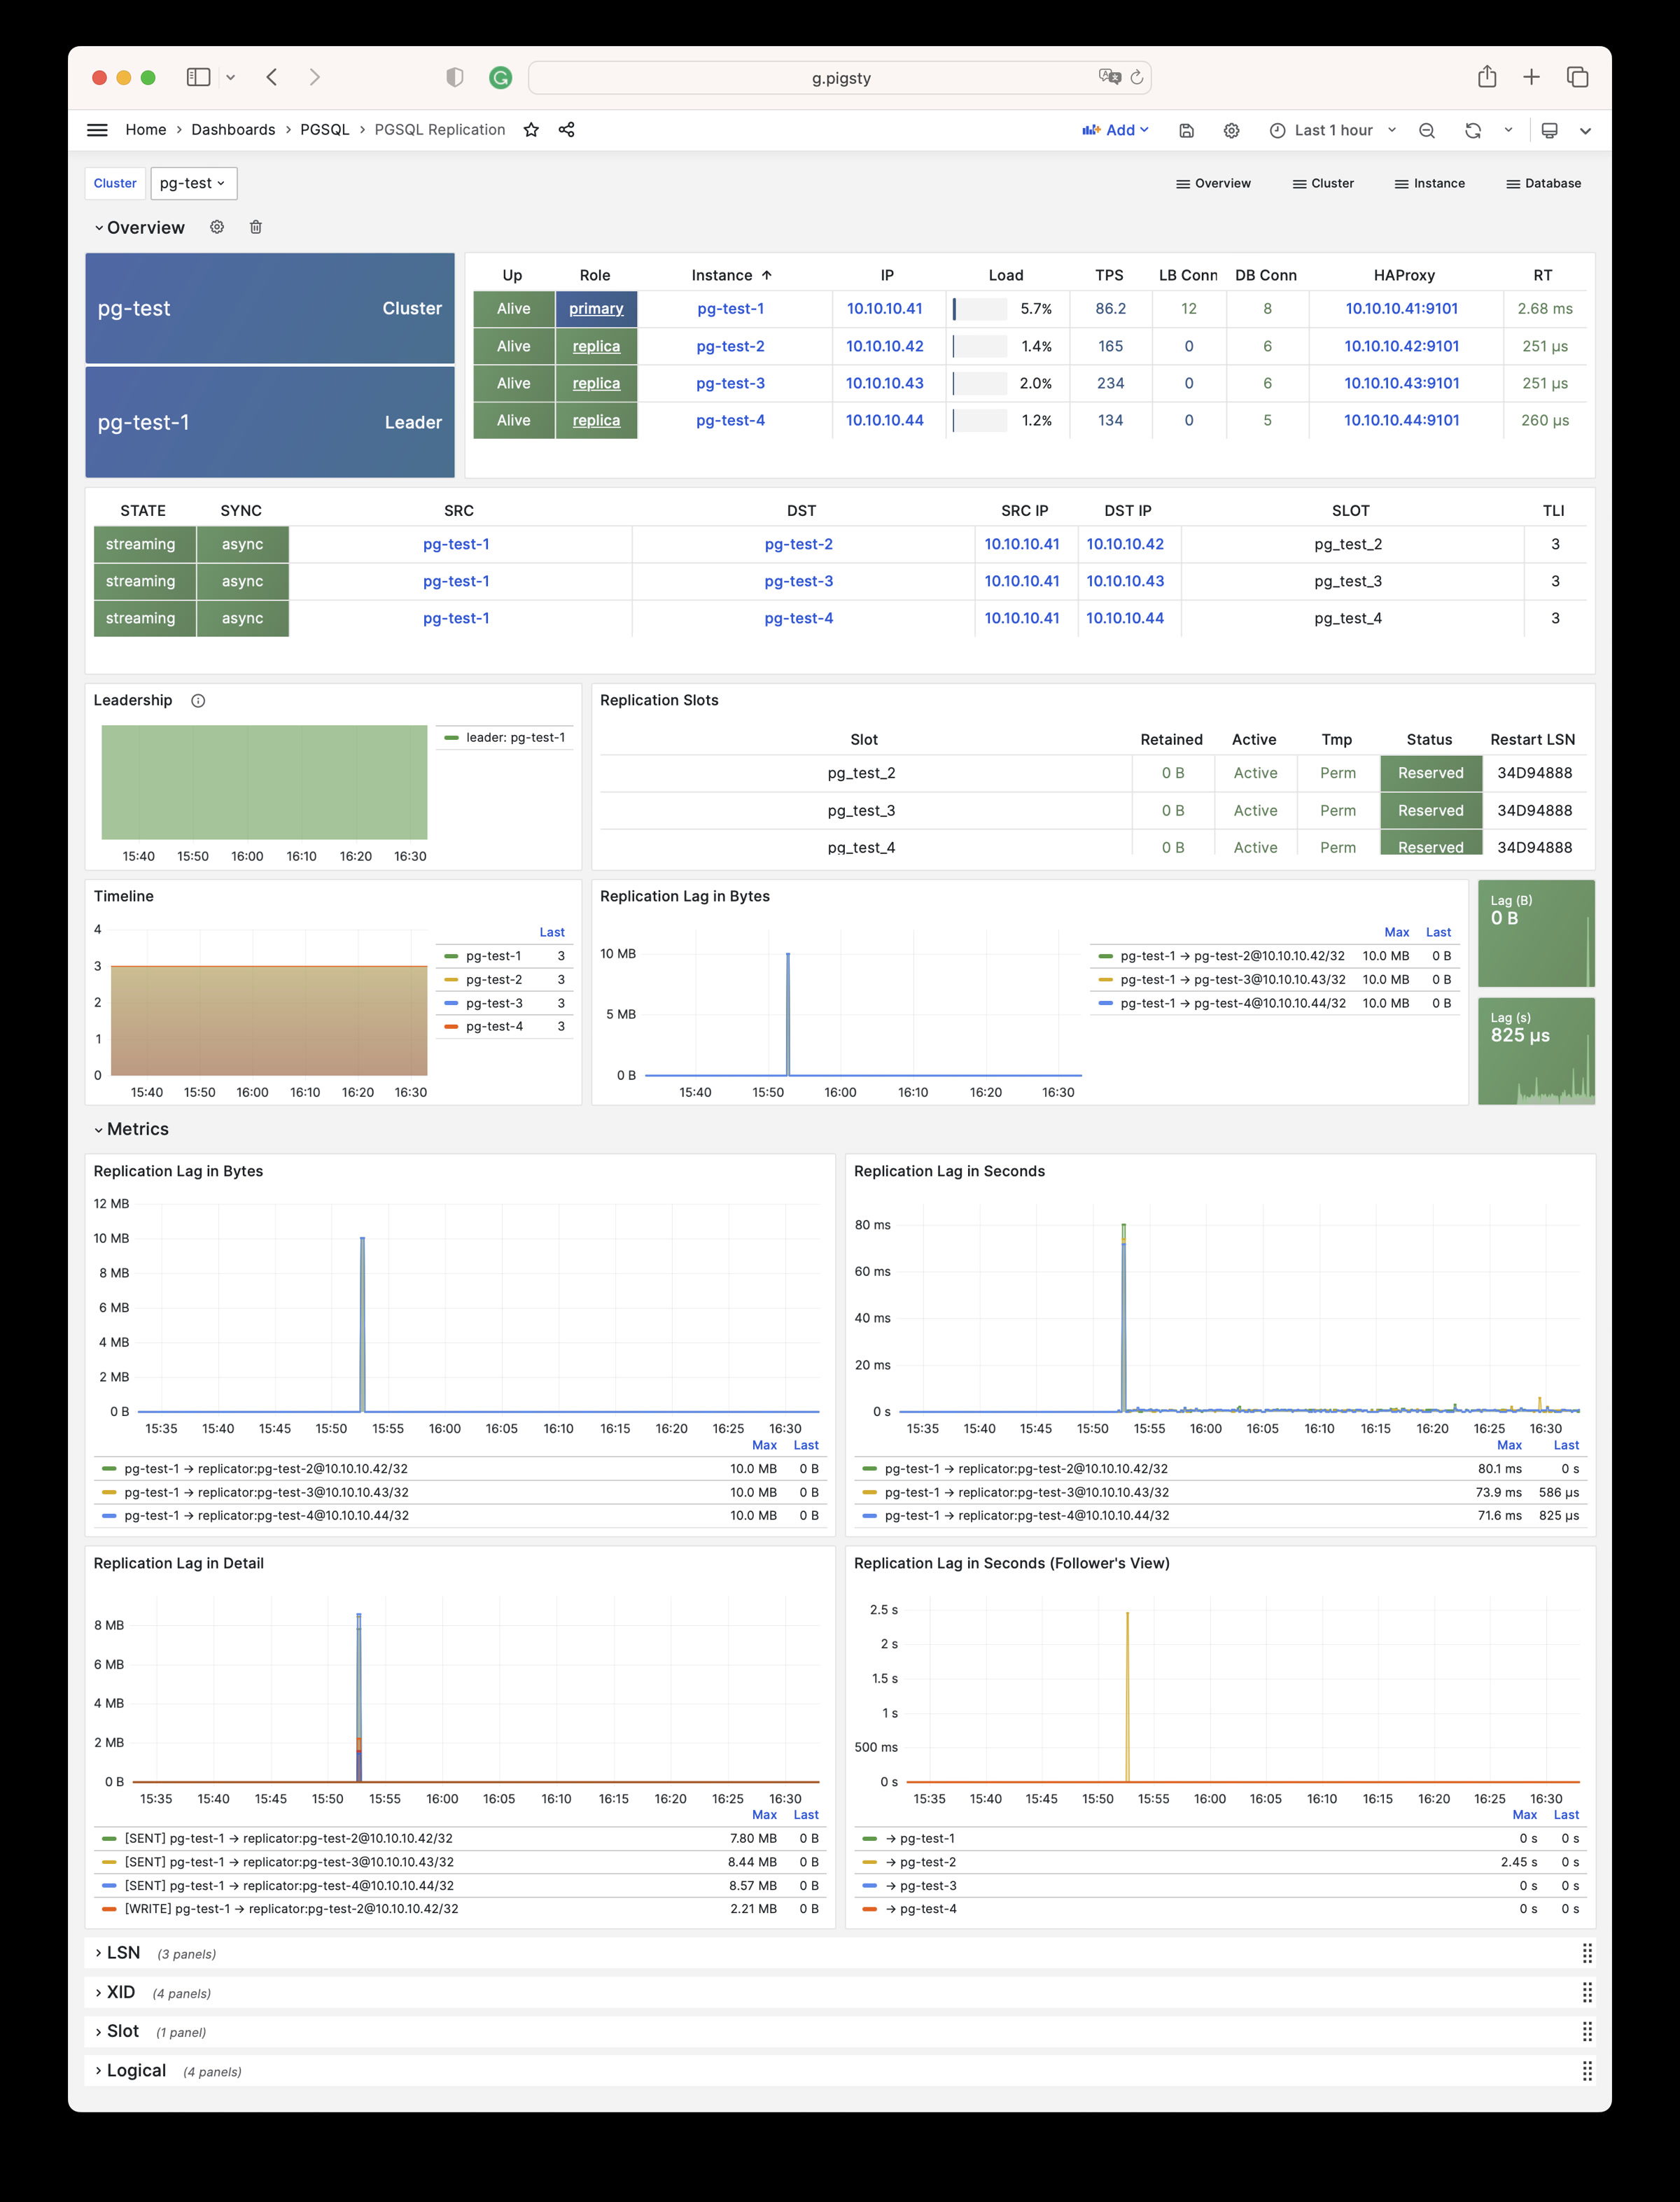
- pgsql-replication: Focus on PGSQL cluster replication, slots, and pub/sub
- pgsql-service: Focus on PGSQL cluster services, proxies, routing, and load balancing
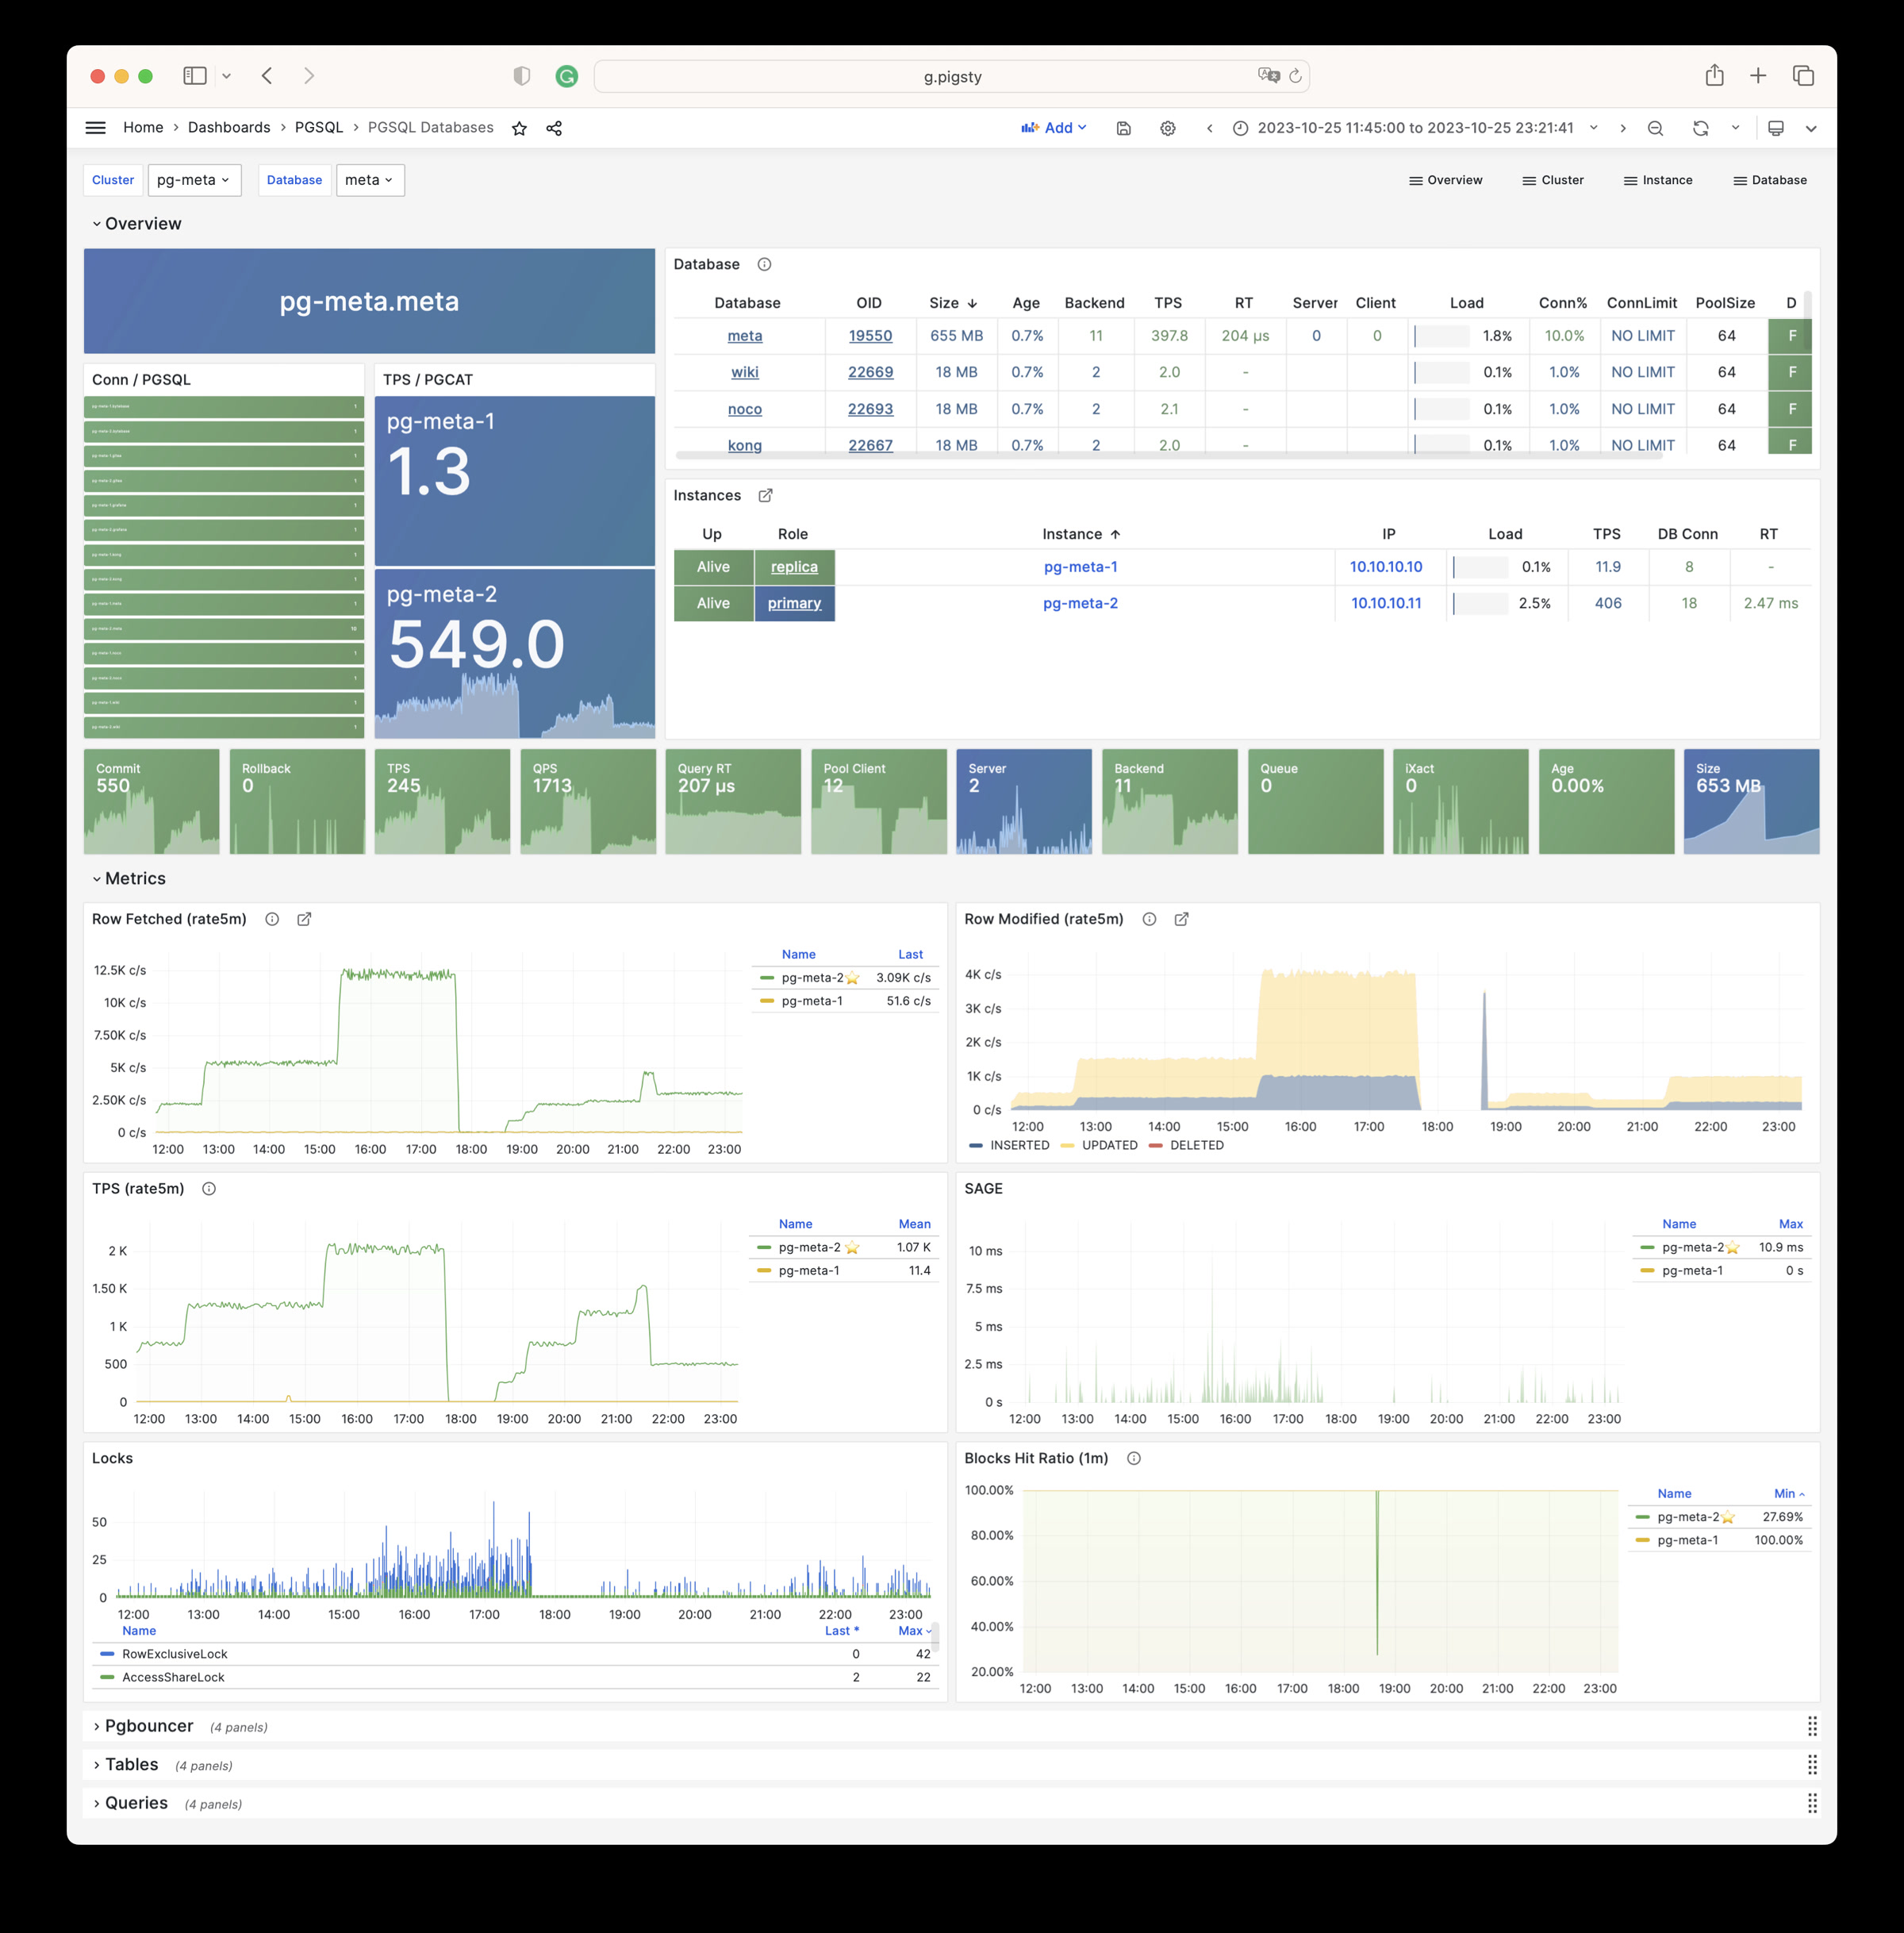
- pgsql-databases: Focus on database CRUD, slow queries, and table statistics across all instances
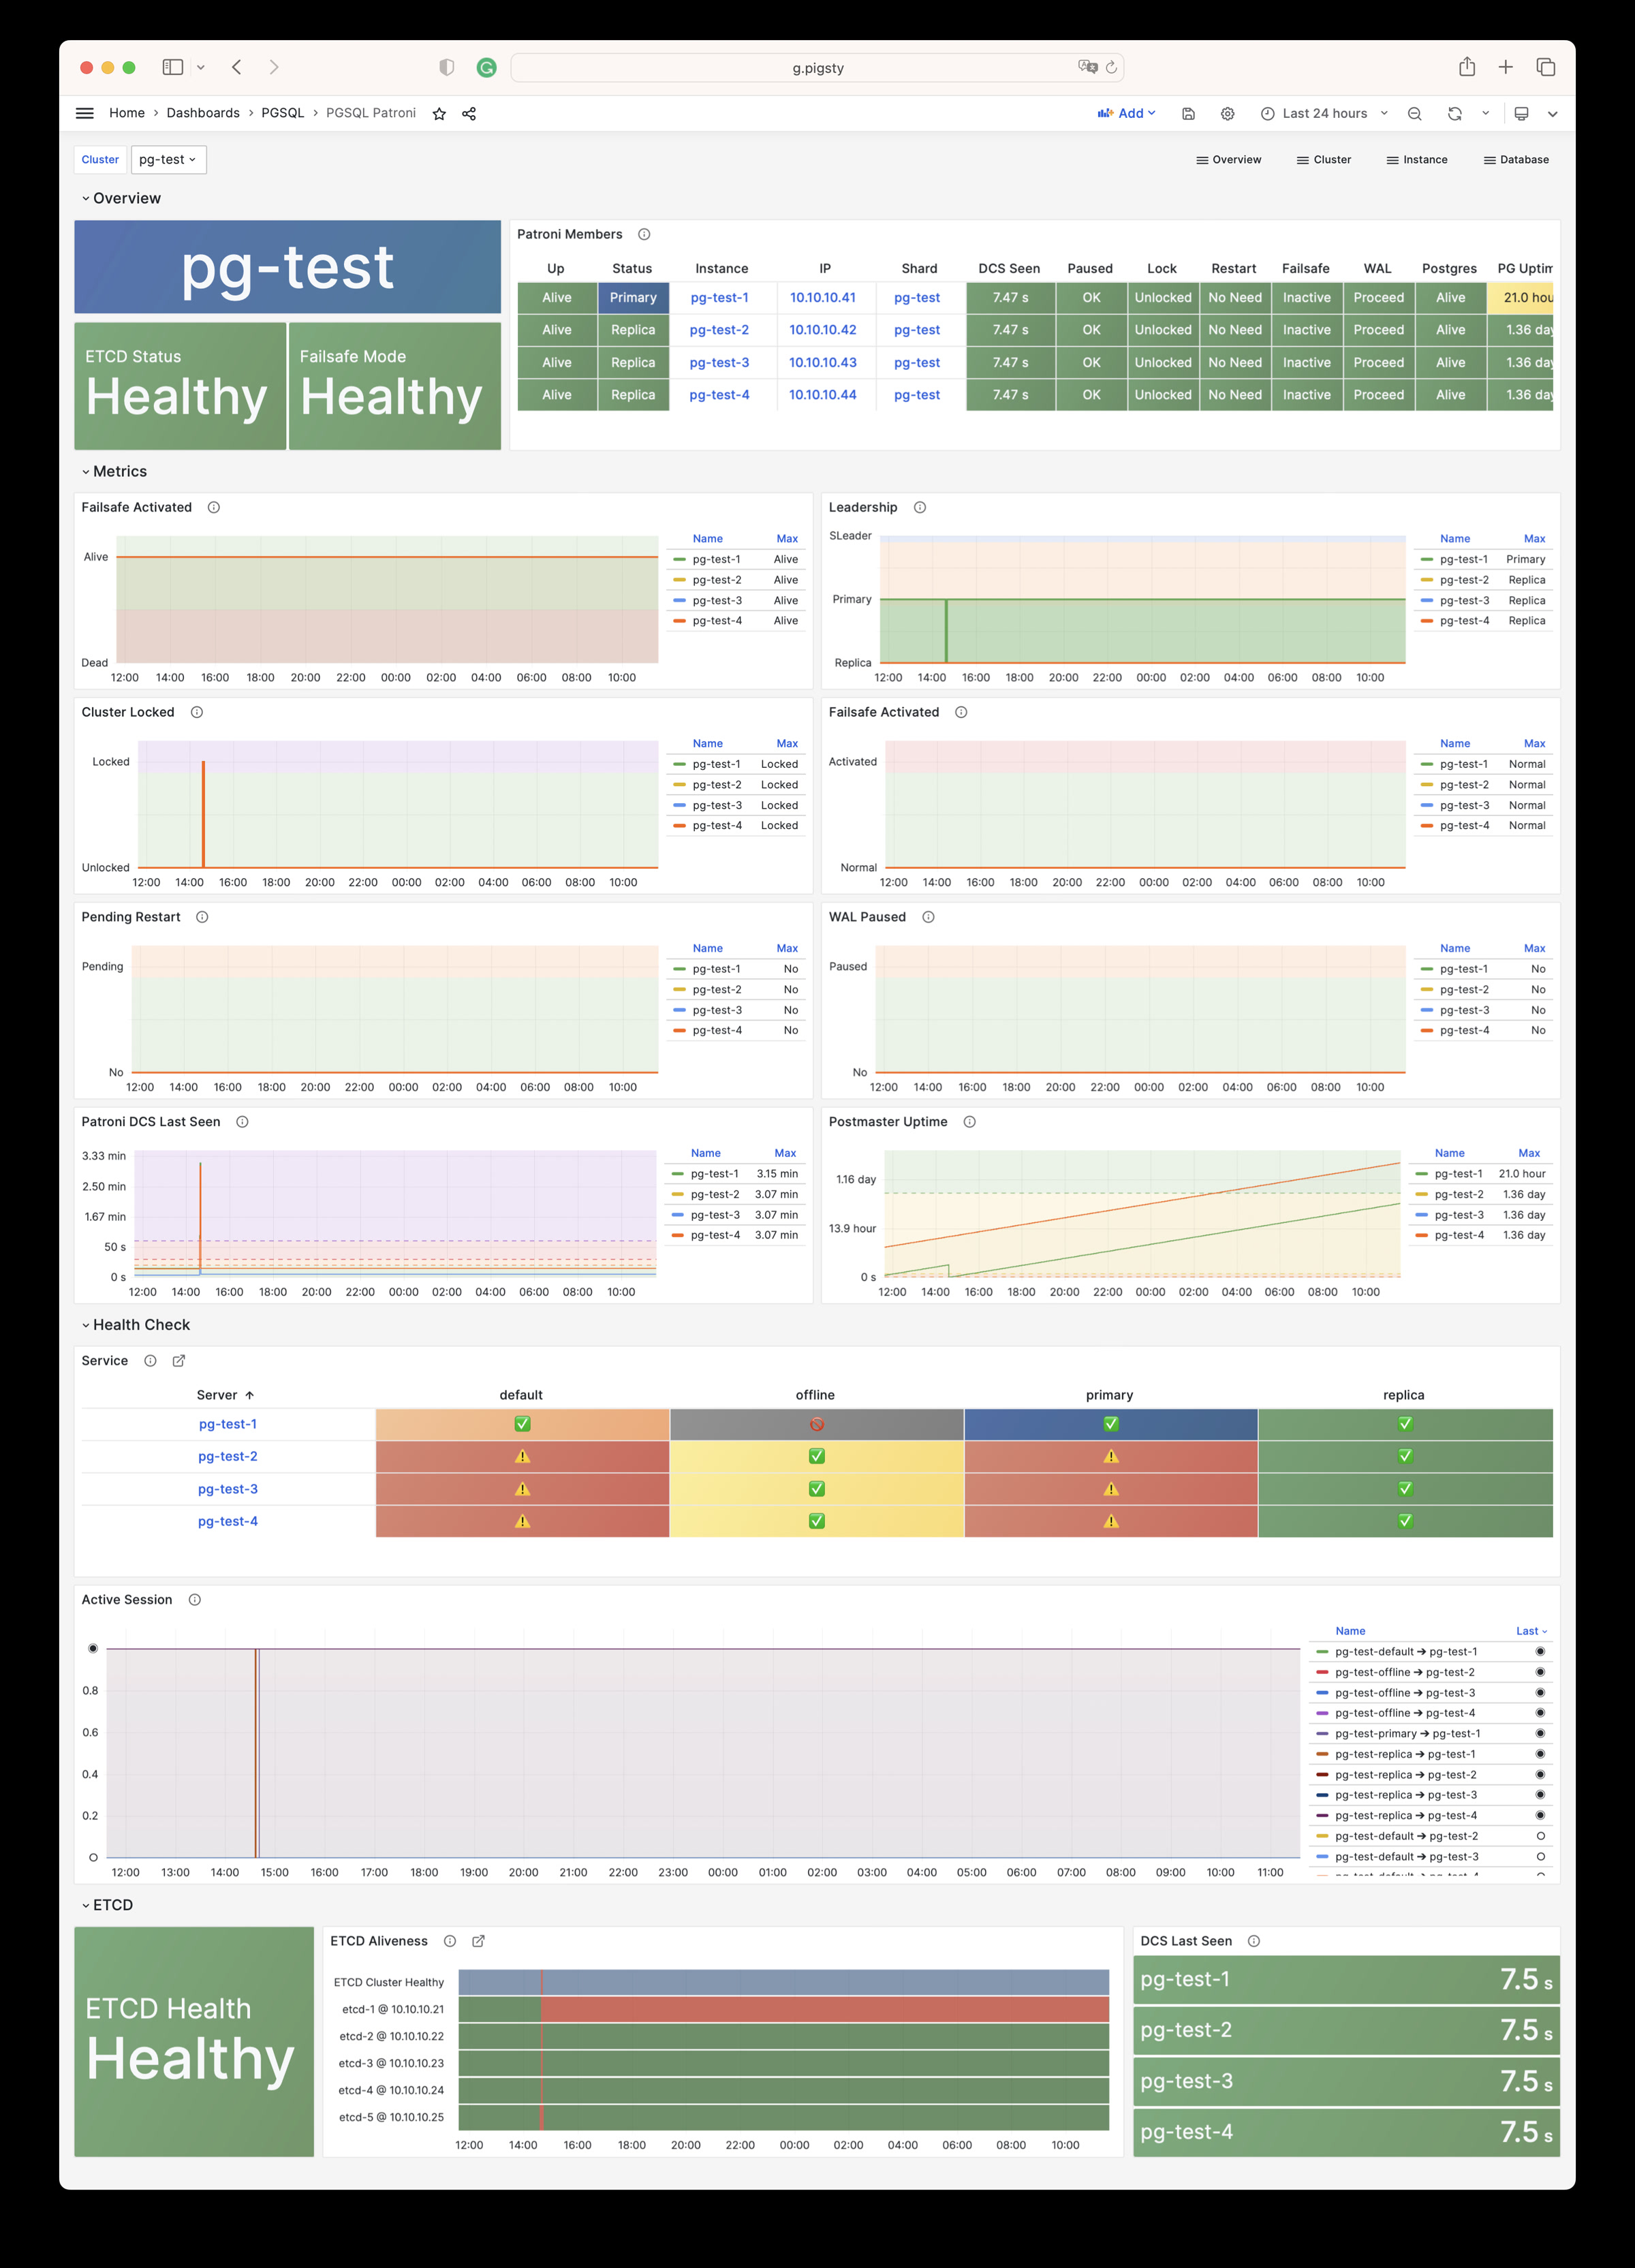
- pgsql-patroni: Focus on cluster high availability status and Patroni component status
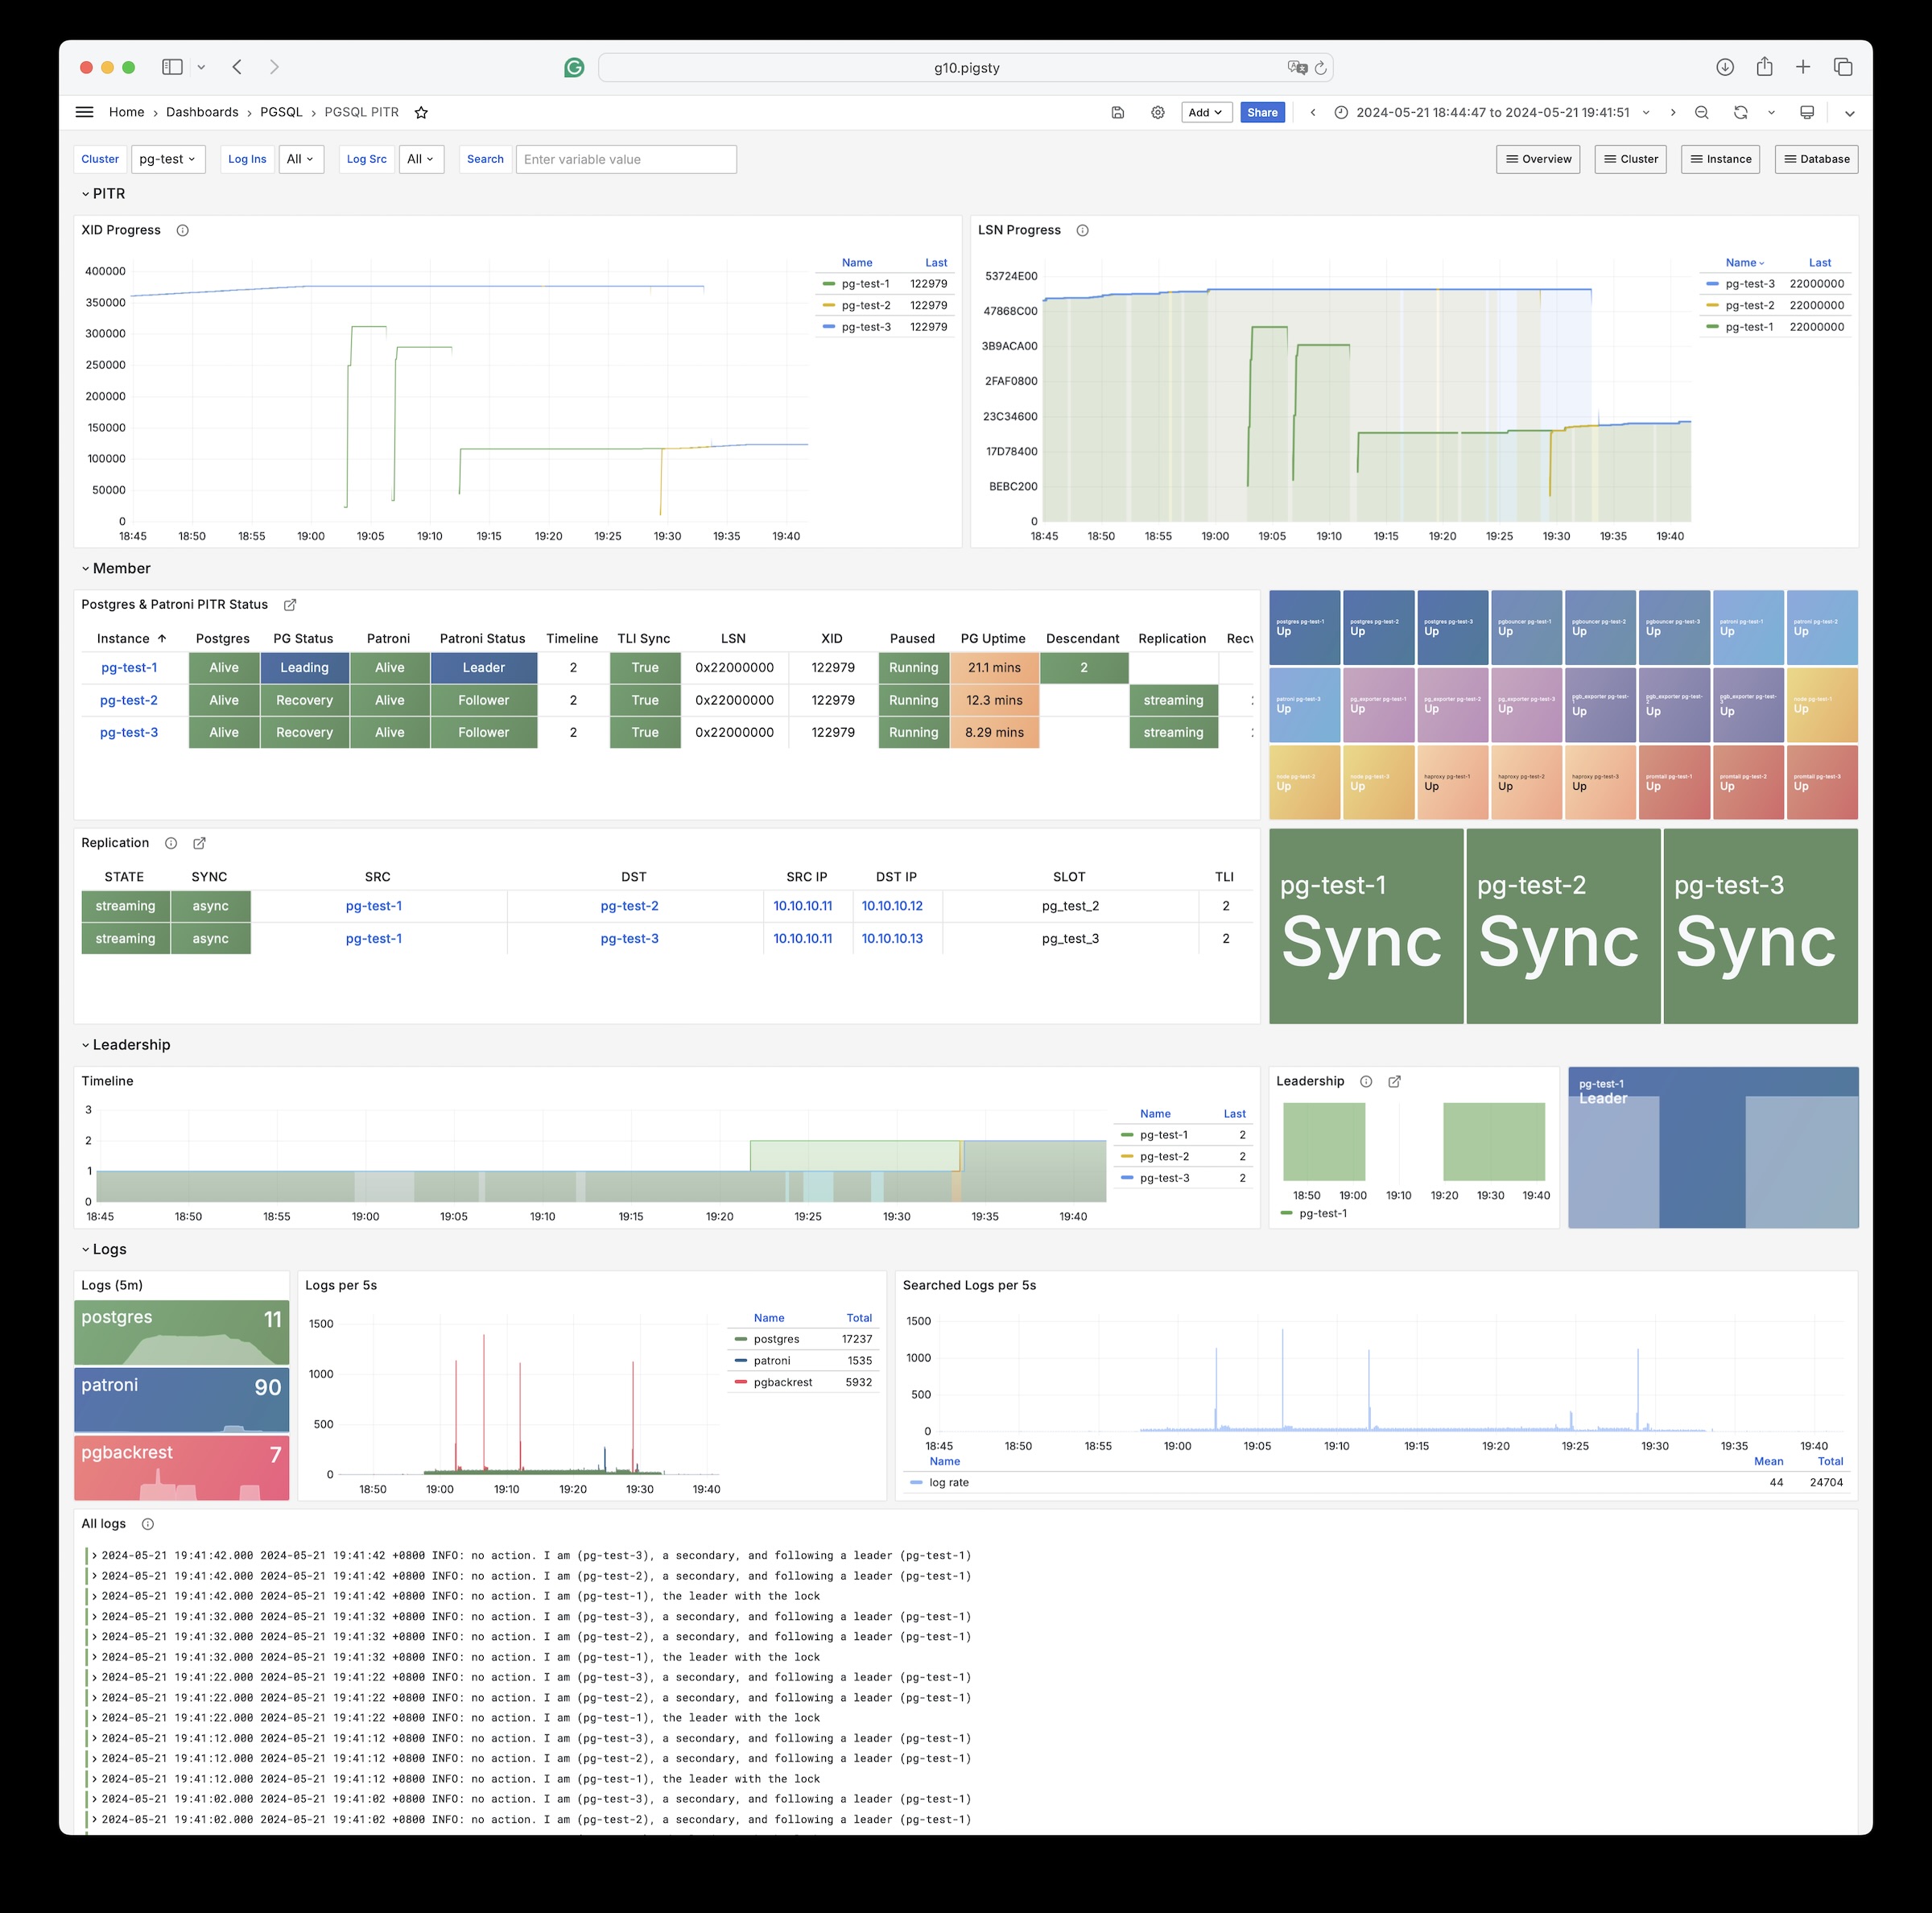
- pgsql-pitr: Focus on cluster PITR process context for point-in-time recovery assistance
Instance
- pgsql-instance: Main dashboard for a single PGSQL instance
- pgrds-instance: RDS version of PGSQL Instance, focused on all PostgreSQL-specific metrics
- pgcat-instance: Instance information retrieved directly from the database catalog
- pgsql-proxy: Detailed metrics for a single HAProxy load balancer
- pgsql-pgbouncer: Metrics overview in a single Pgbouncer connection pool instance
- pgsql-persist: Persistence metrics: WAL, XID, checkpoints, archiving, IO
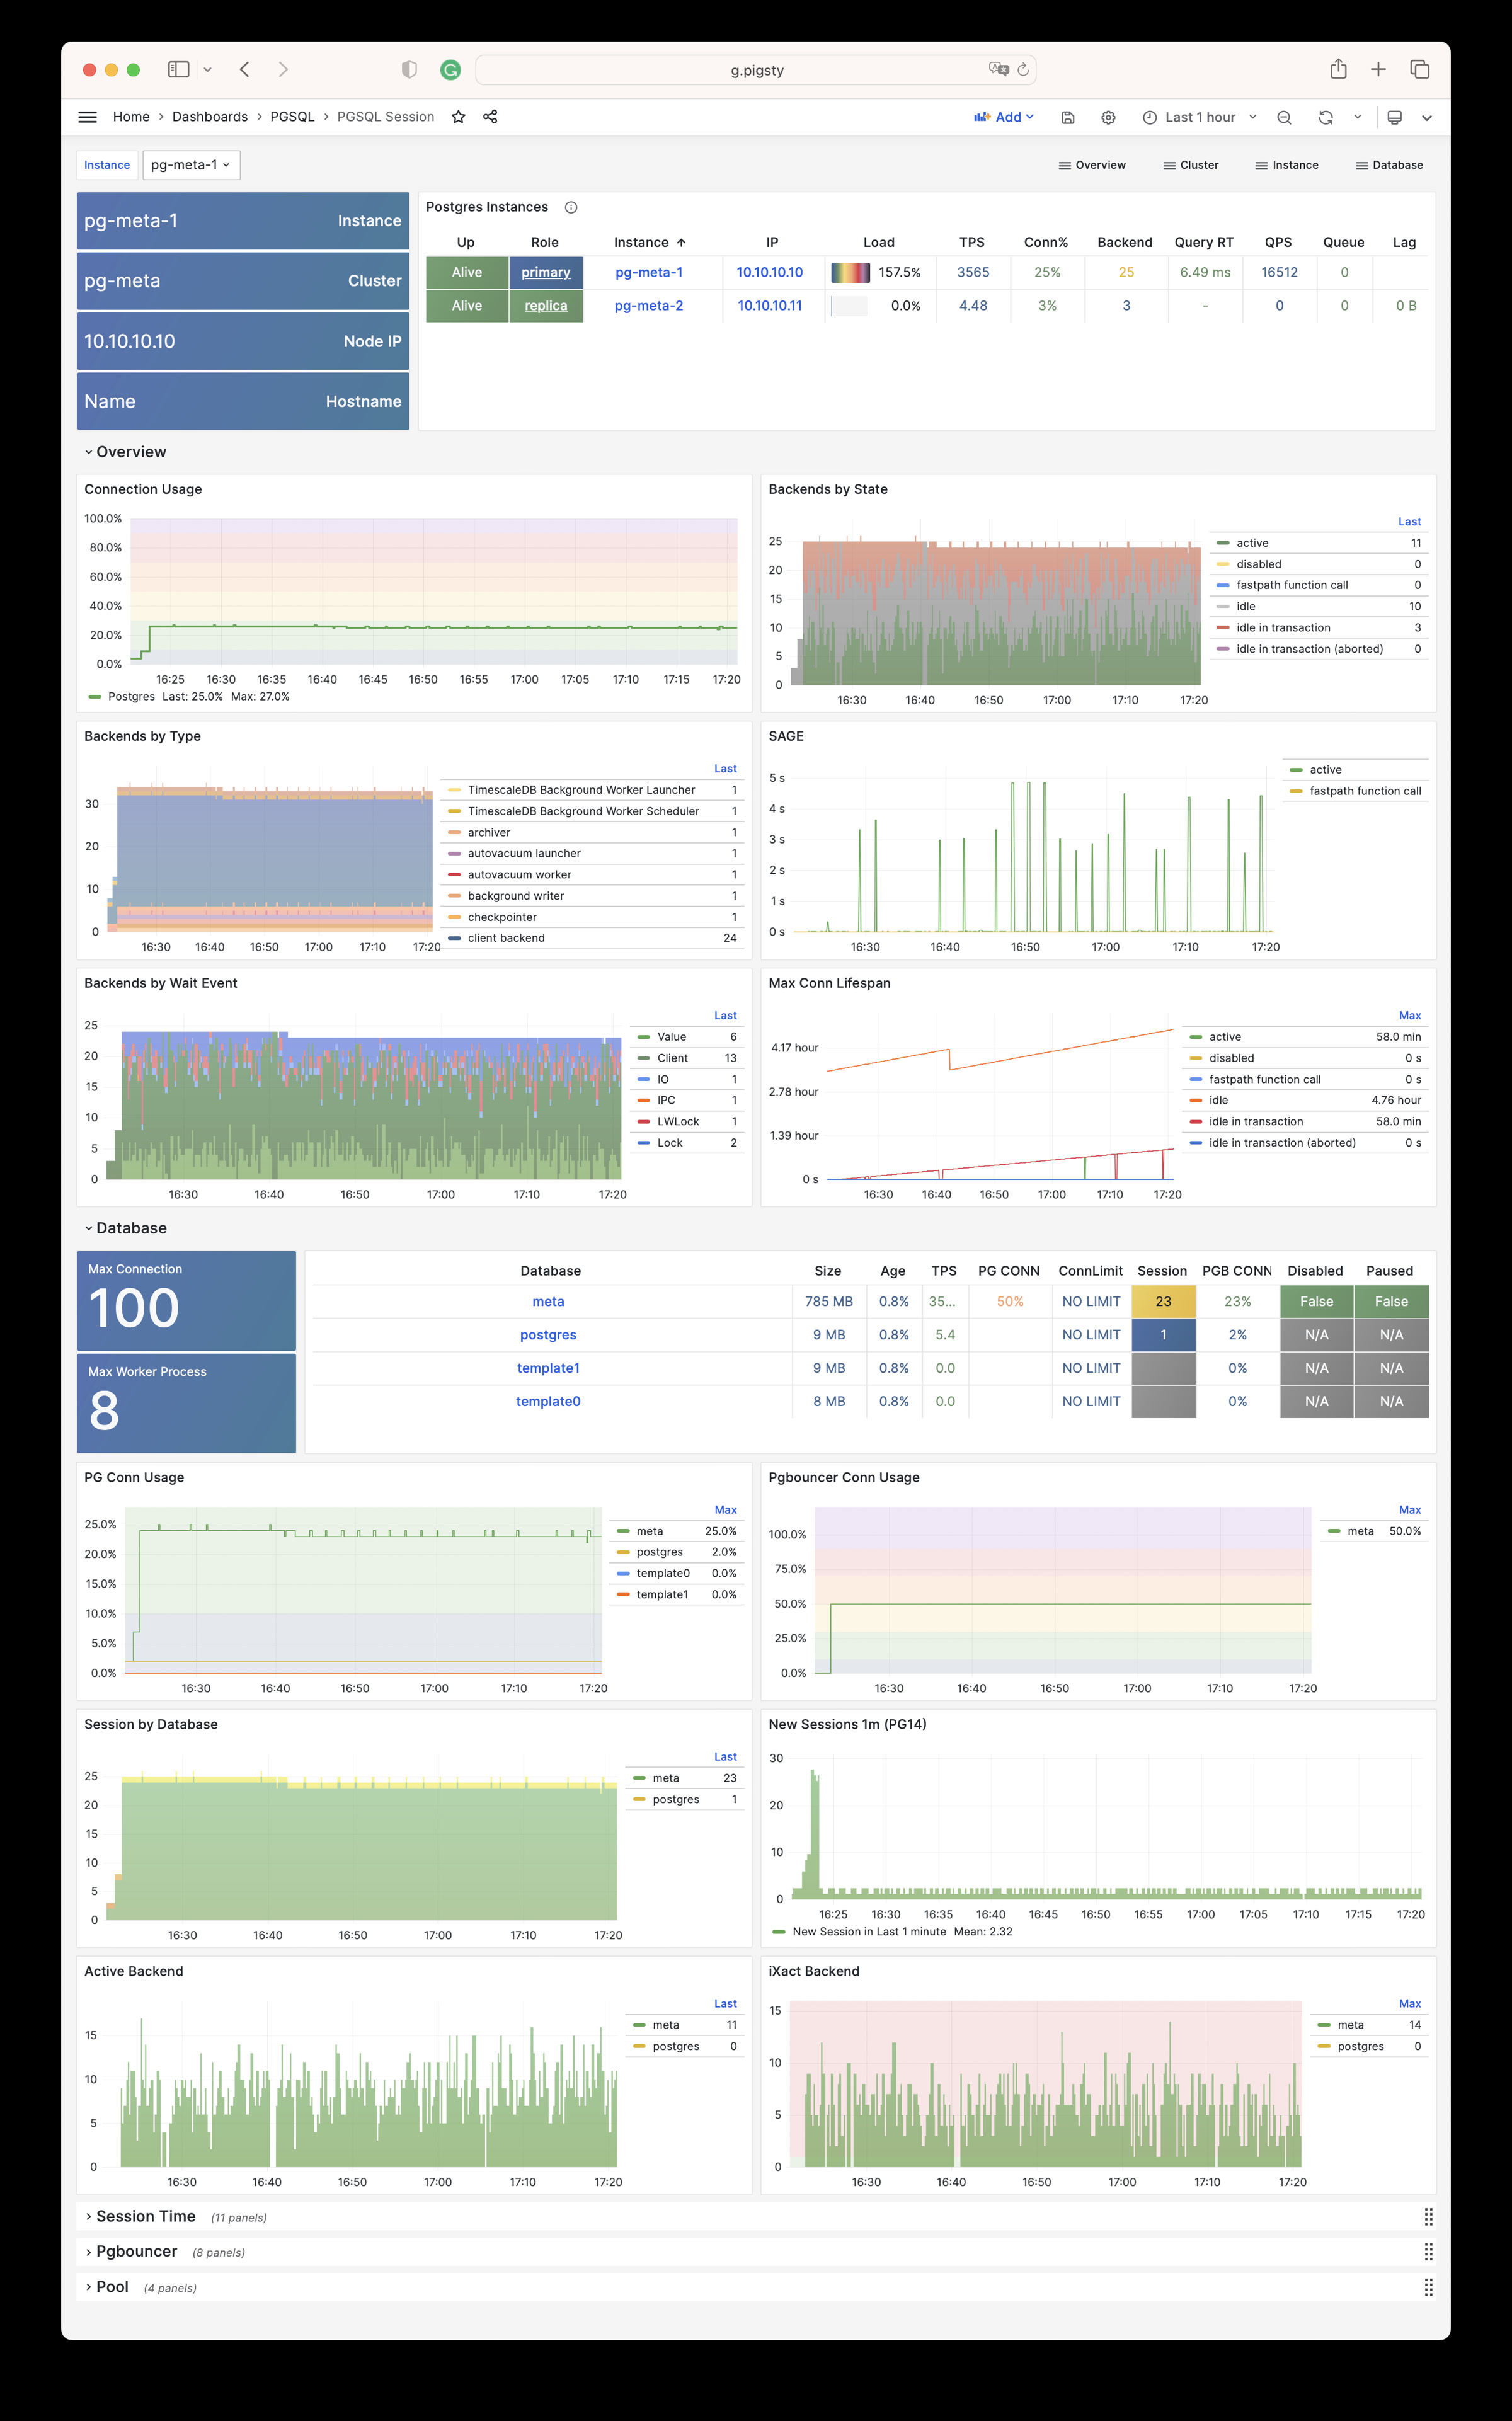
- pgsql-session: Session and active/idle time metrics in a single instance
- pgsql-xacts: Metrics related to transactions, locks, TPS/QPS
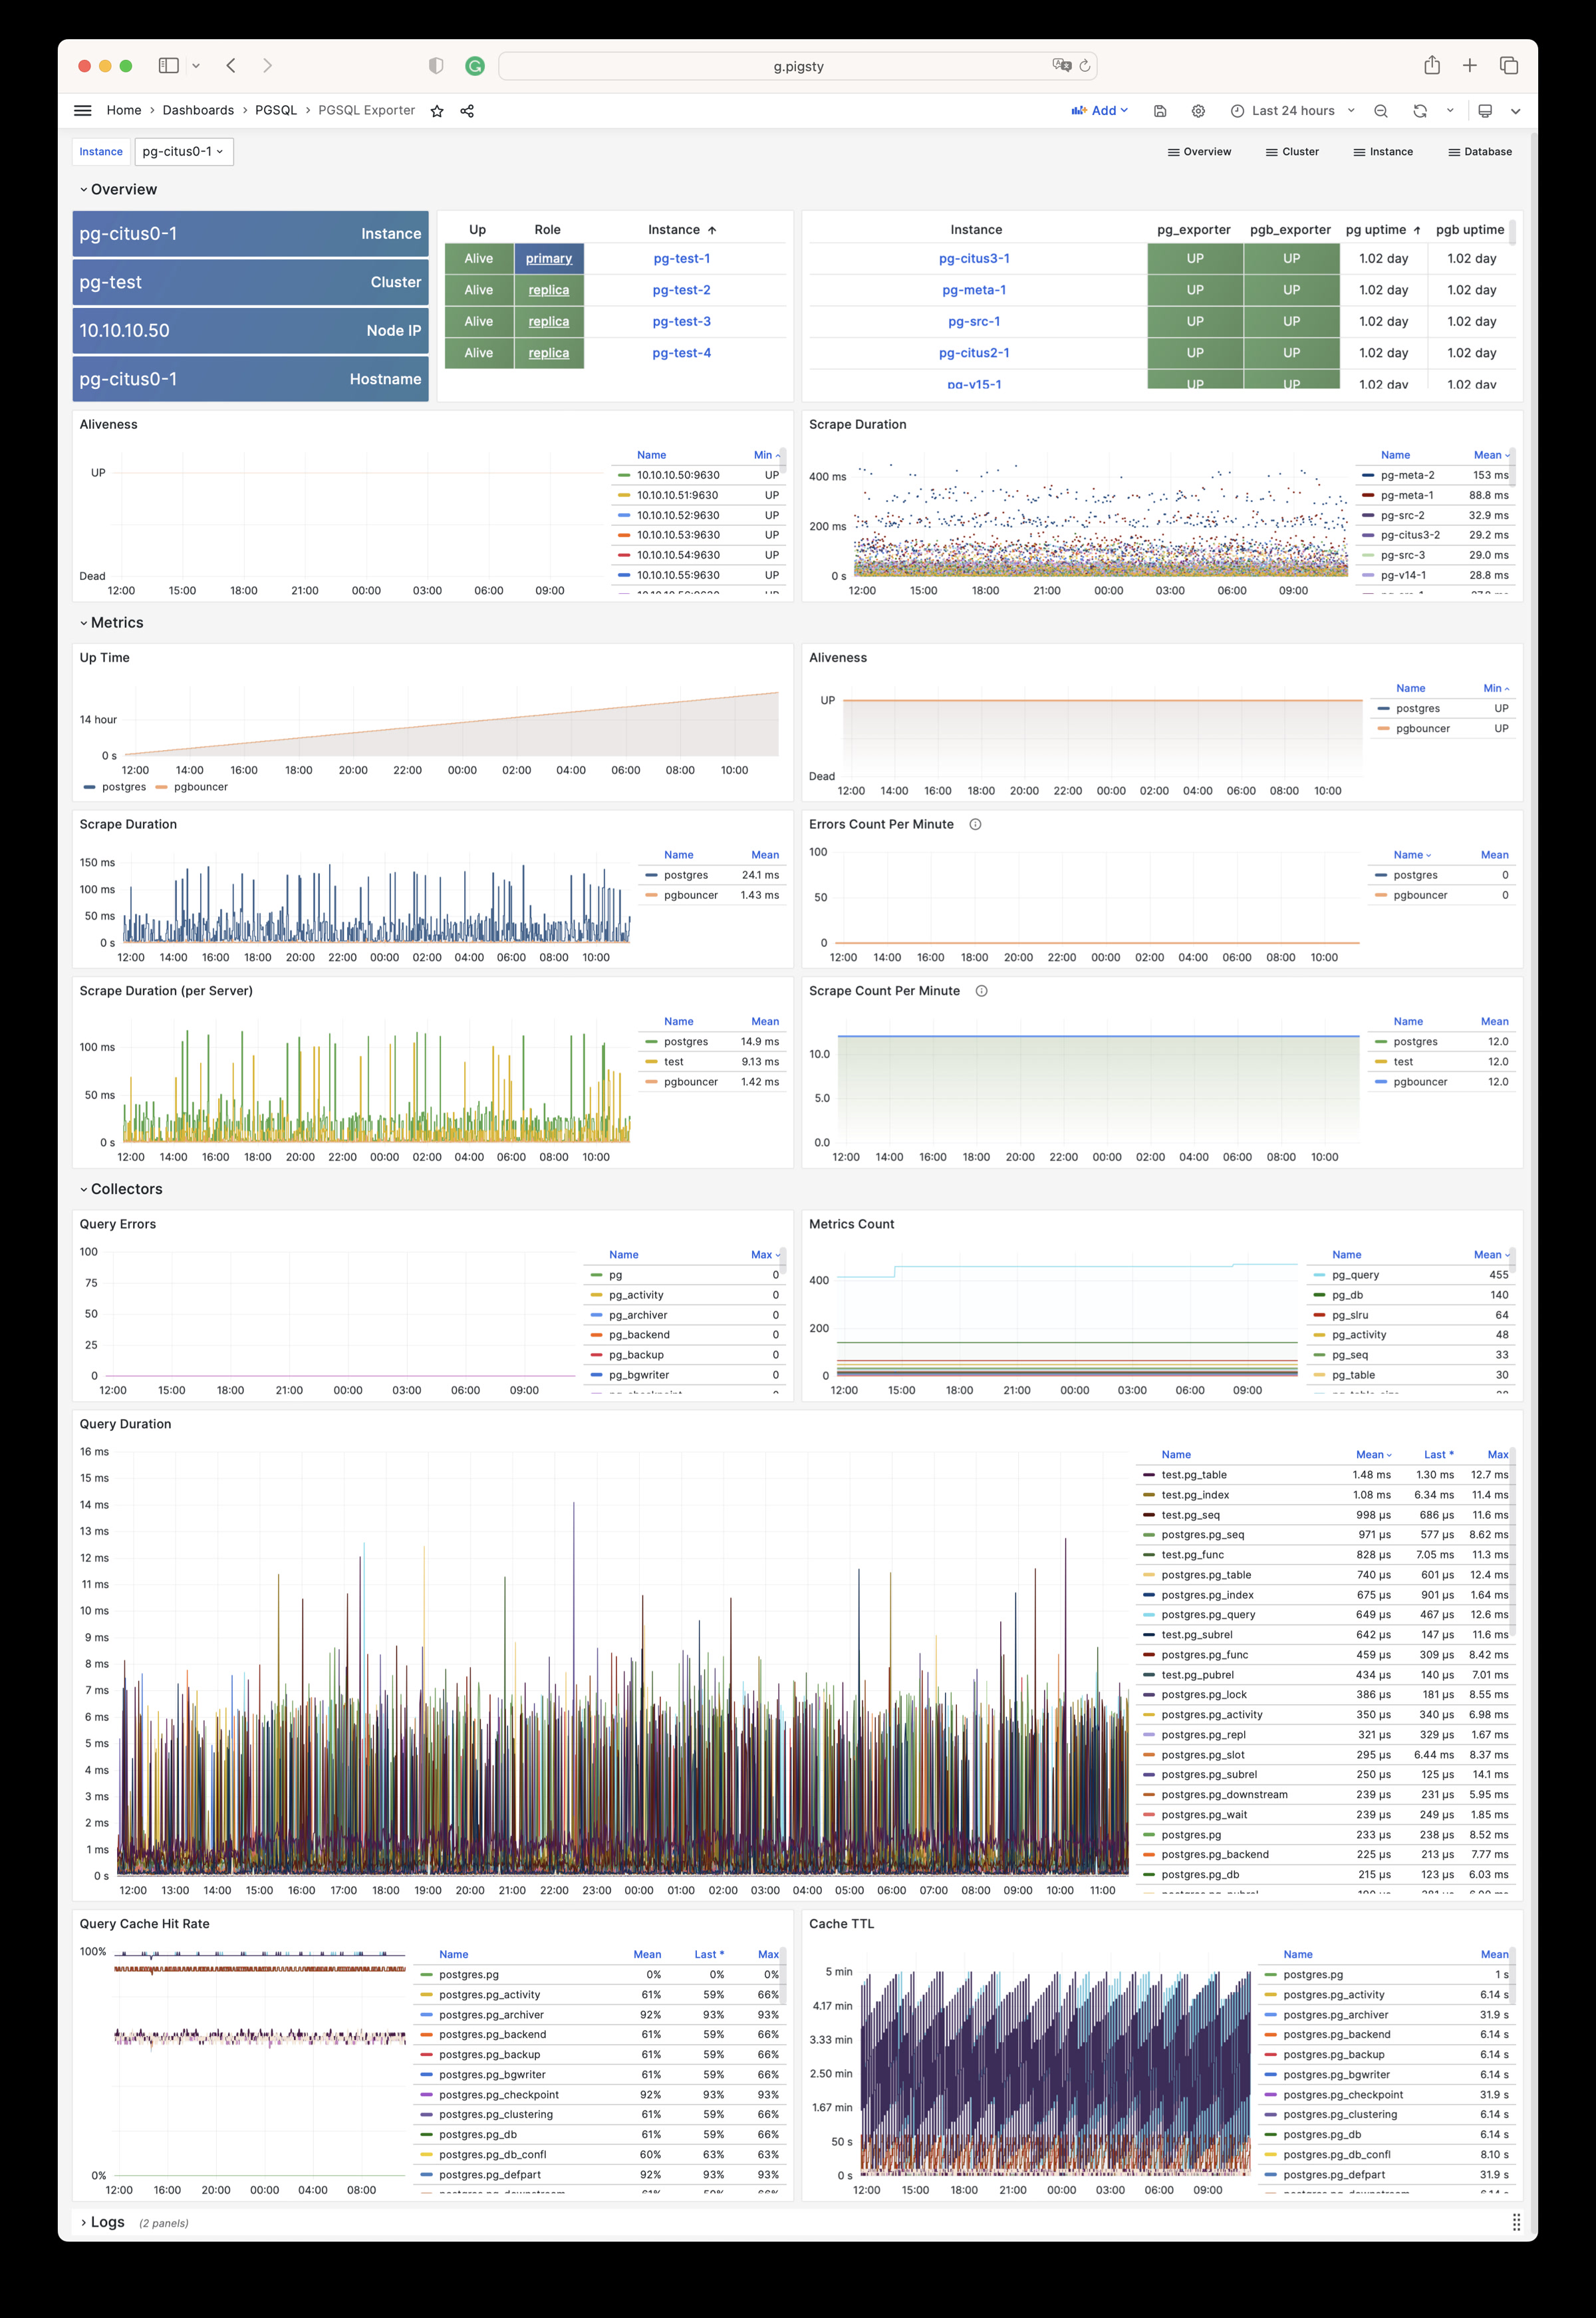
- pgsql-exporter: Self-monitoring metrics for Postgres and Pgbouncer monitoring components
Database
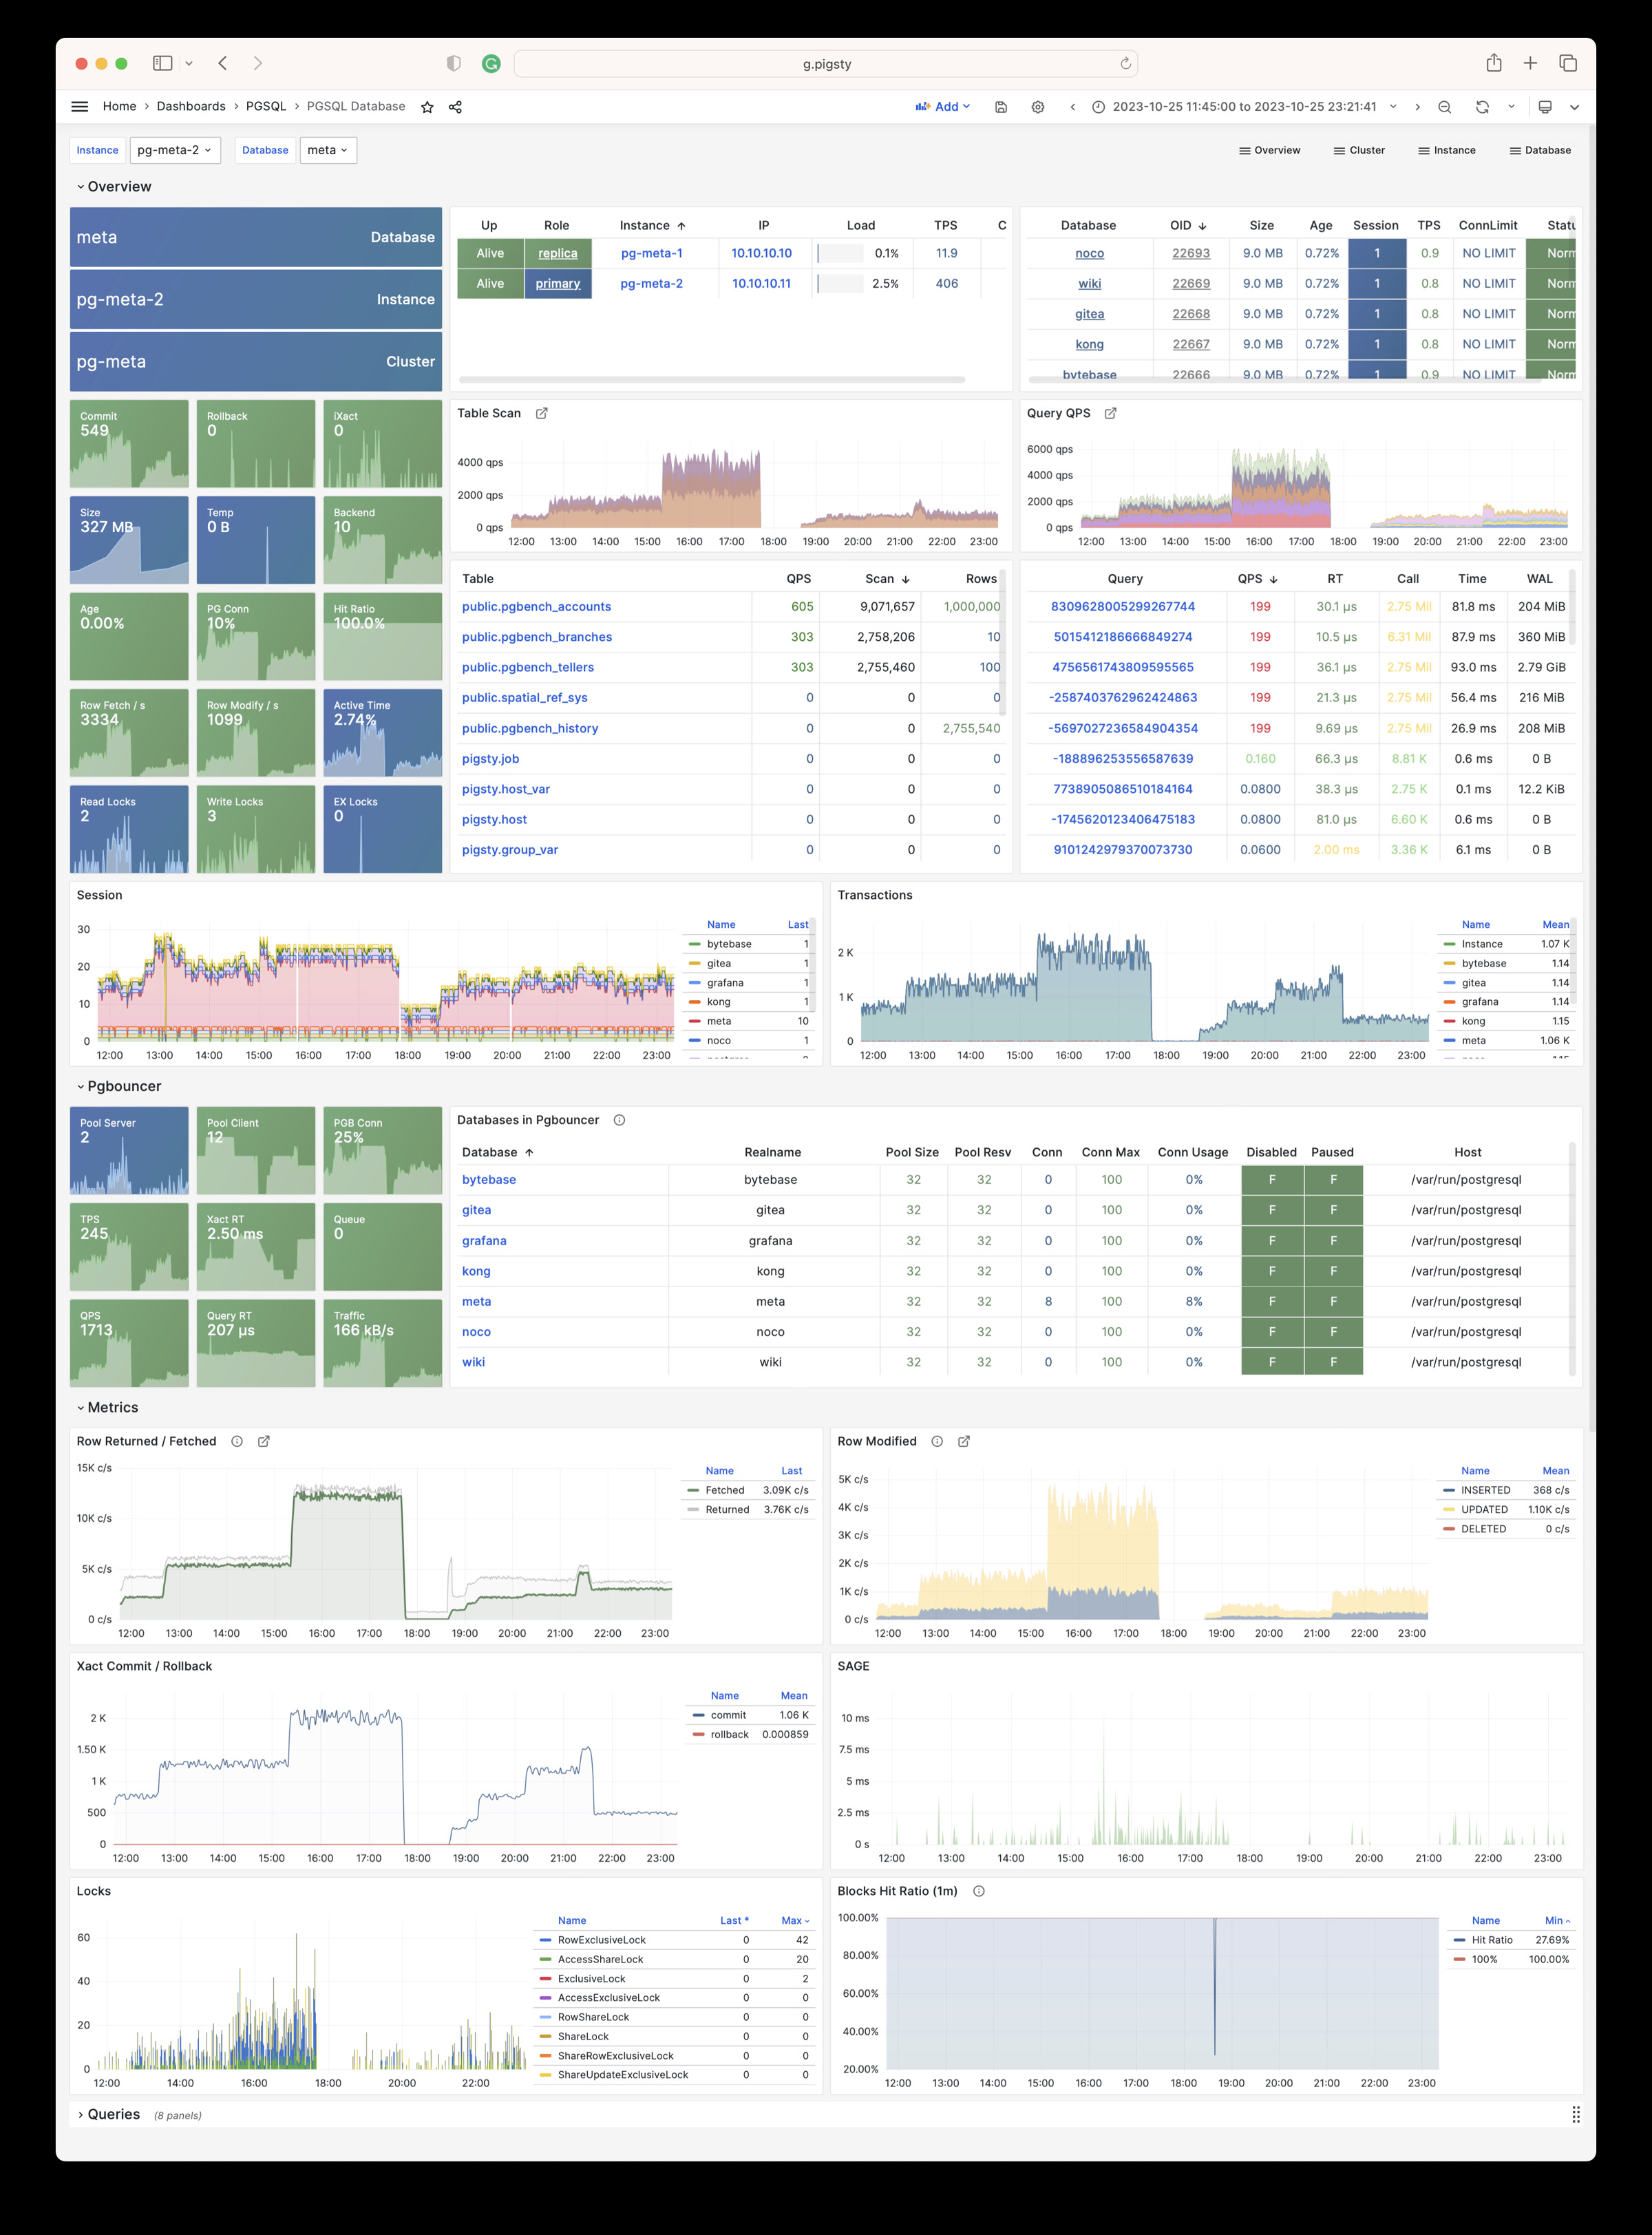
- pgsql-database: Main dashboard for a single PGSQL database
- pgcat-database: Database information retrieved directly from the database catalog
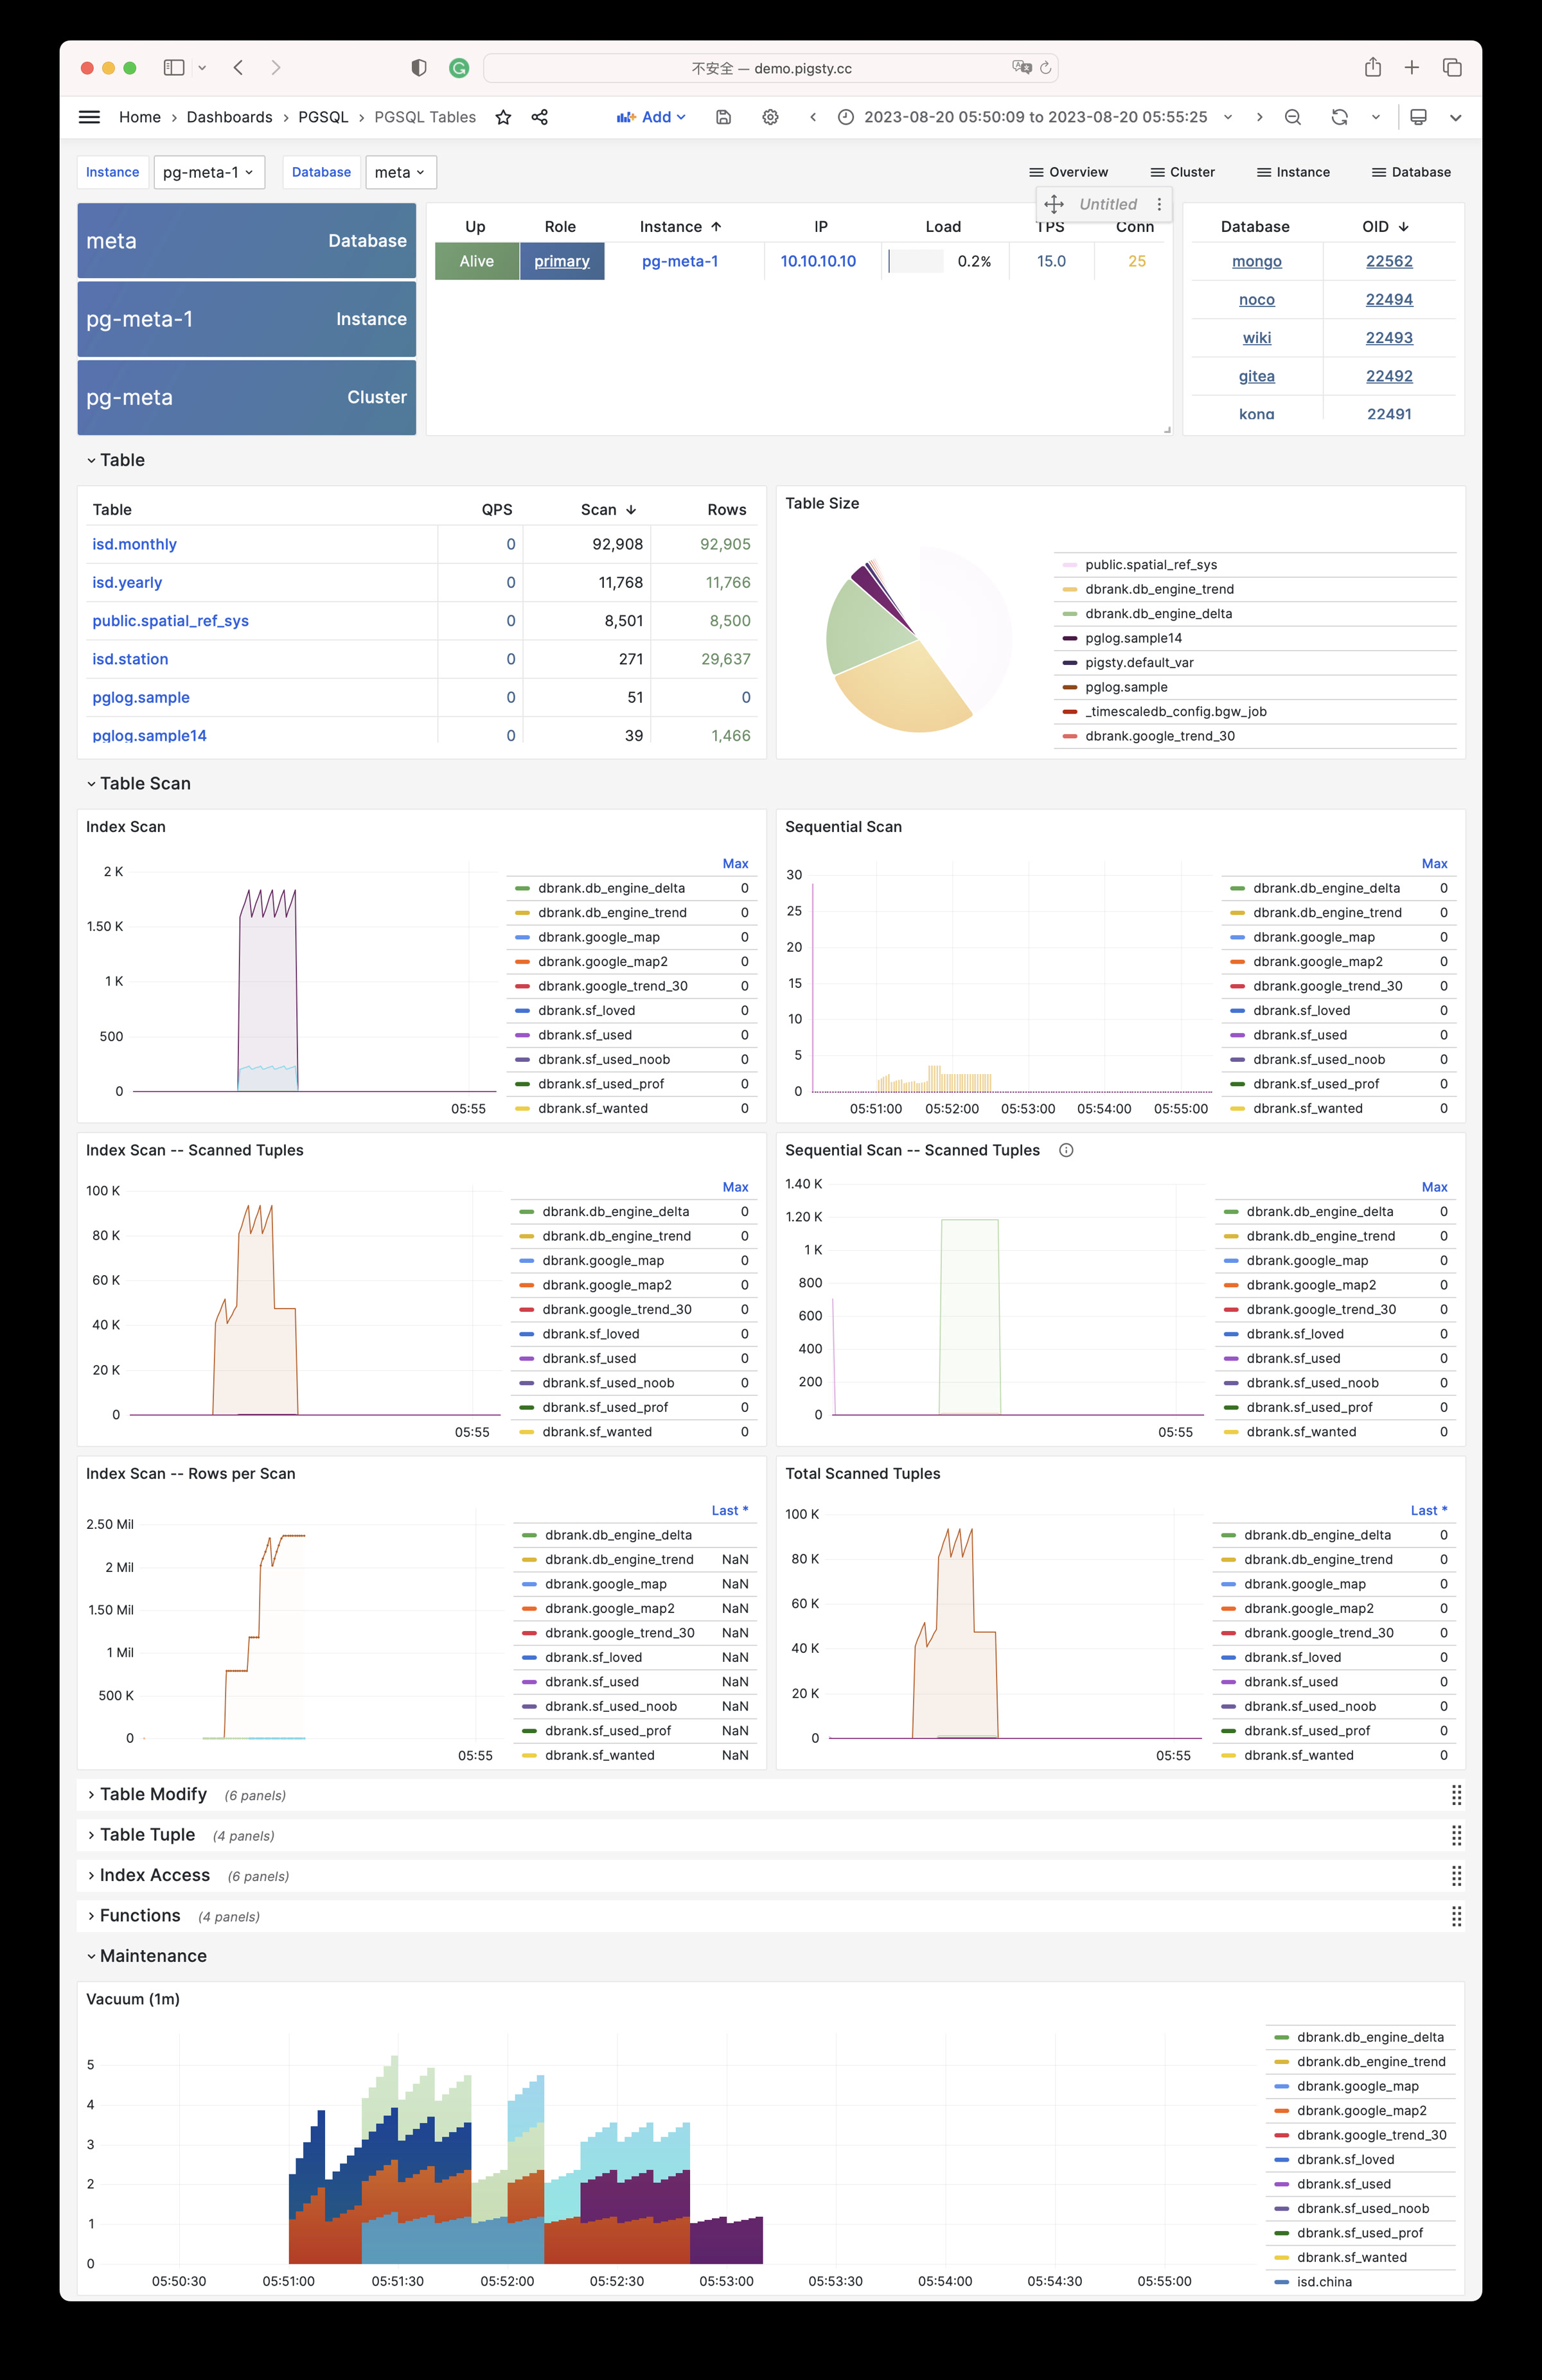
- pgsql-tables: Table/index access metrics within a single database
- pgsql-table: Details of a single table (QPS/RT/index/sequences…)
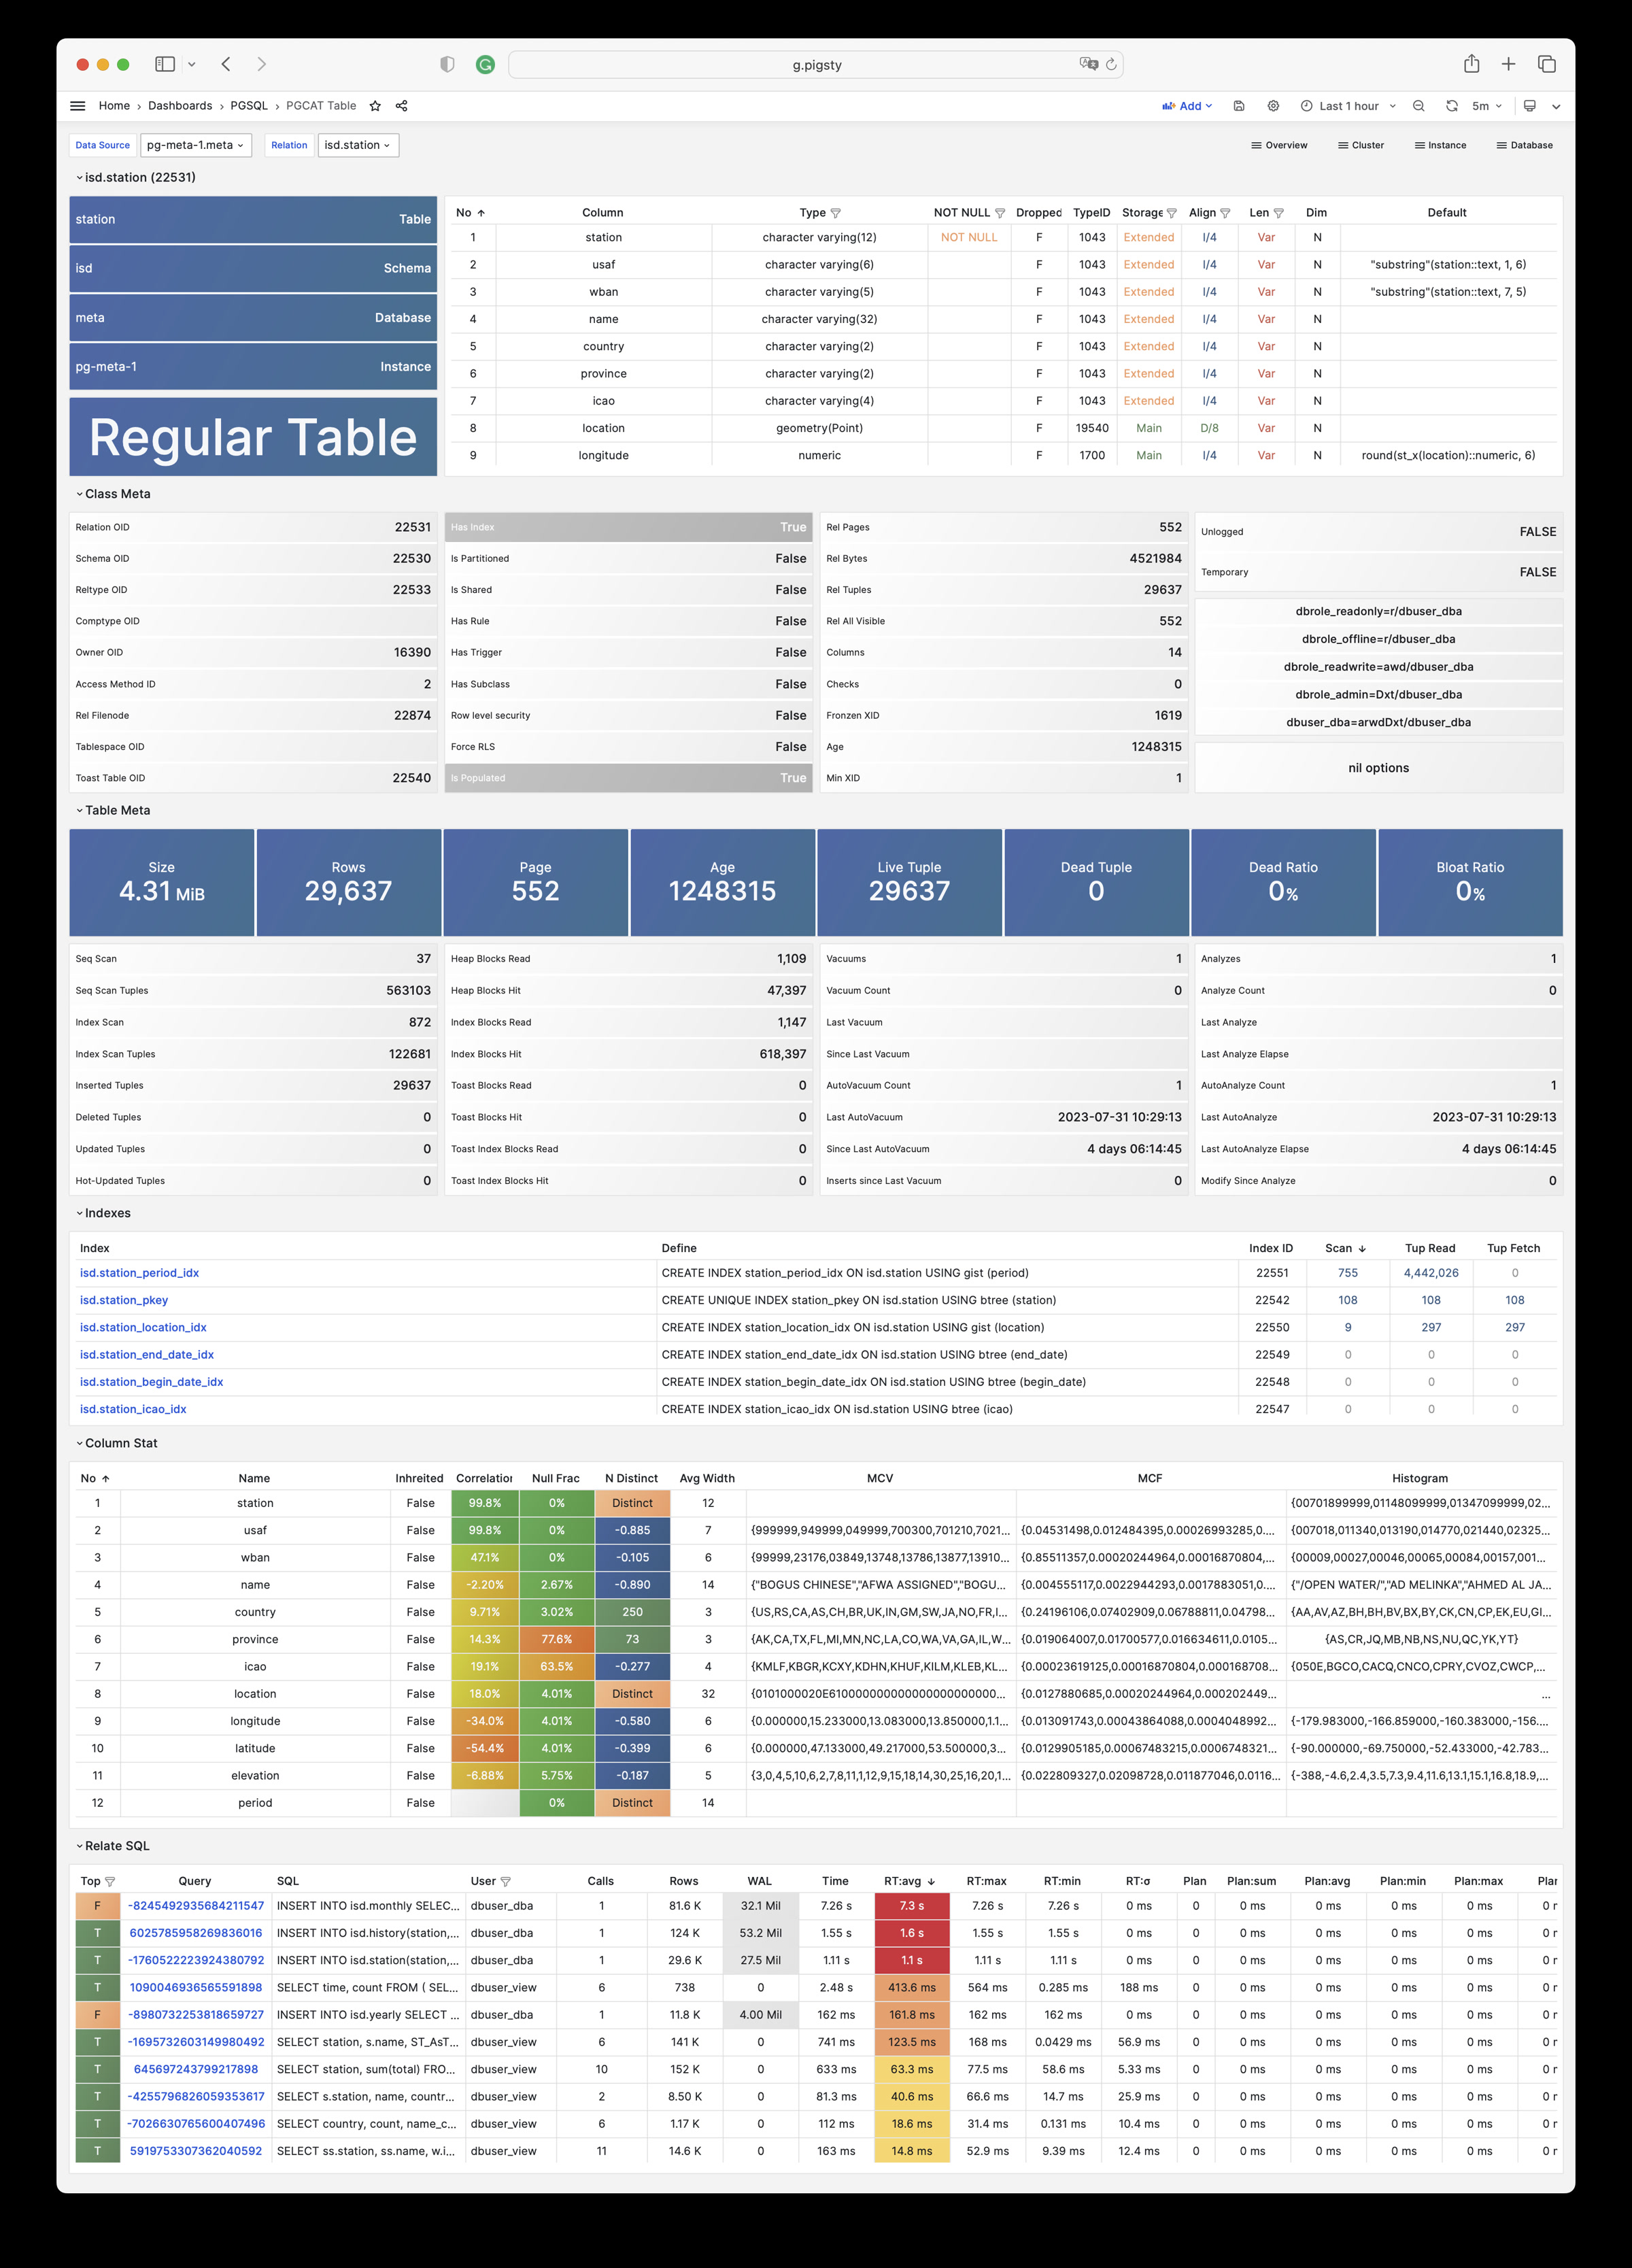
- pgcat-table: Details of a single table retrieved directly from the database catalog (stats/bloat…)
- pgsql-query: Details of a single query (QPS/RT)
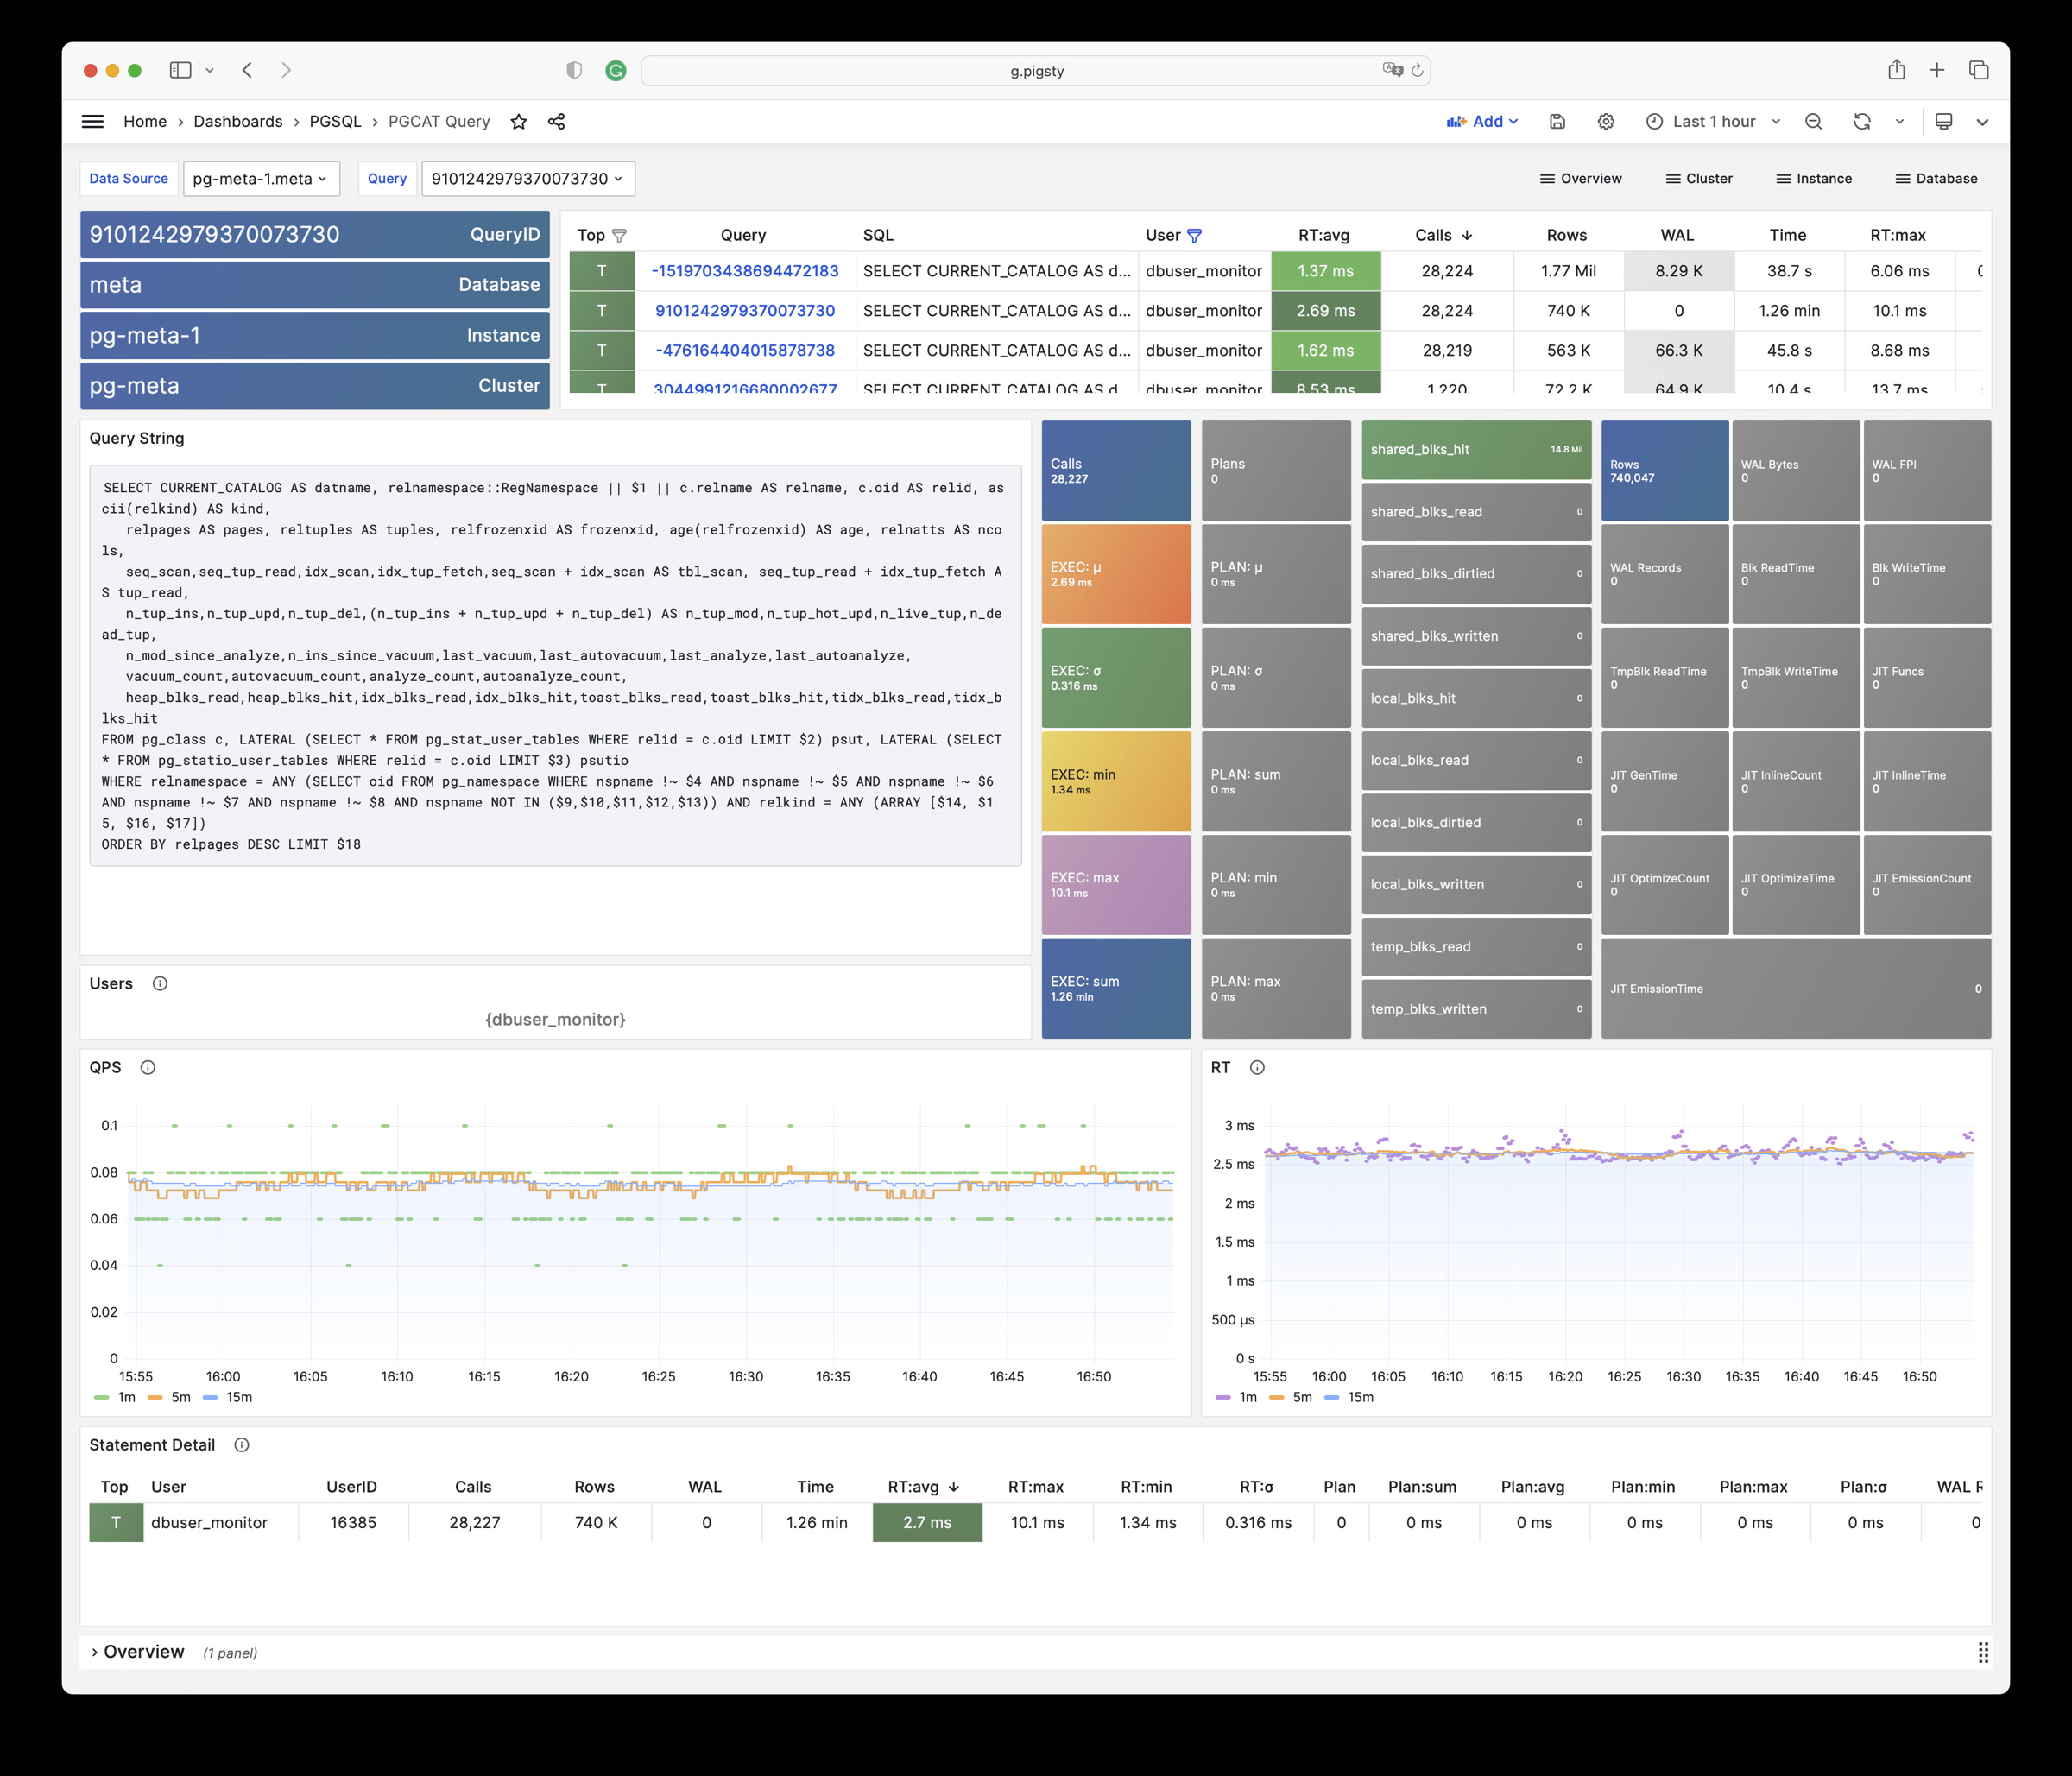
- pgcat-query: Details of a single query retrieved directly from the database catalog (SQL/stats)
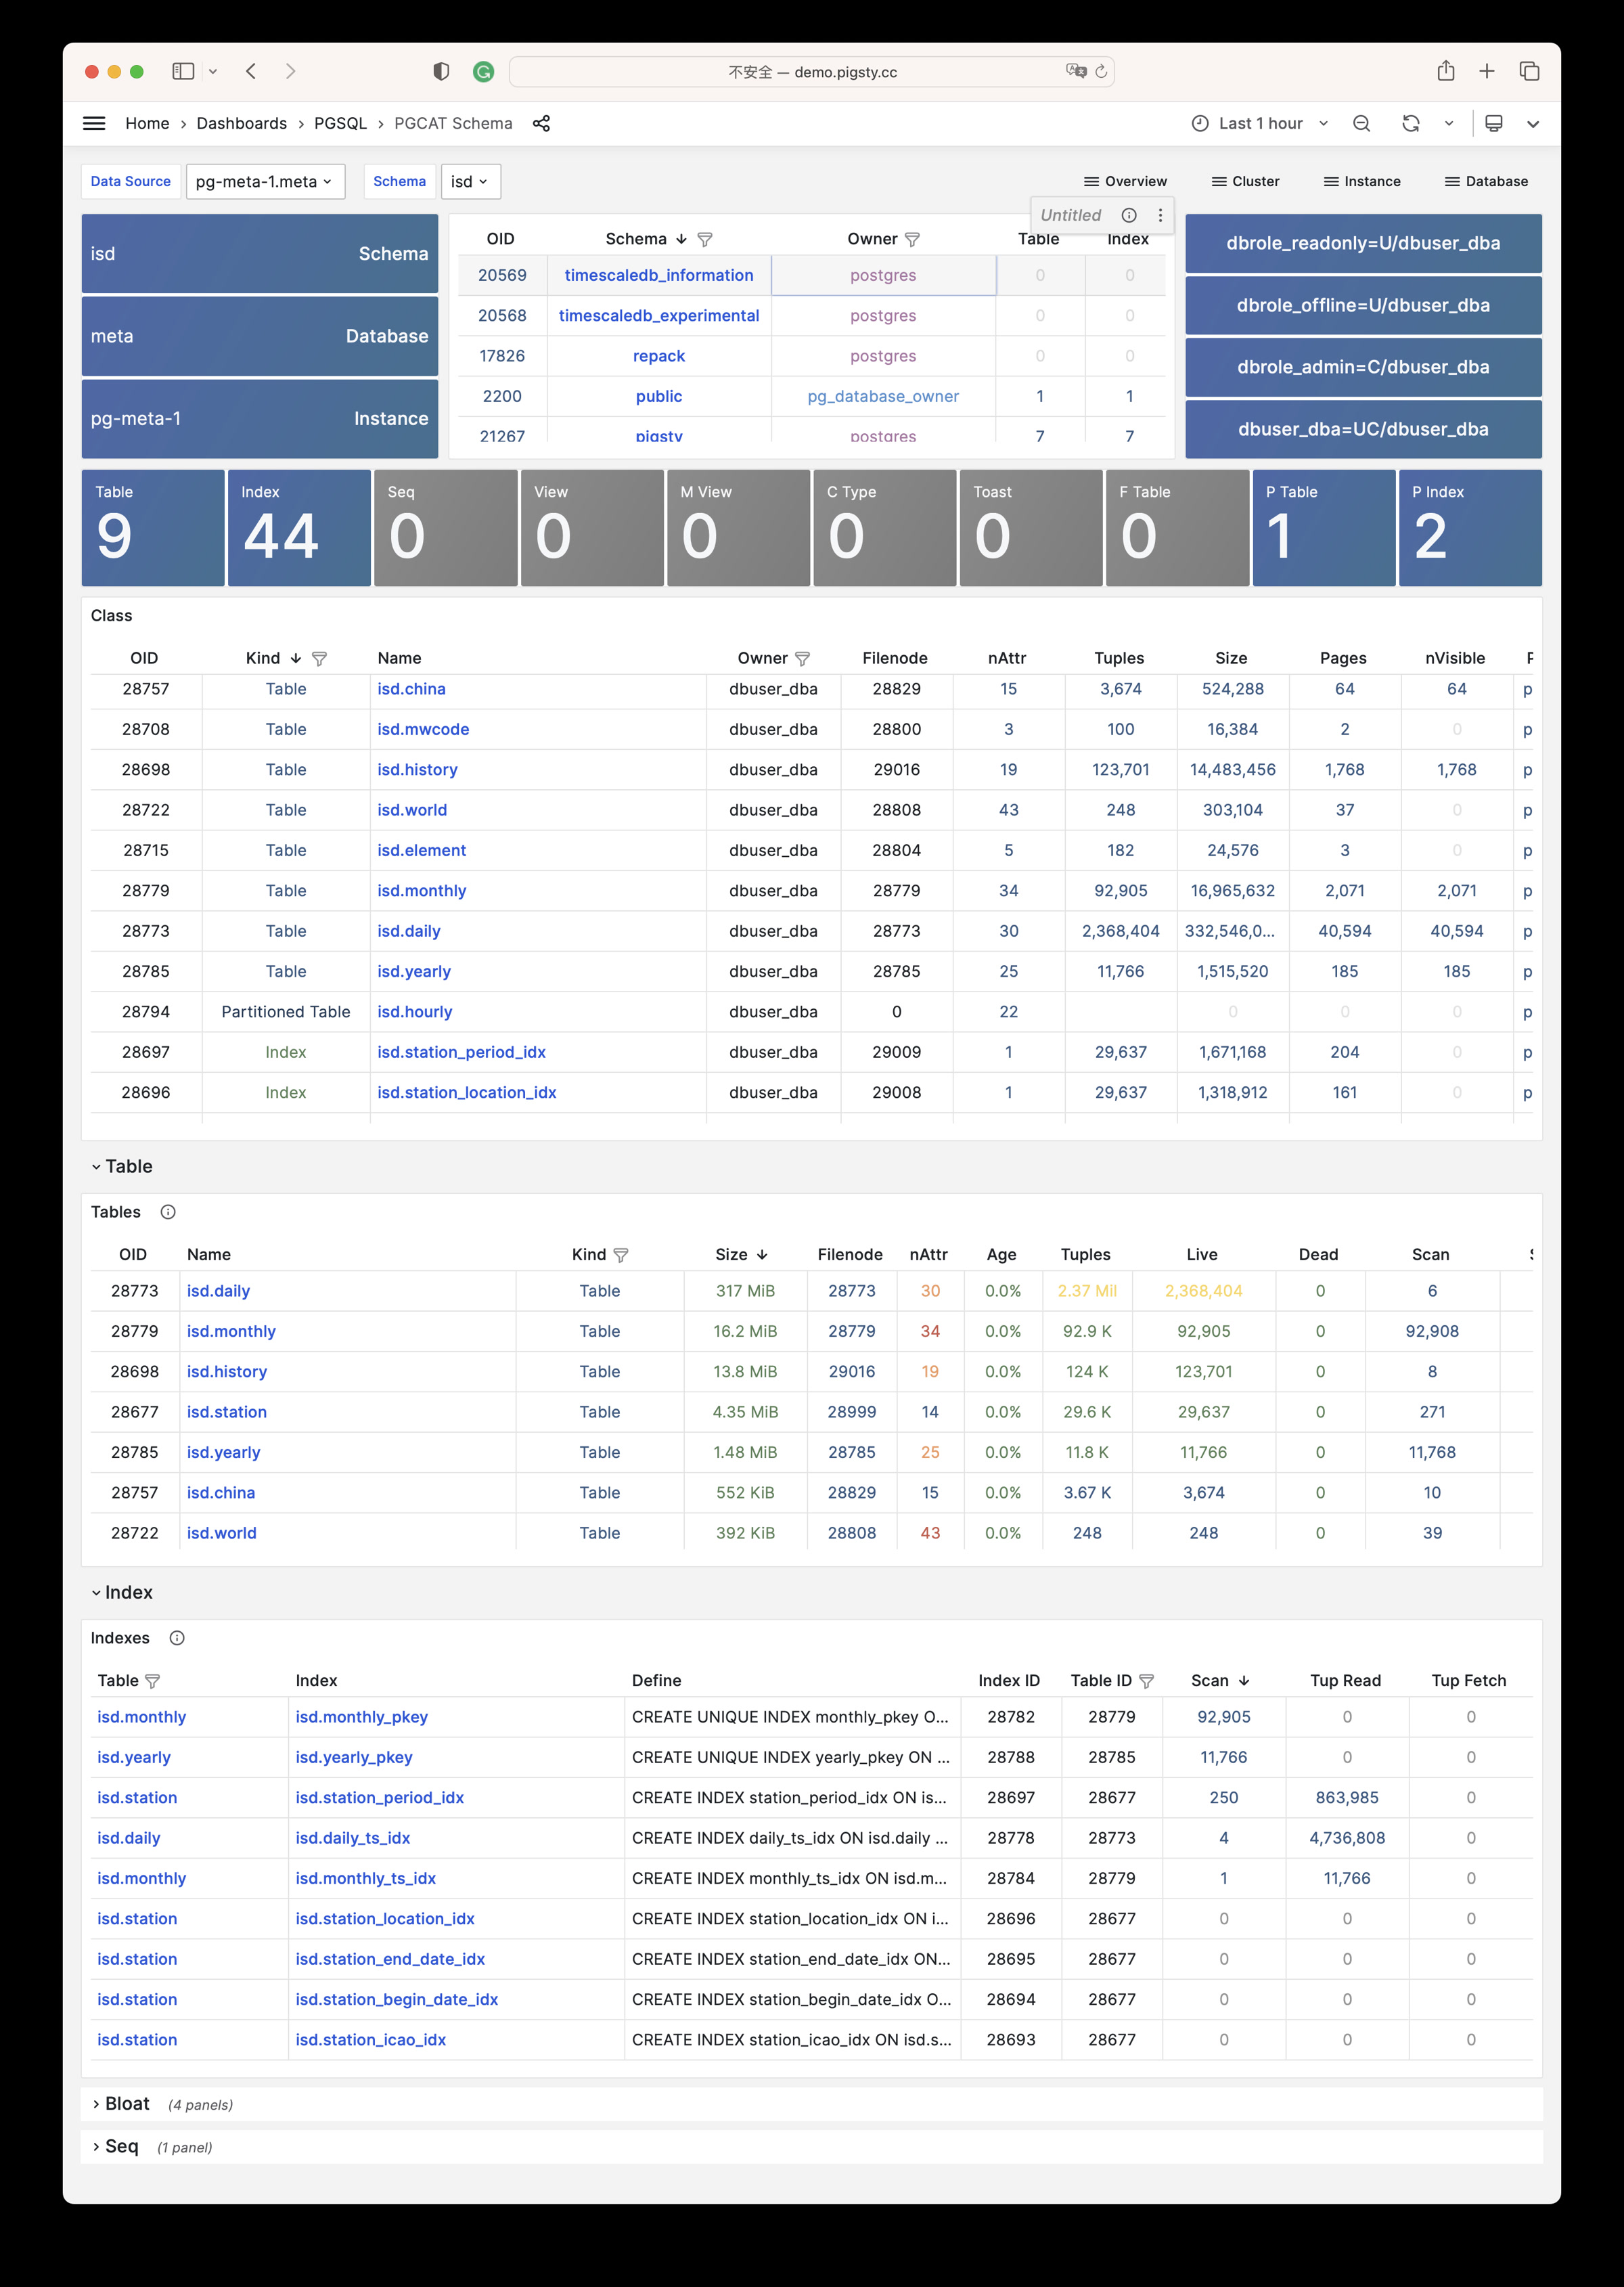
- pgcat-schema: Information about schemas retrieved directly from the database catalog (tables/indexes/sequences…)
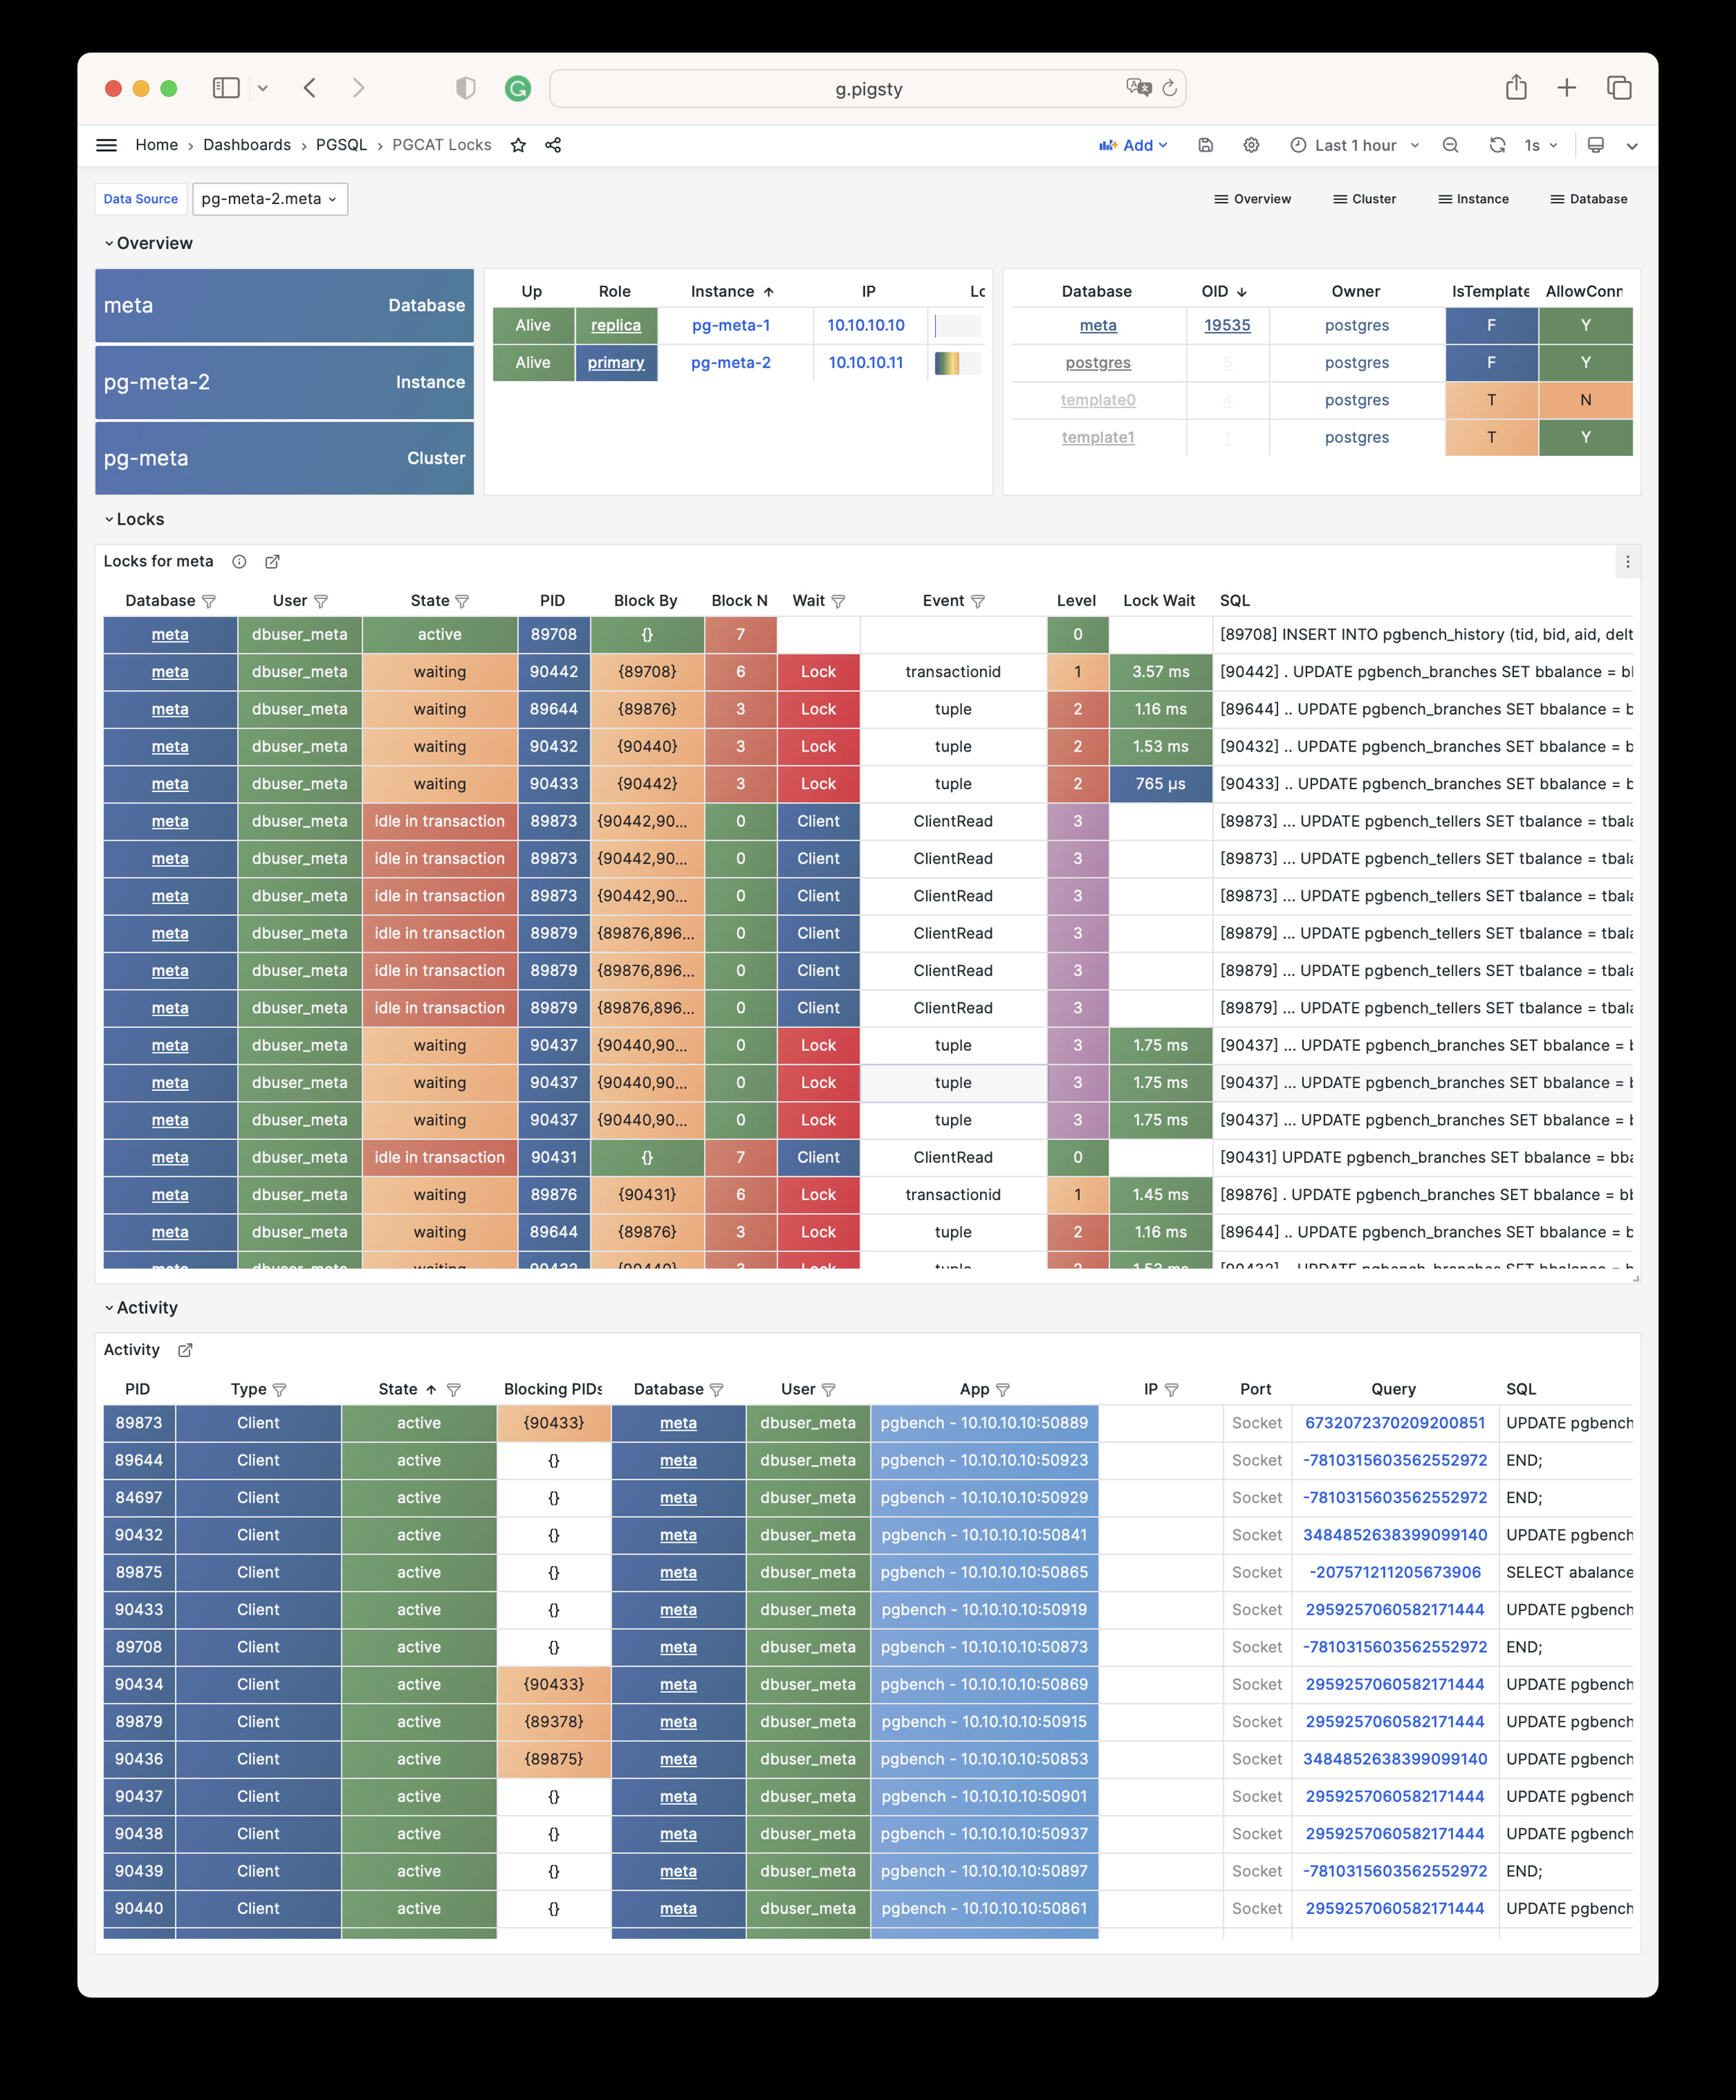
- pgcat-locks: Information about activities and lock waits retrieved directly from the database catalog
Overview
PGSQL Overview: Main dashboard for the PGSQL module
PGSQL Overview
PGSQL Alert: Global critical metrics overview and alert event listing for PGSQL
PGSQL Alert
PGSQL Shard: Shows horizontal metric comparisons within a PGSQL horizontally sharded cluster, such as CITUS / GPSQL clusters
PGSQL Shard
Cluster
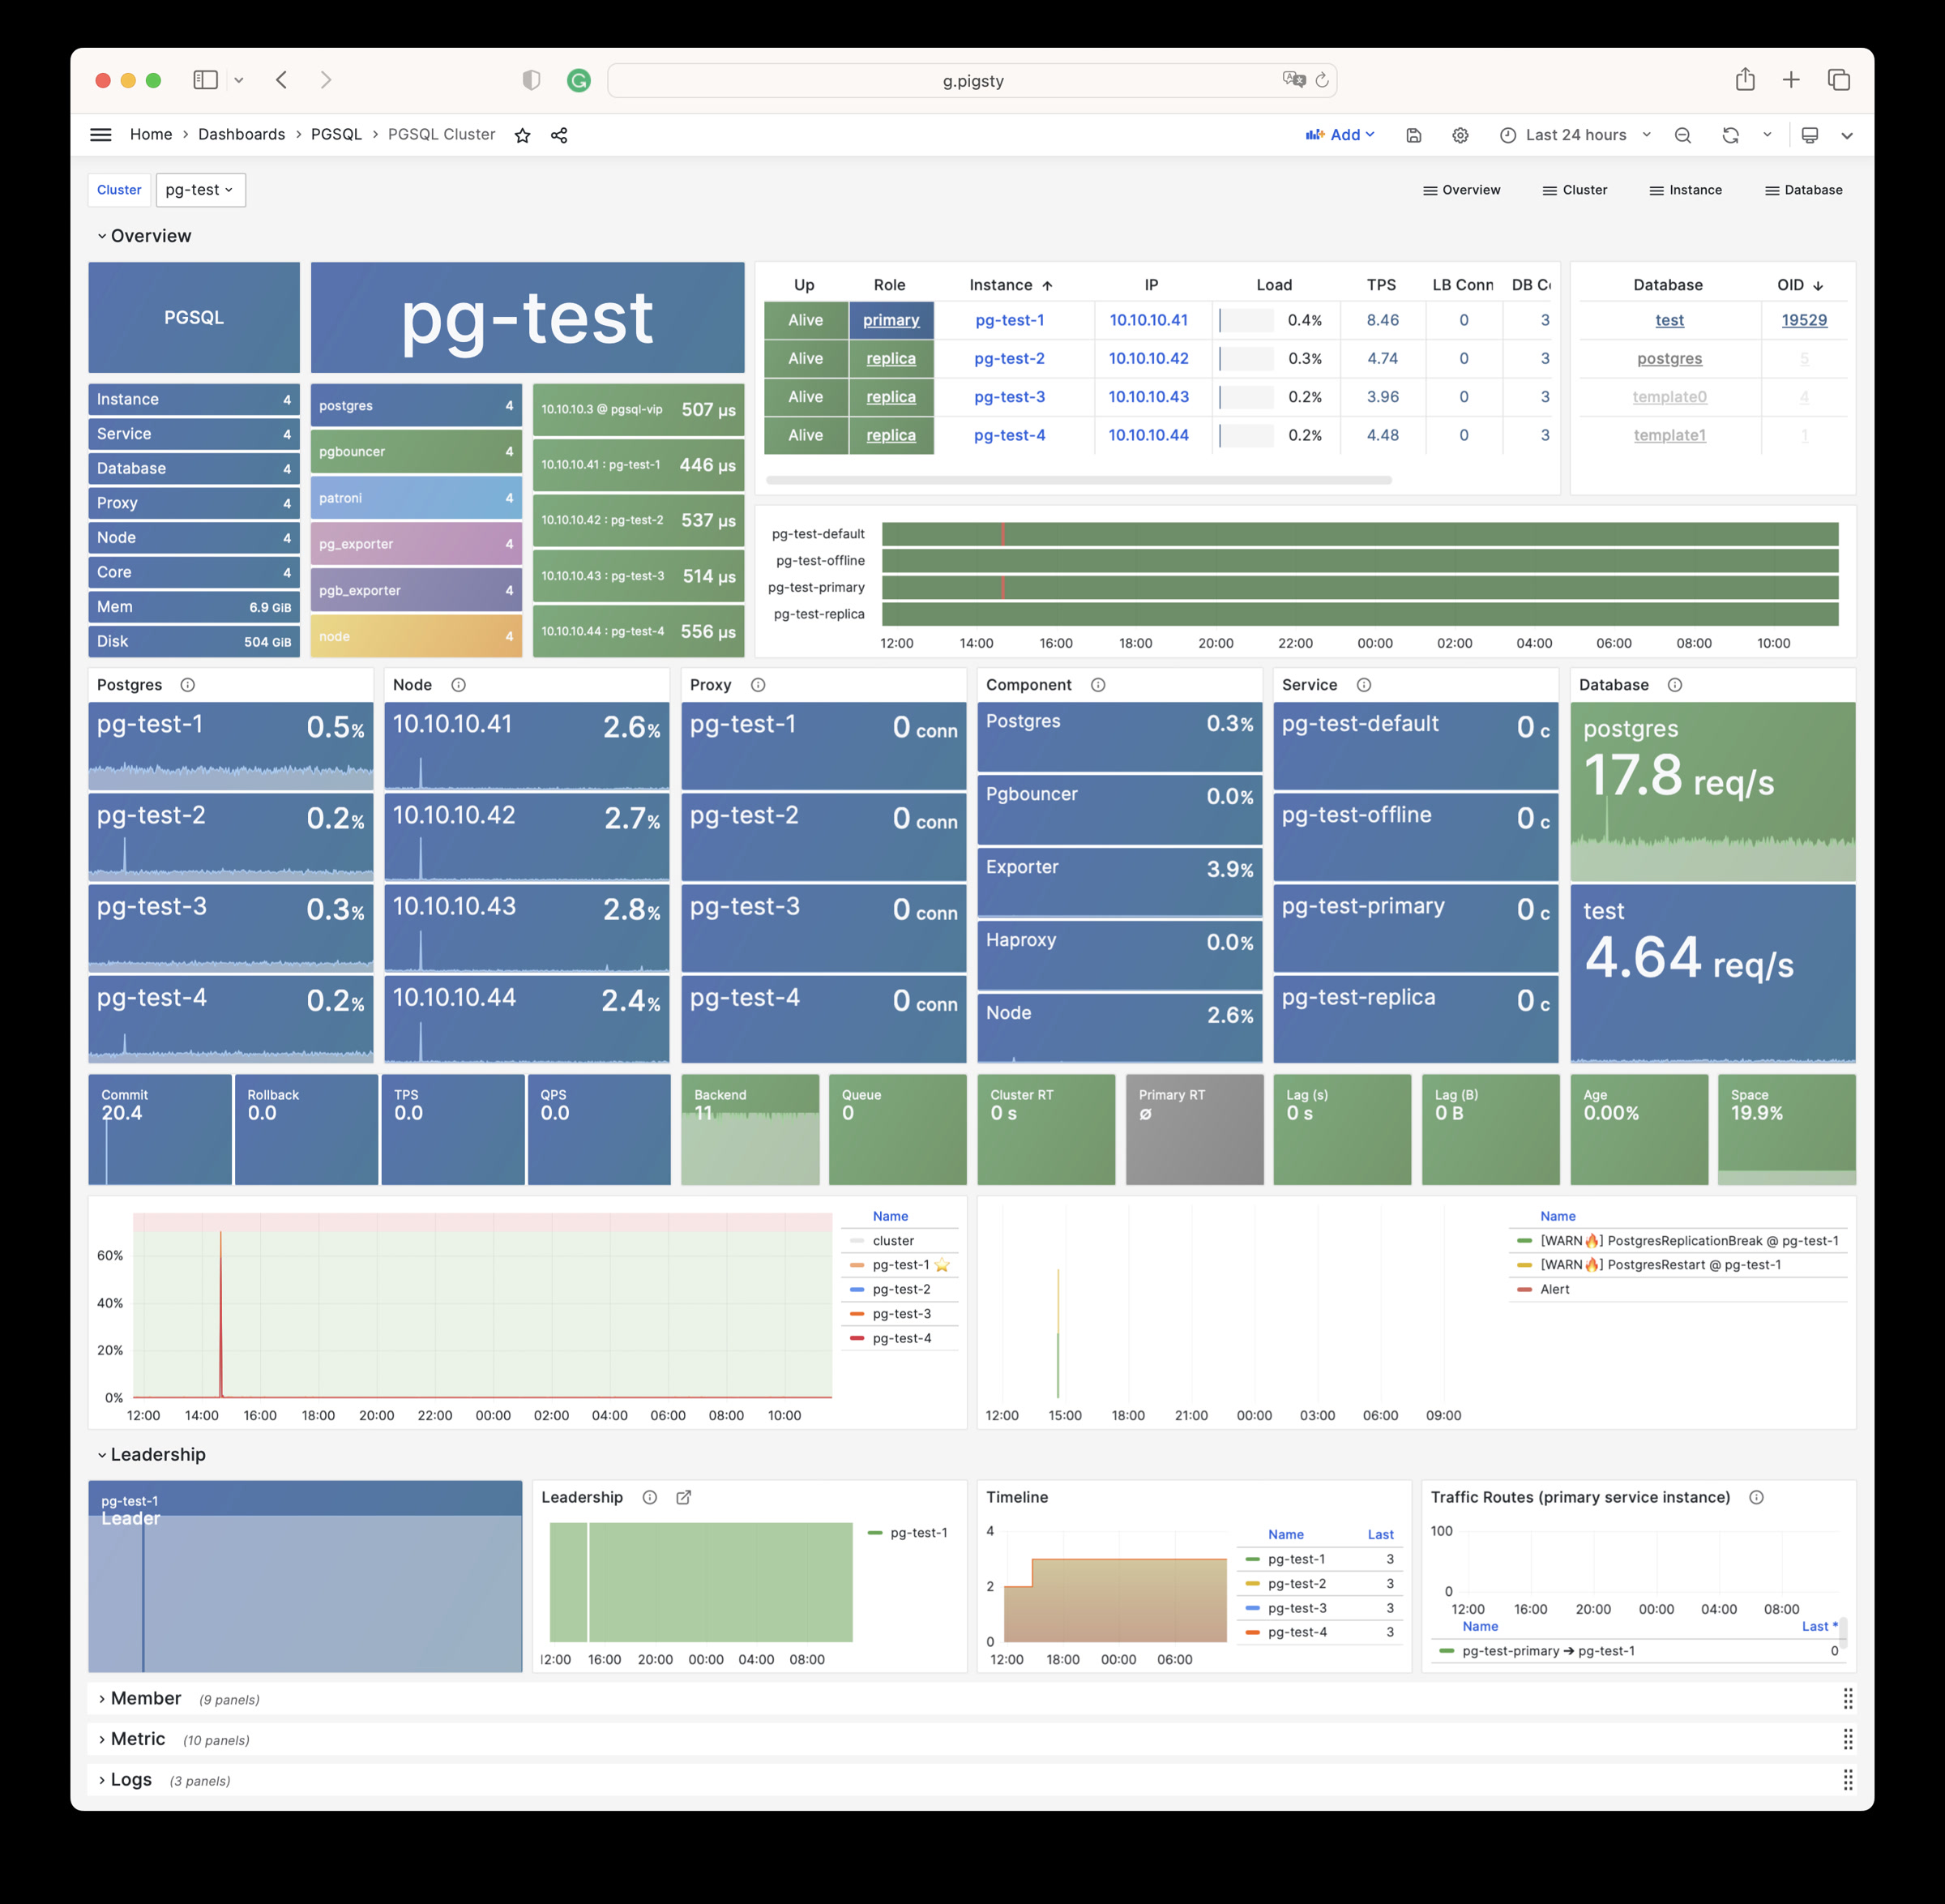
PGSQL Cluster: Main dashboard for a PGSQL cluster
PGSQL Cluster
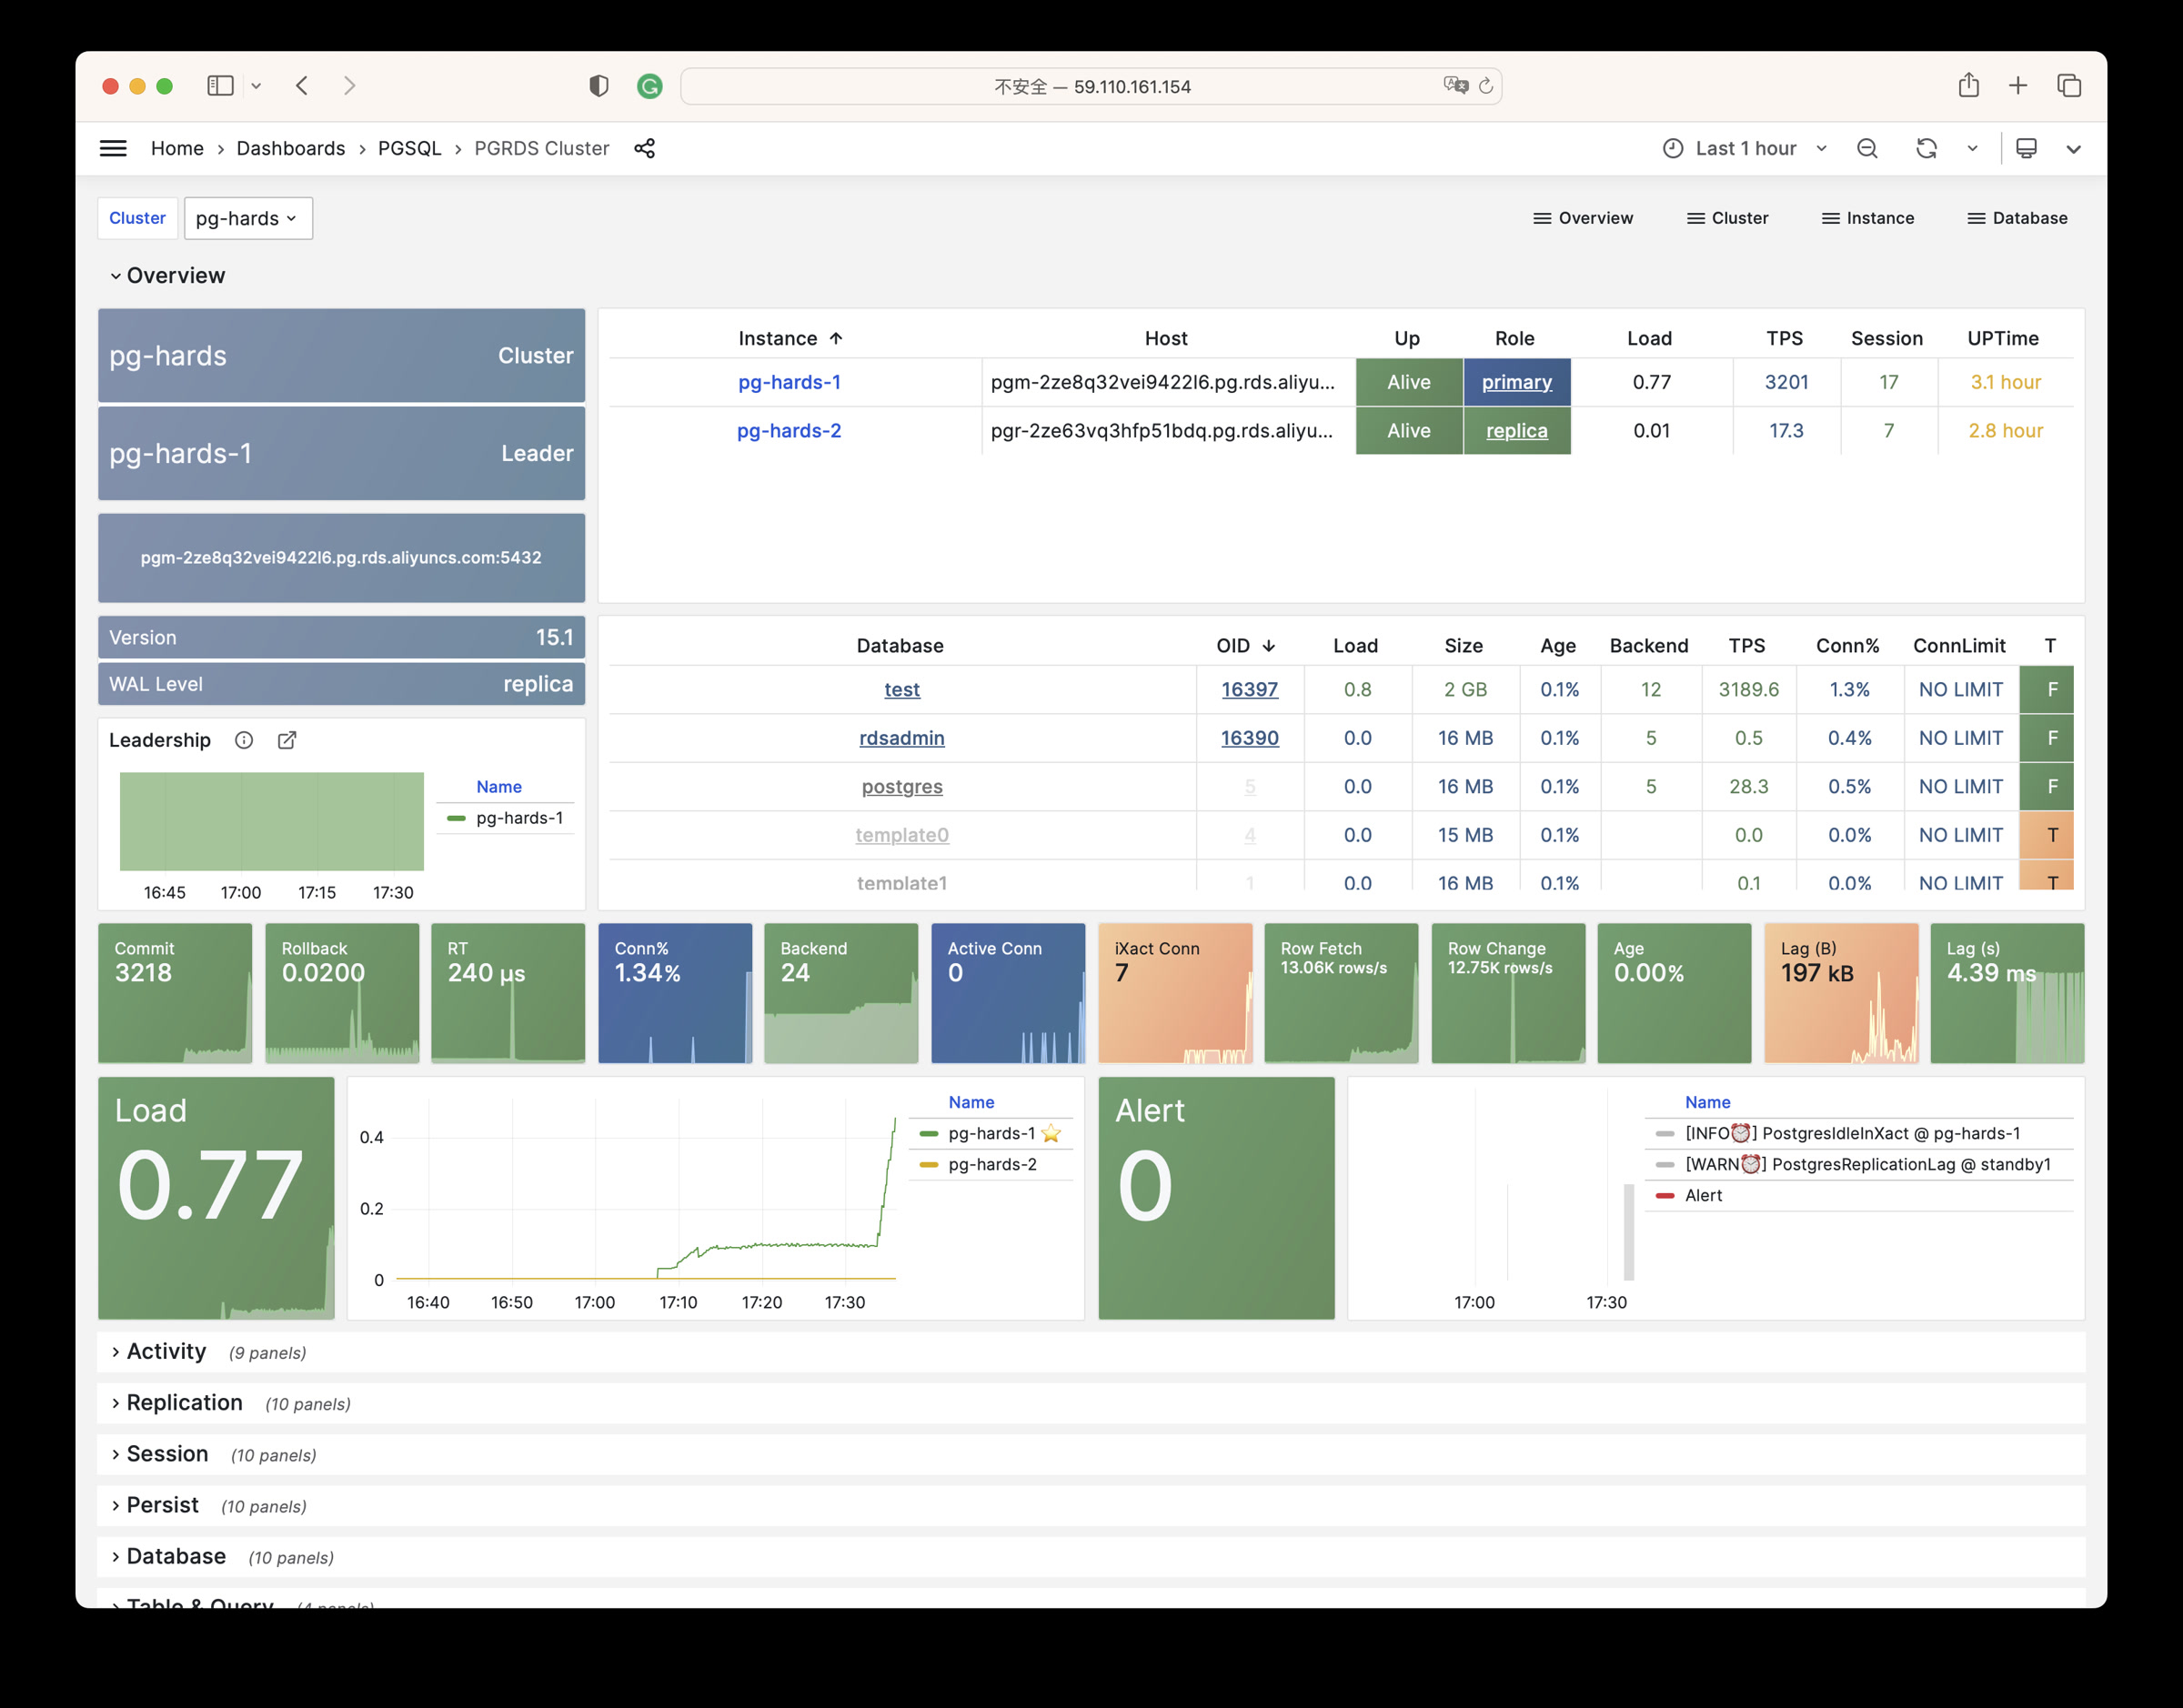
PGRDS Cluster: RDS version of PGSQL Cluster, focused on all PostgreSQL-specific metrics
PGRDS Cluster
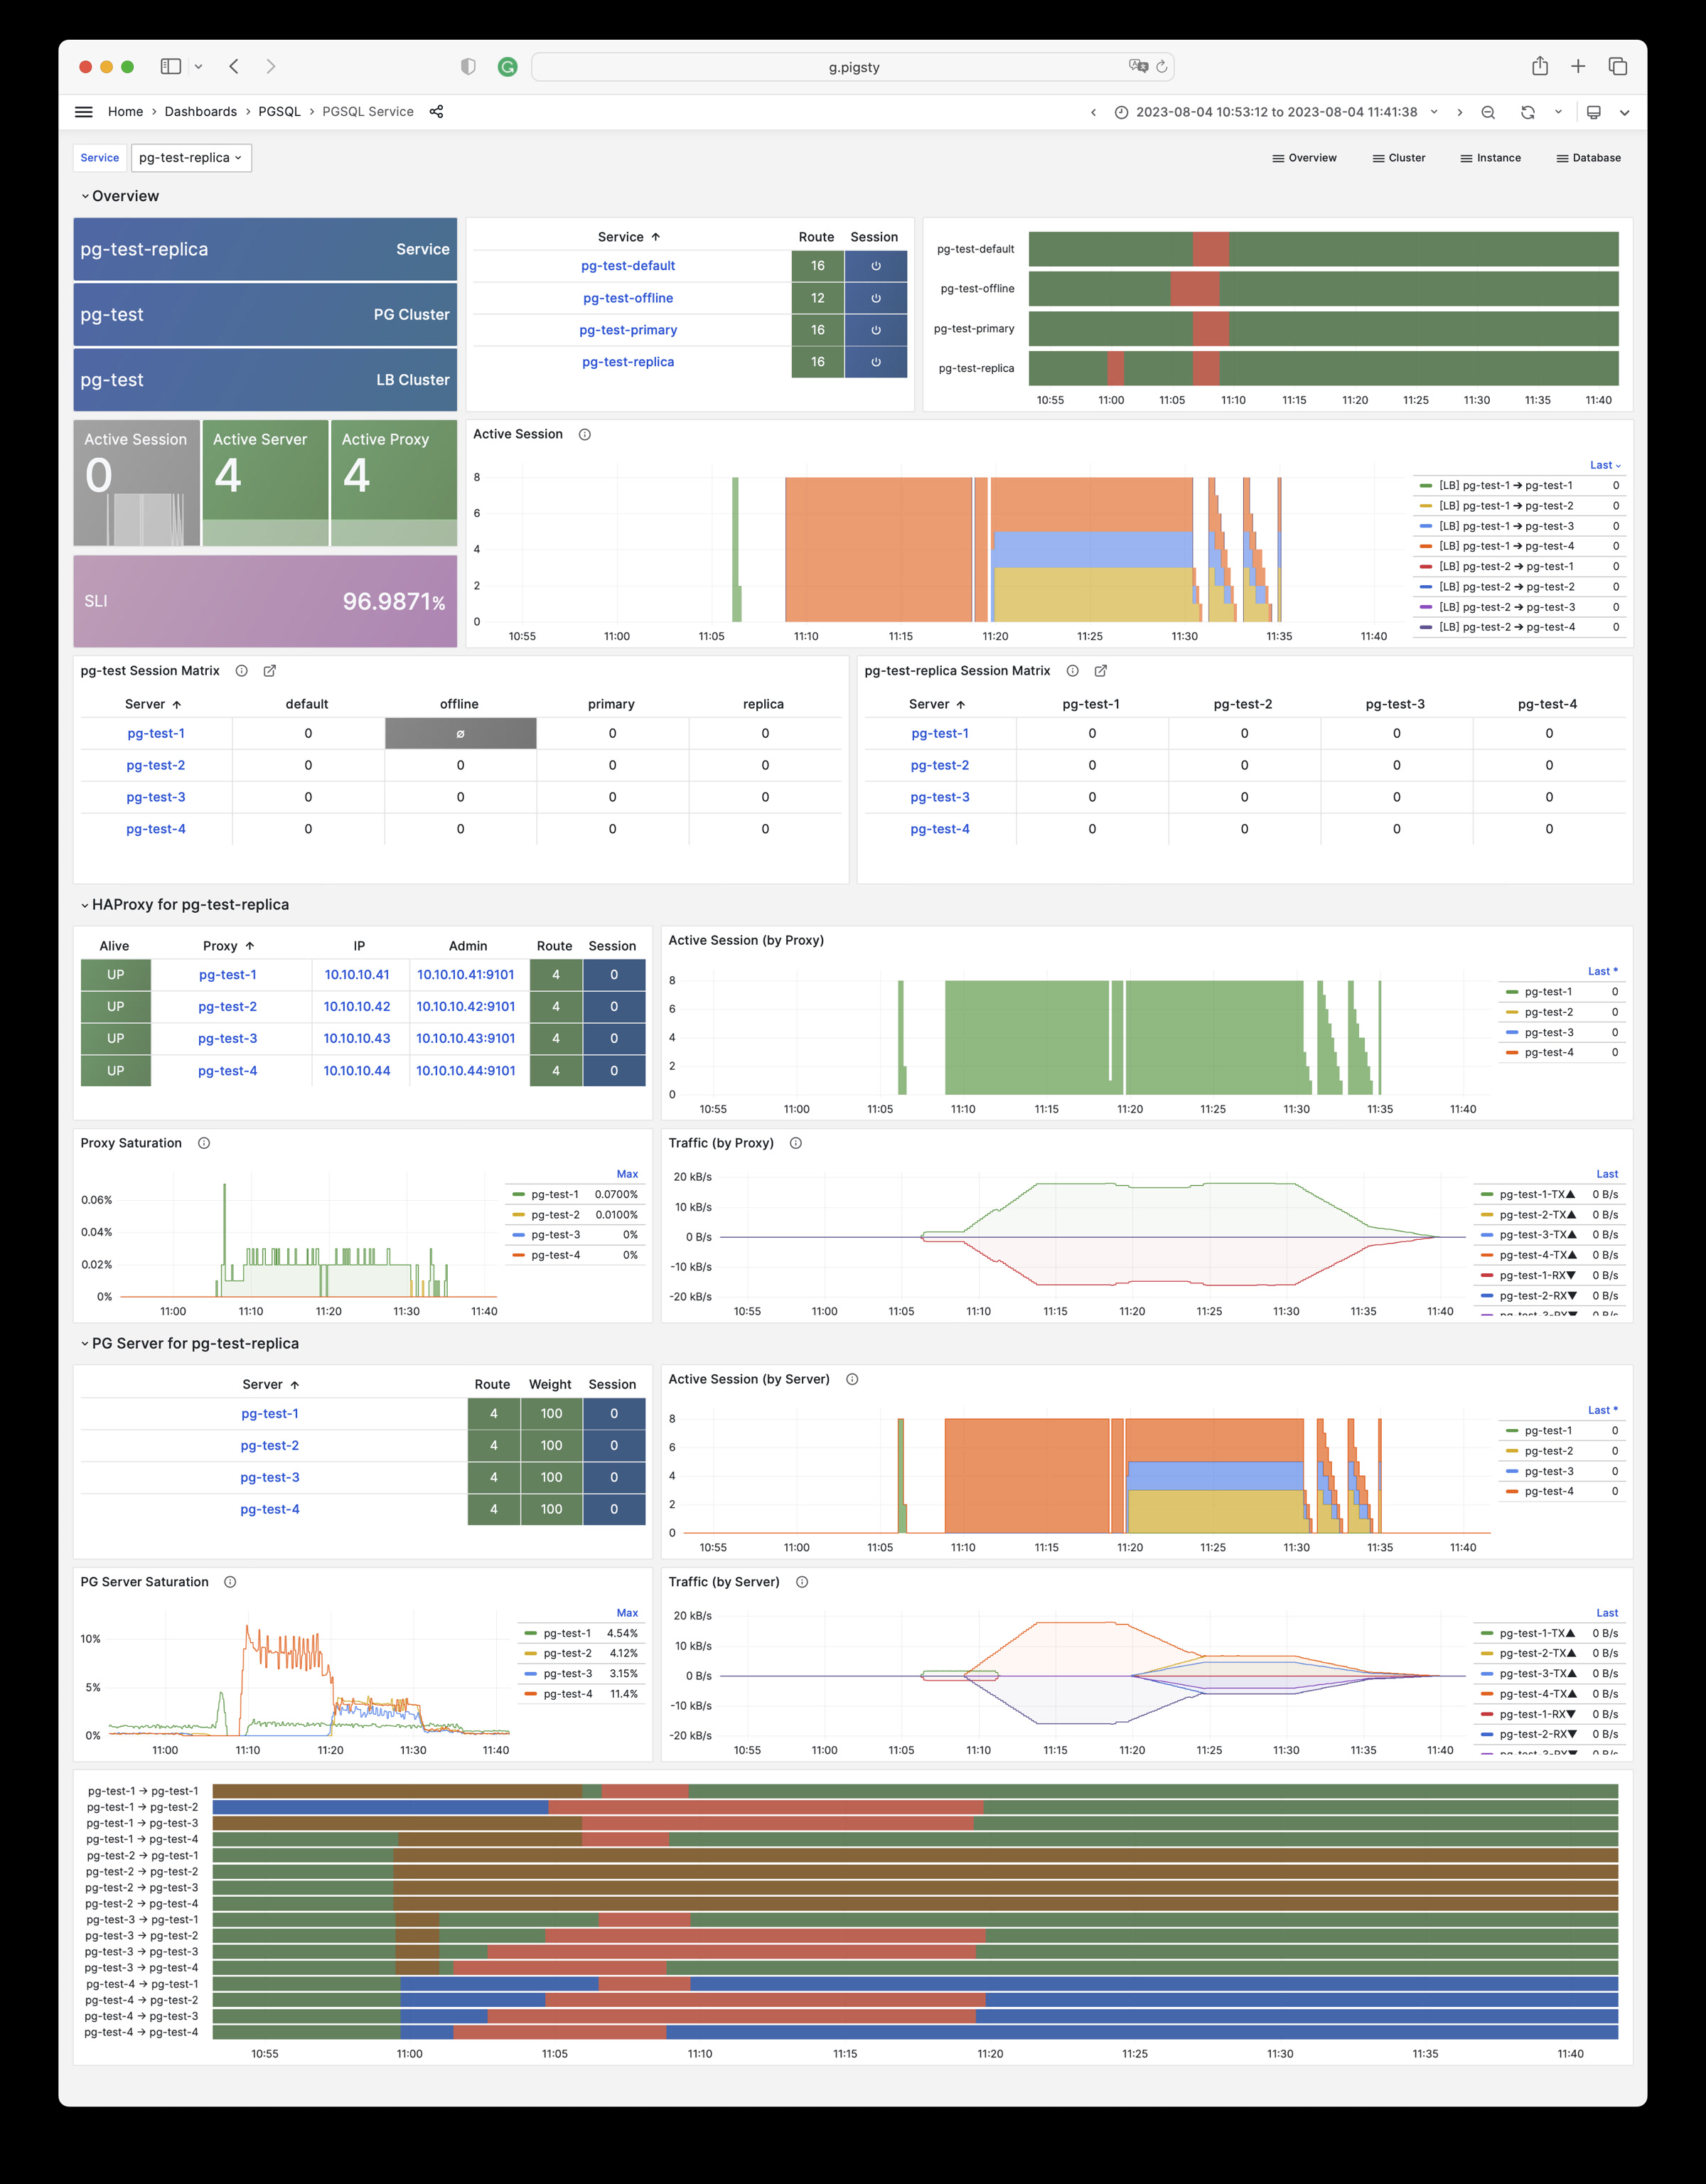
PGSQL Service: Focus on PGSQL cluster services, proxies, routing, and load balancing
PGSQL Service
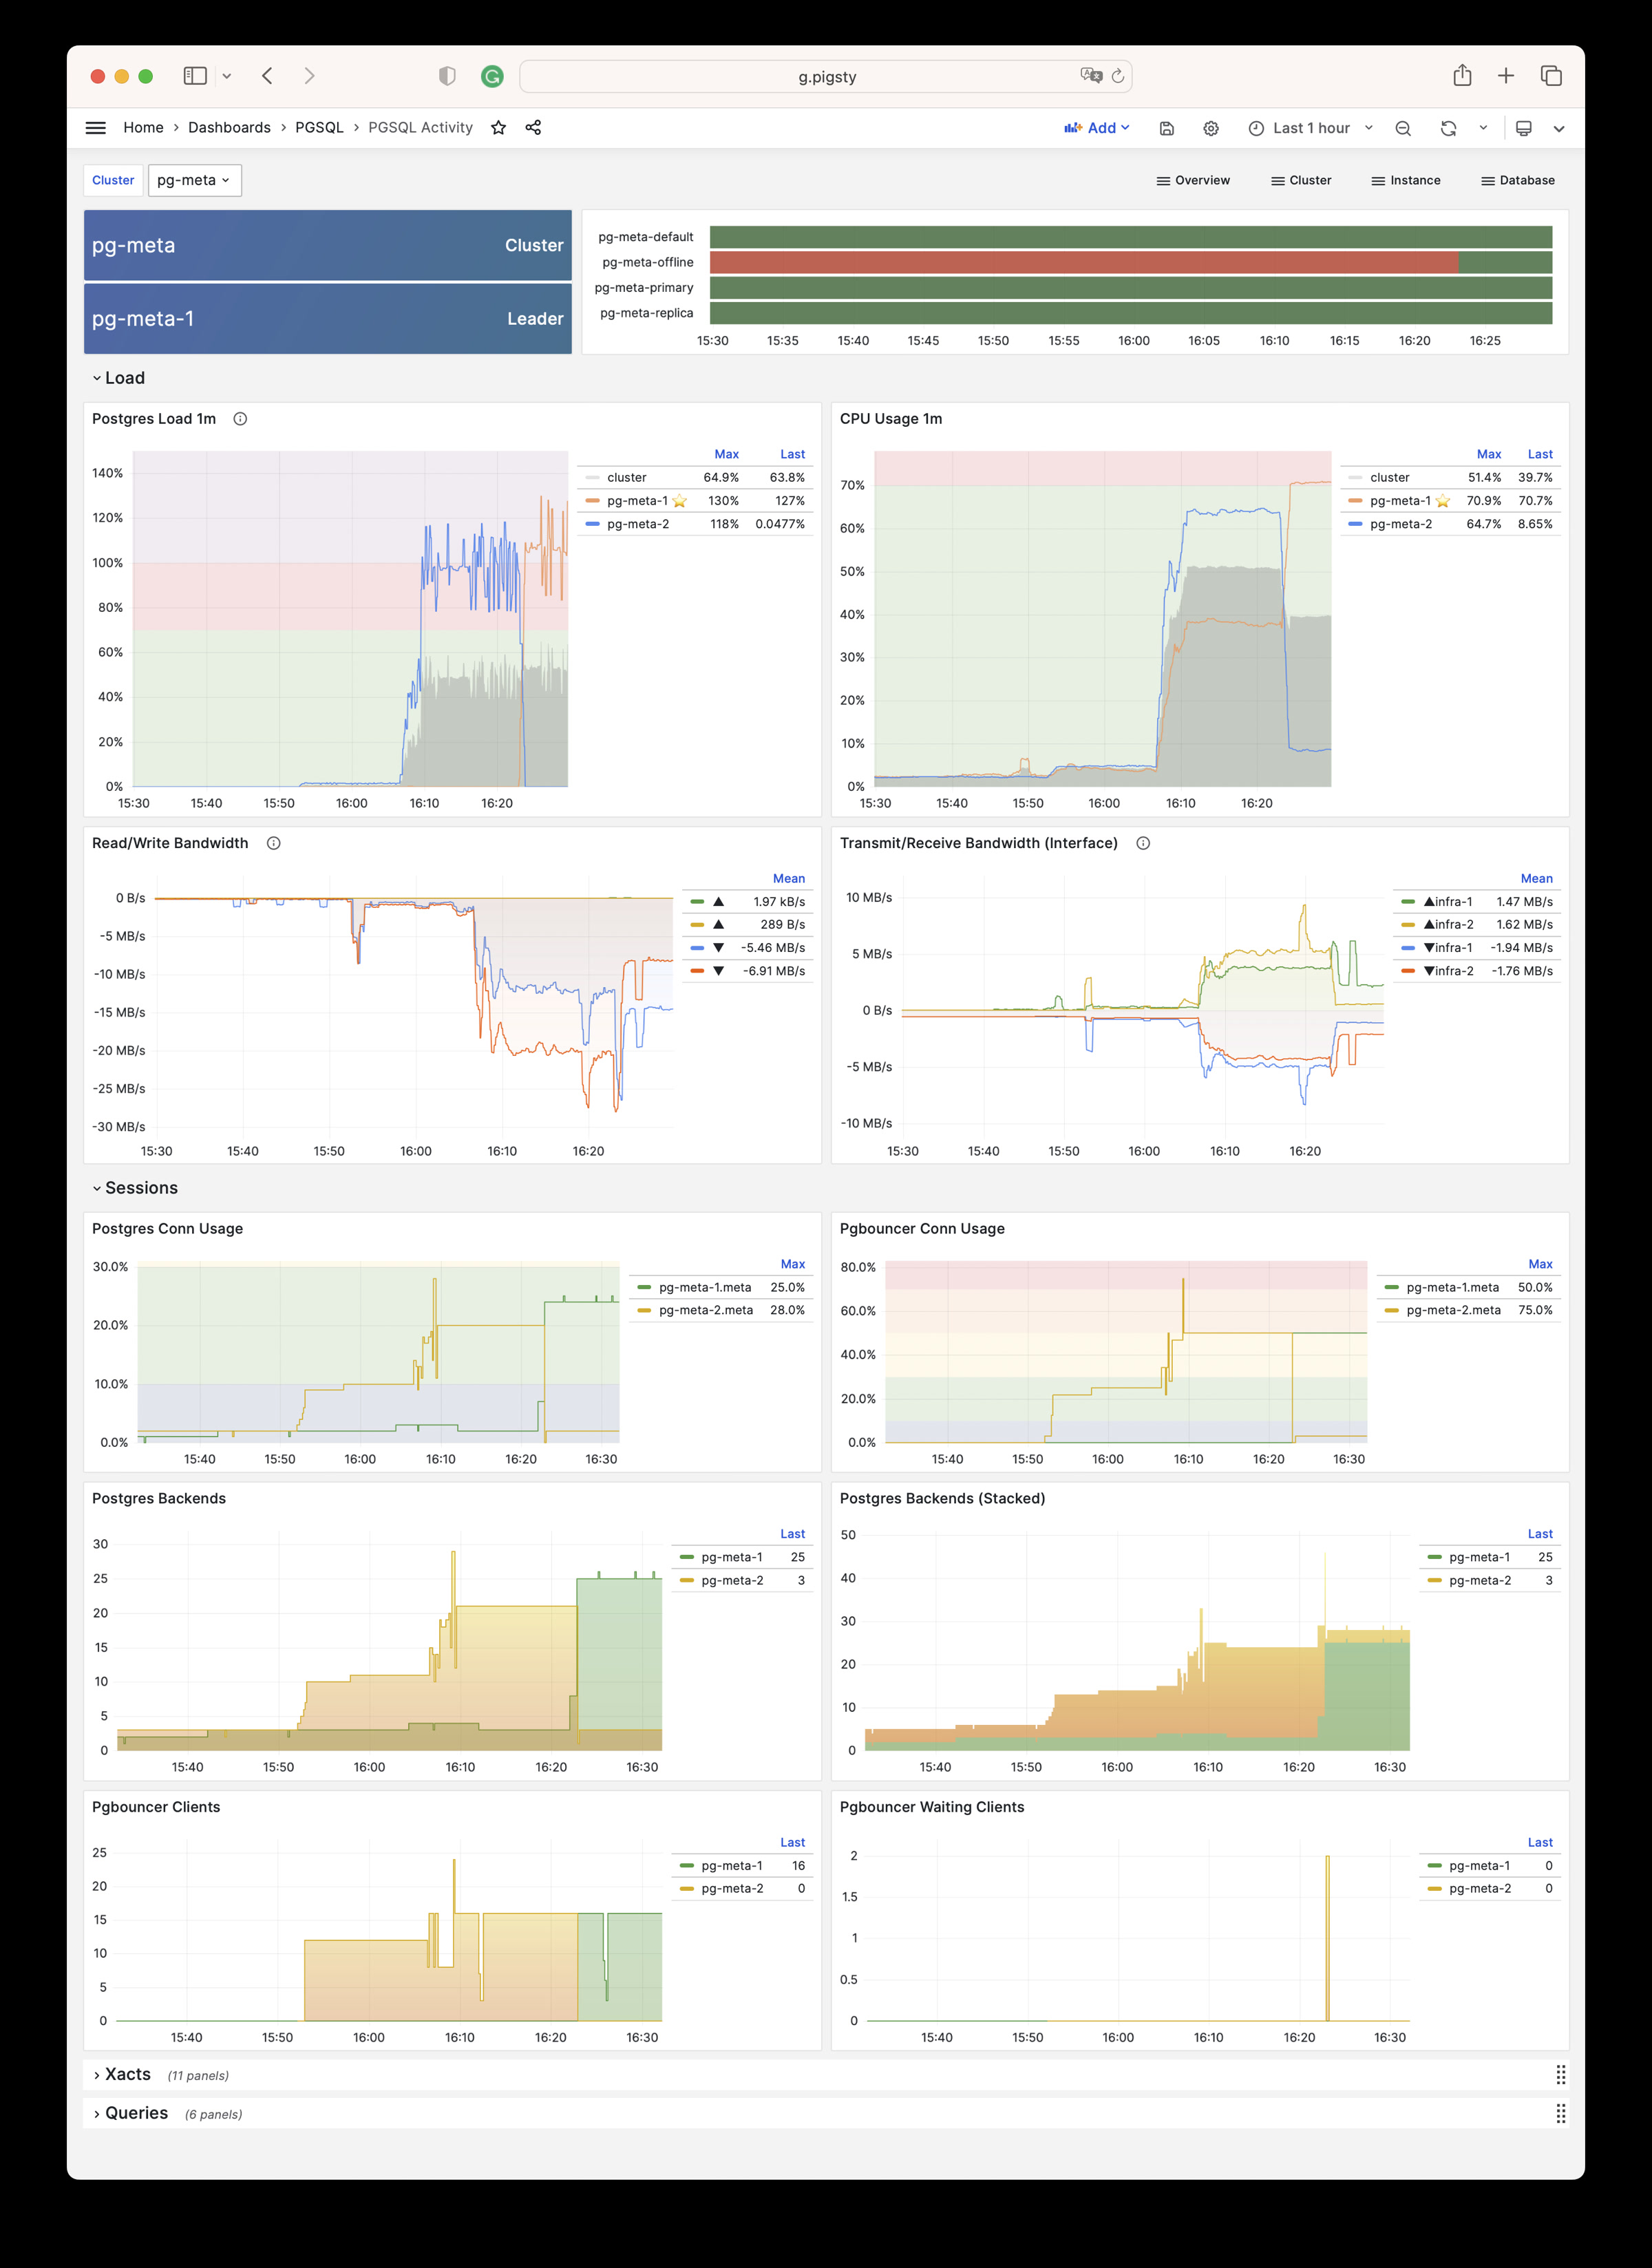
PGSQL Activity: Focus on PGSQL cluster sessions/load/QPS/TPS/locks
PGSQL Activity
PGSQL Replication: Focus on PGSQL cluster replication, slots, and pub/sub
PGSQL Replication
PGSQL Databases: Focus on database CRUD, slow queries, and table statistics across all instances
PGSQL Databases
PGSQL Patroni: Focus on cluster high availability status and Patroni component status
PGSQL Patroni
PGSQL PITR: Focus on cluster PITR process context for point-in-time recovery assistance
PGSQL PITR
Instance
PGSQL Instance: Main dashboard for a single PGSQL instance
PGSQL Instance

PGRDS Instance: RDS version of PGSQL Instance, focused on all PostgreSQL-specific metrics
PGRDS Instance

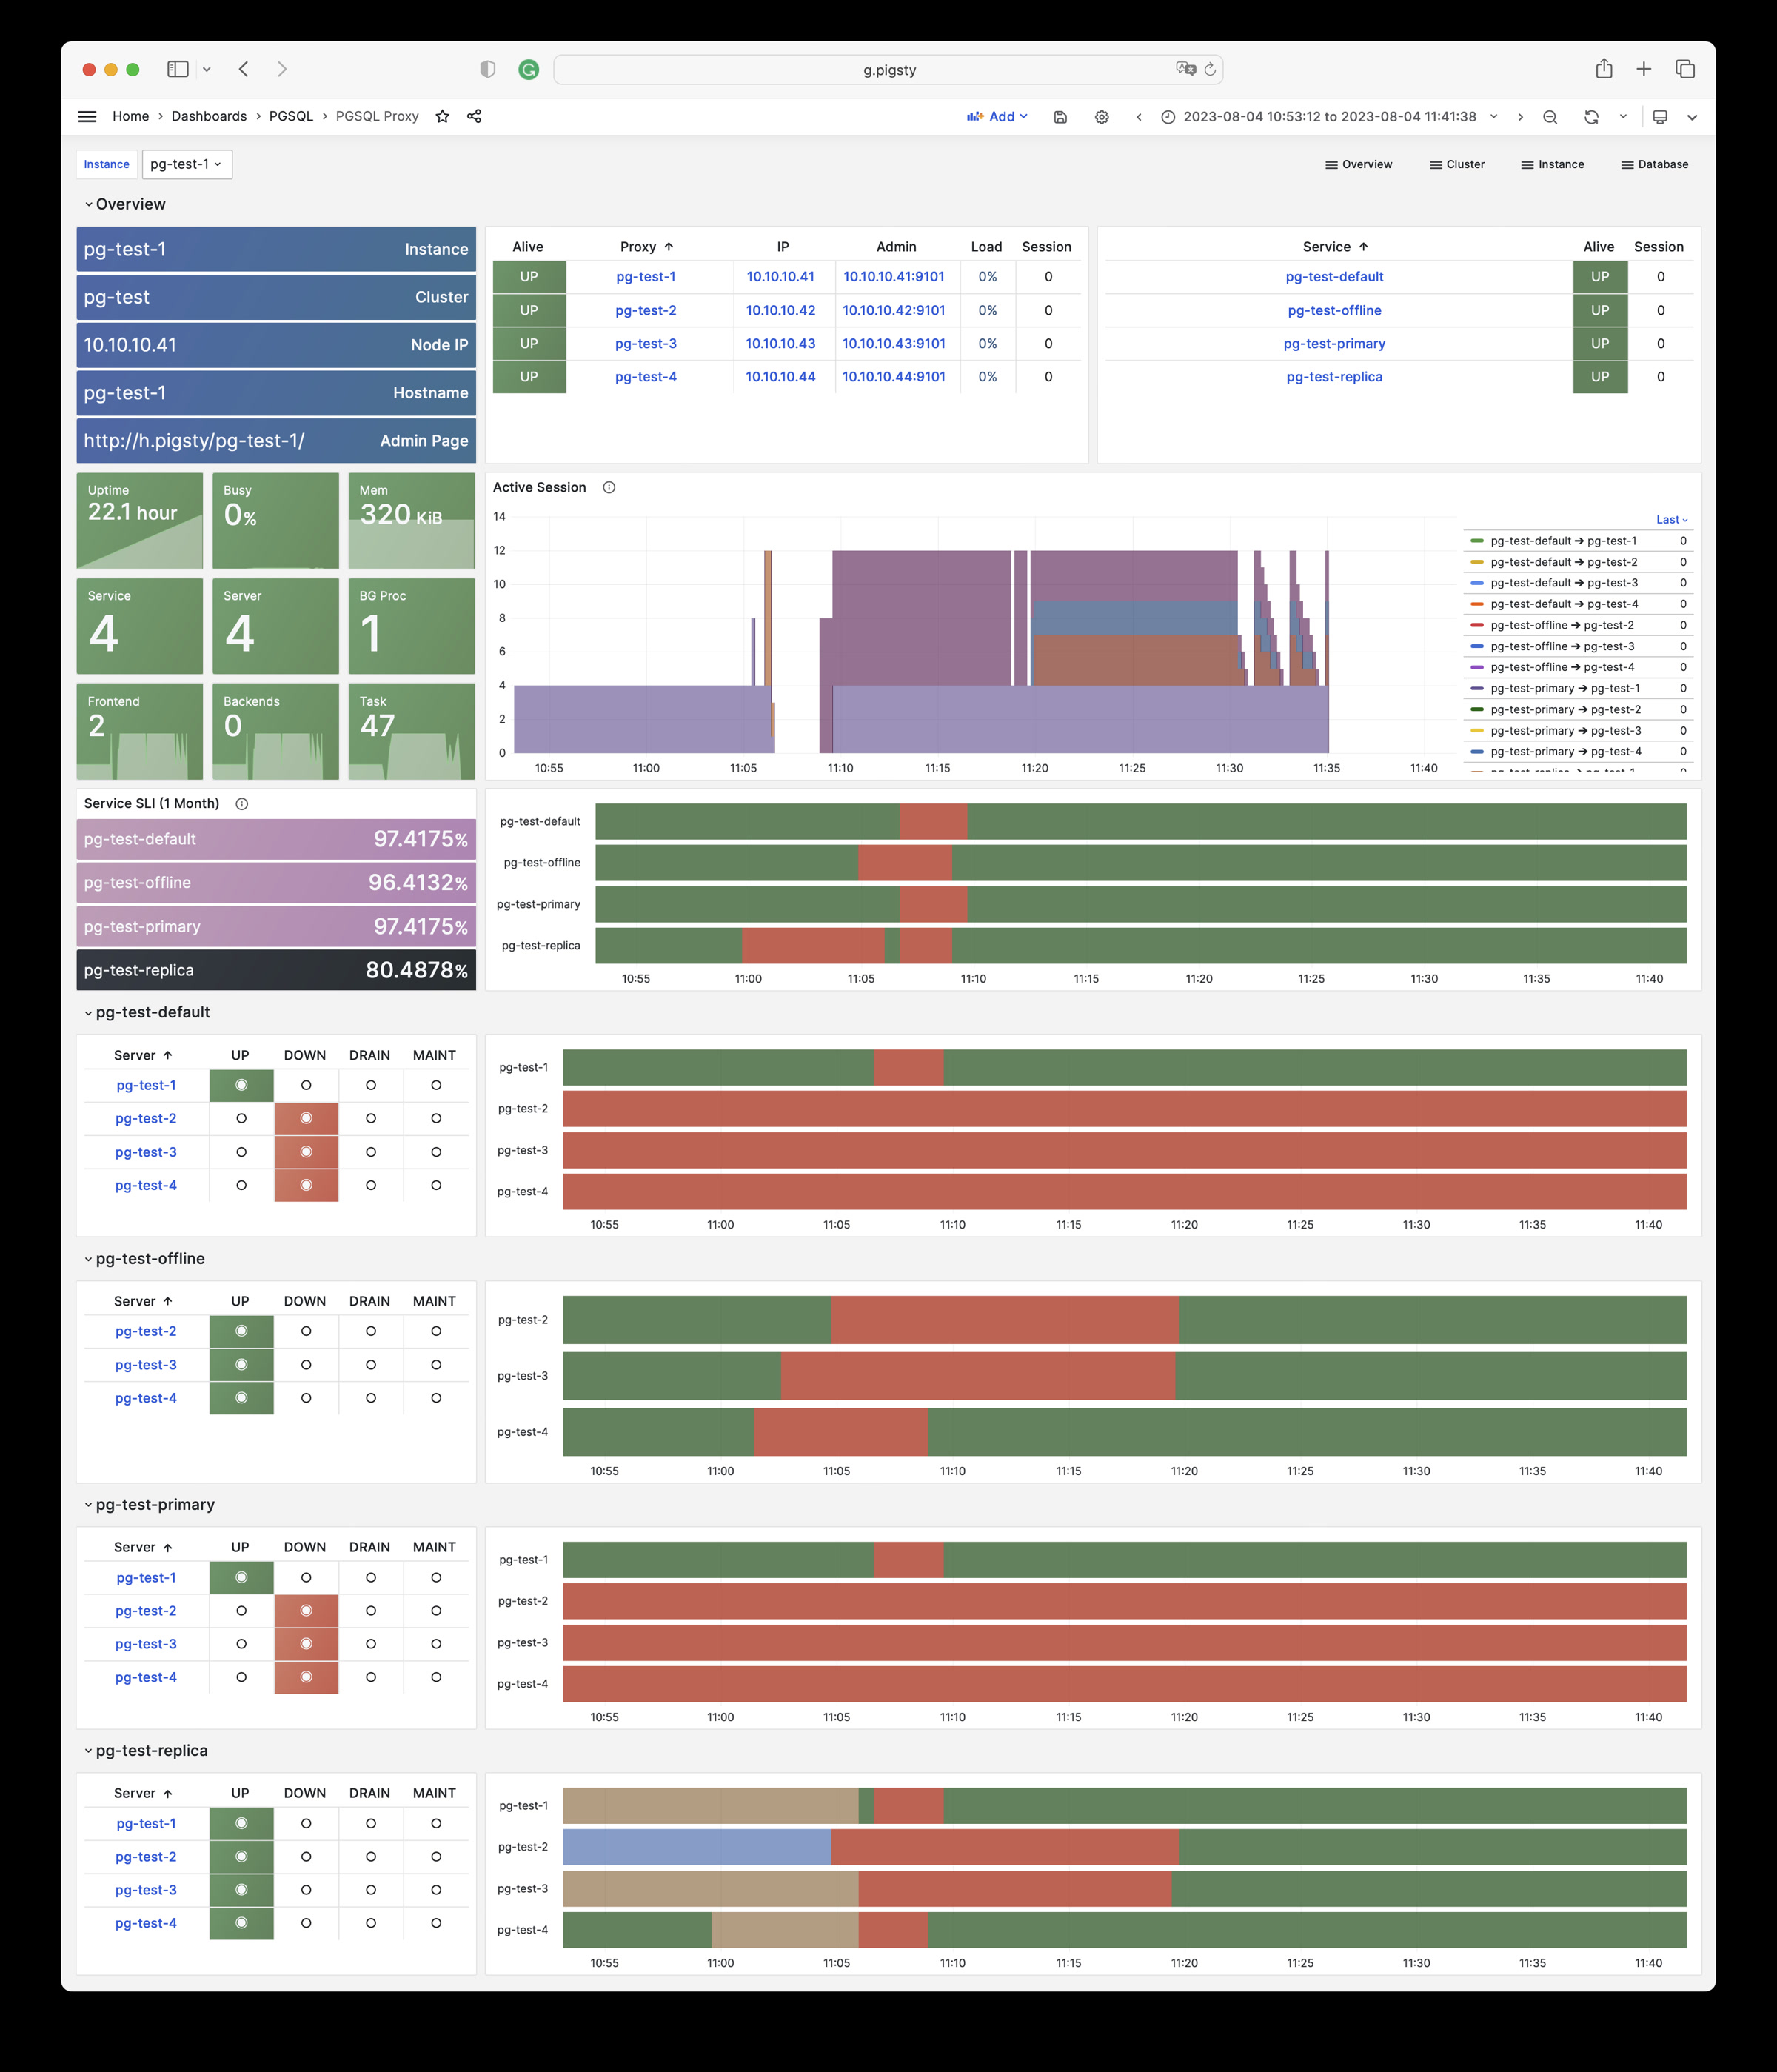
PGSQL Proxy: Detailed metrics for a single HAProxy load balancer
PGSQL Proxy
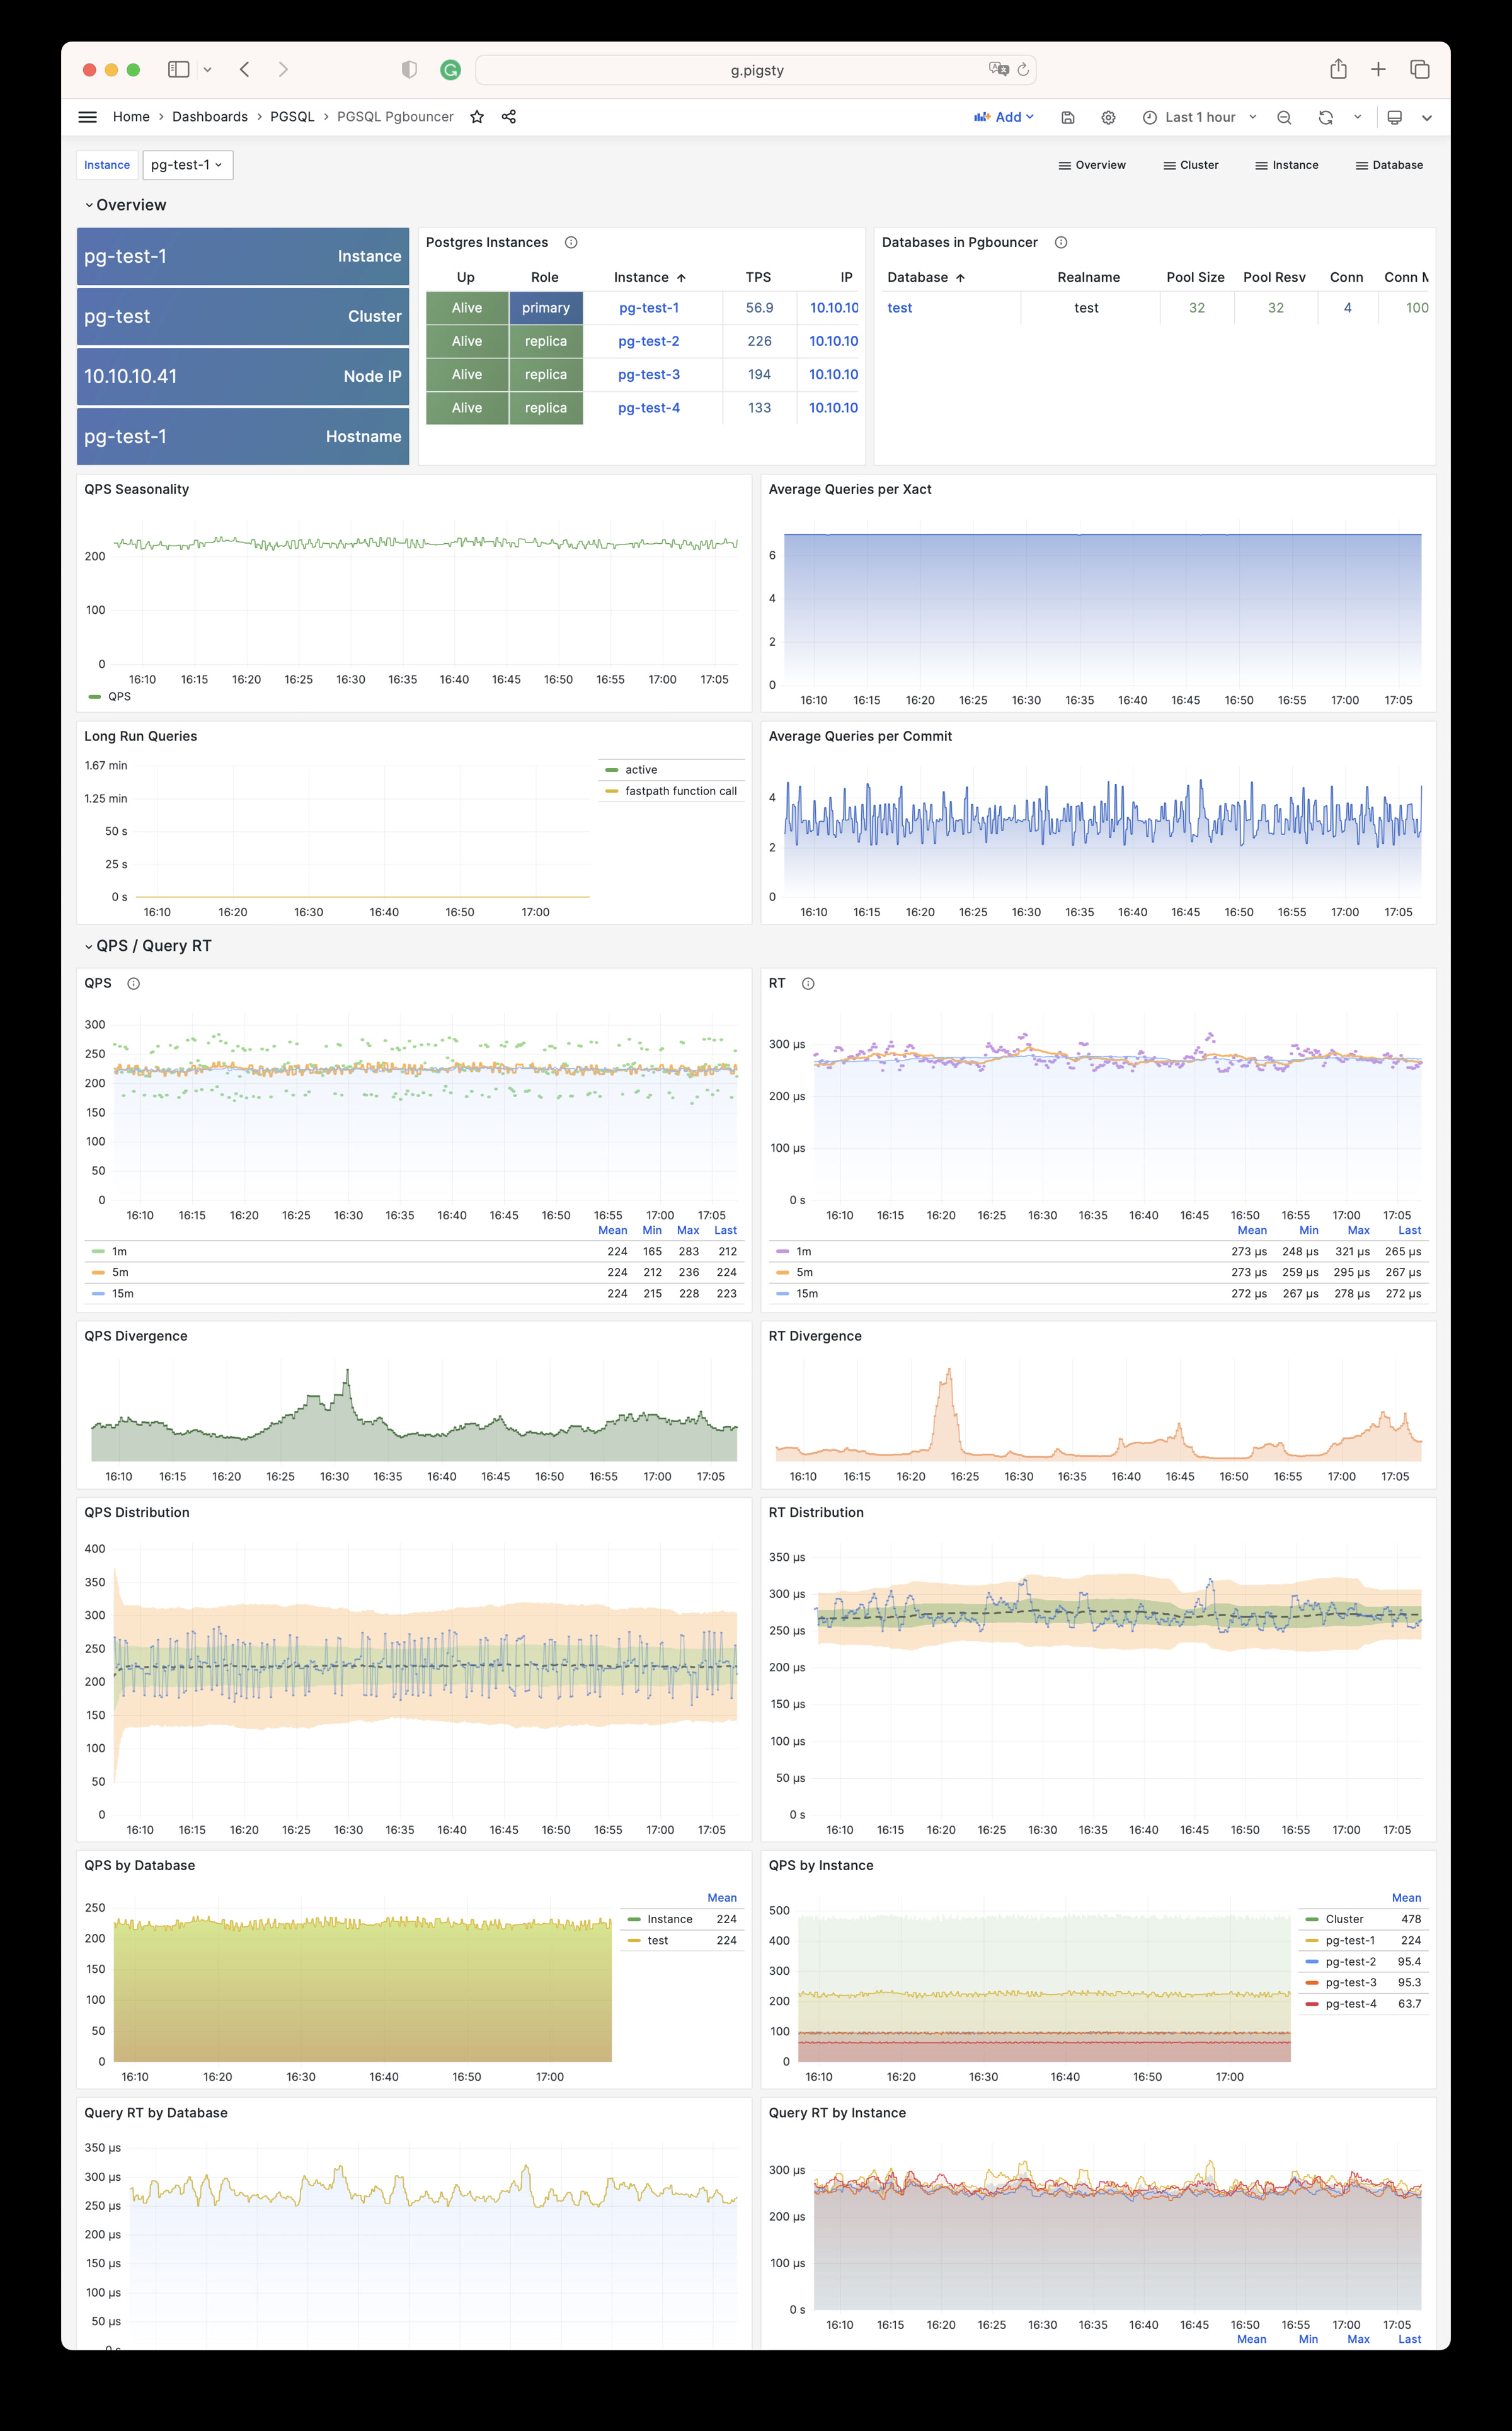
PGSQL Pgbouncer: Metrics overview in a single Pgbouncer connection pool instance
PGSQL Pgbouncer
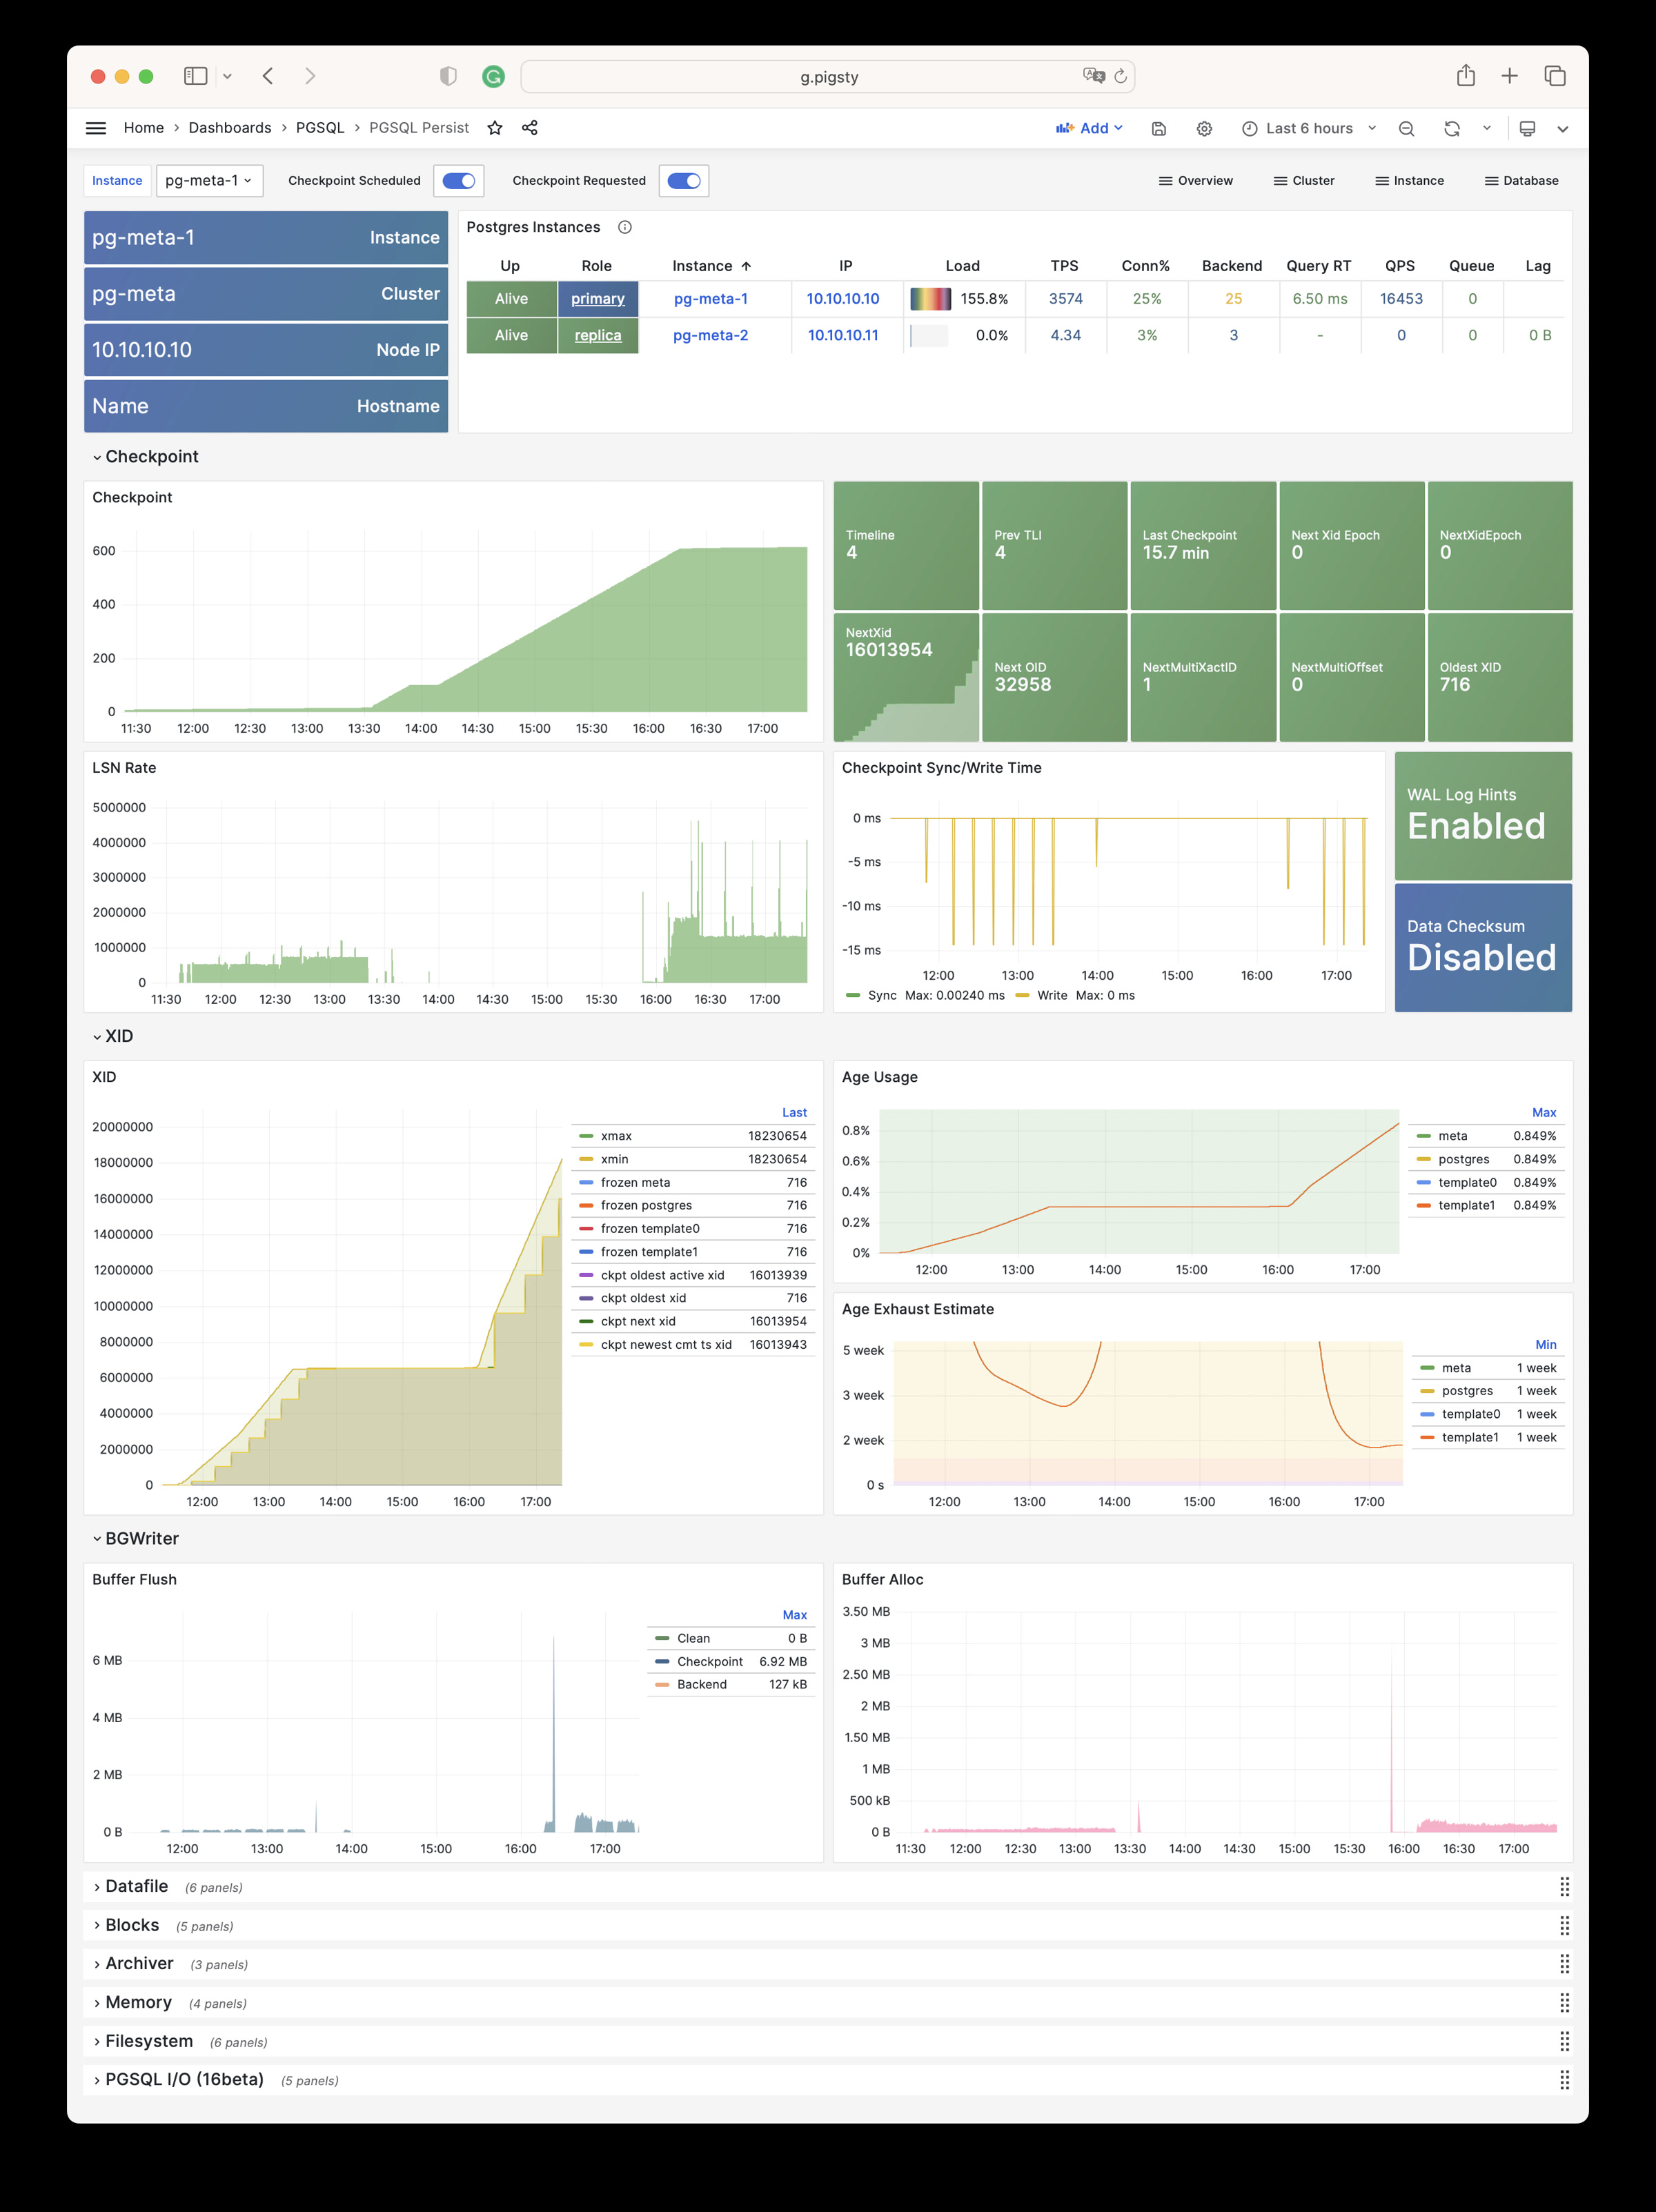
PGSQL Persist: Persistence metrics: WAL, XID, checkpoints, archiving, IO
PGSQL Persist
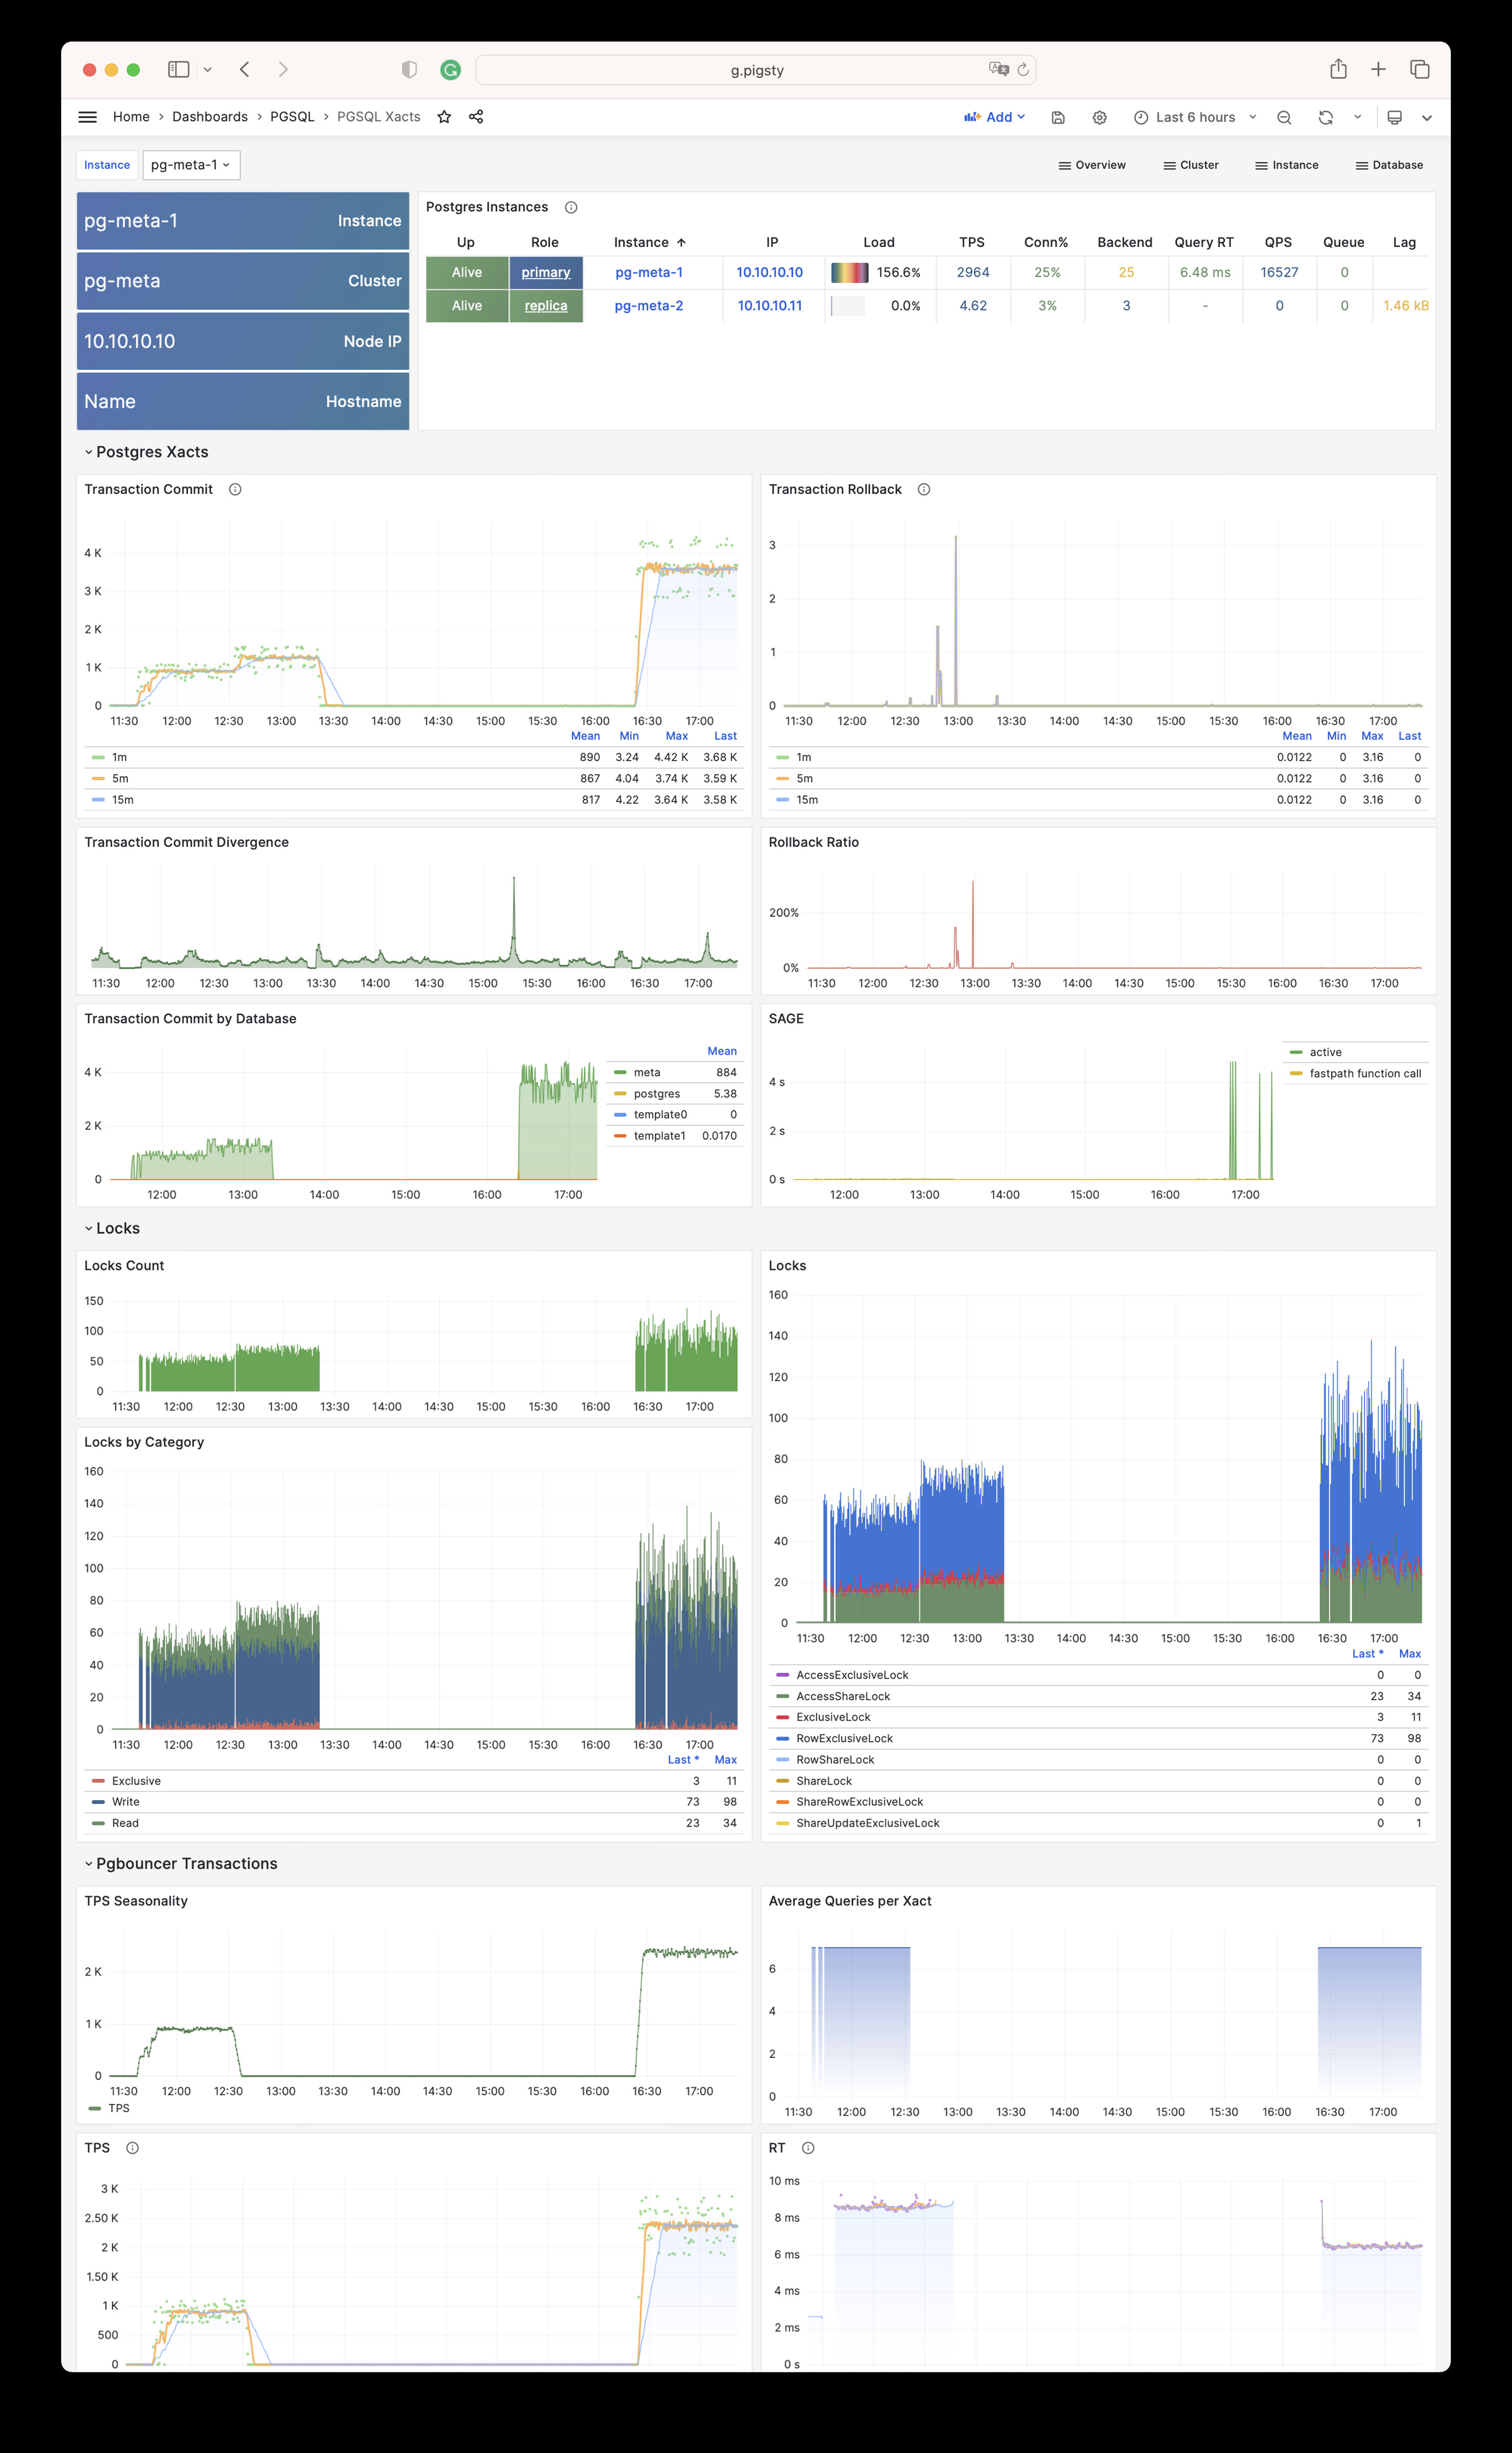
PGSQL Xacts: Metrics related to transactions, locks, TPS/QPS
PGSQL Xacts
PGSQL Session: Session and active/idle time metrics in a single instance
PGSQL Session
PGSQL Exporter: Self-monitoring metrics for Postgres/Pgbouncer monitoring components
PGSQL Exporter
Database
PGSQL Database: Main dashboard for a single PGSQL database
PGSQL Database
PGSQL Tables: Table/index access metrics within a single database
PGSQL Tables
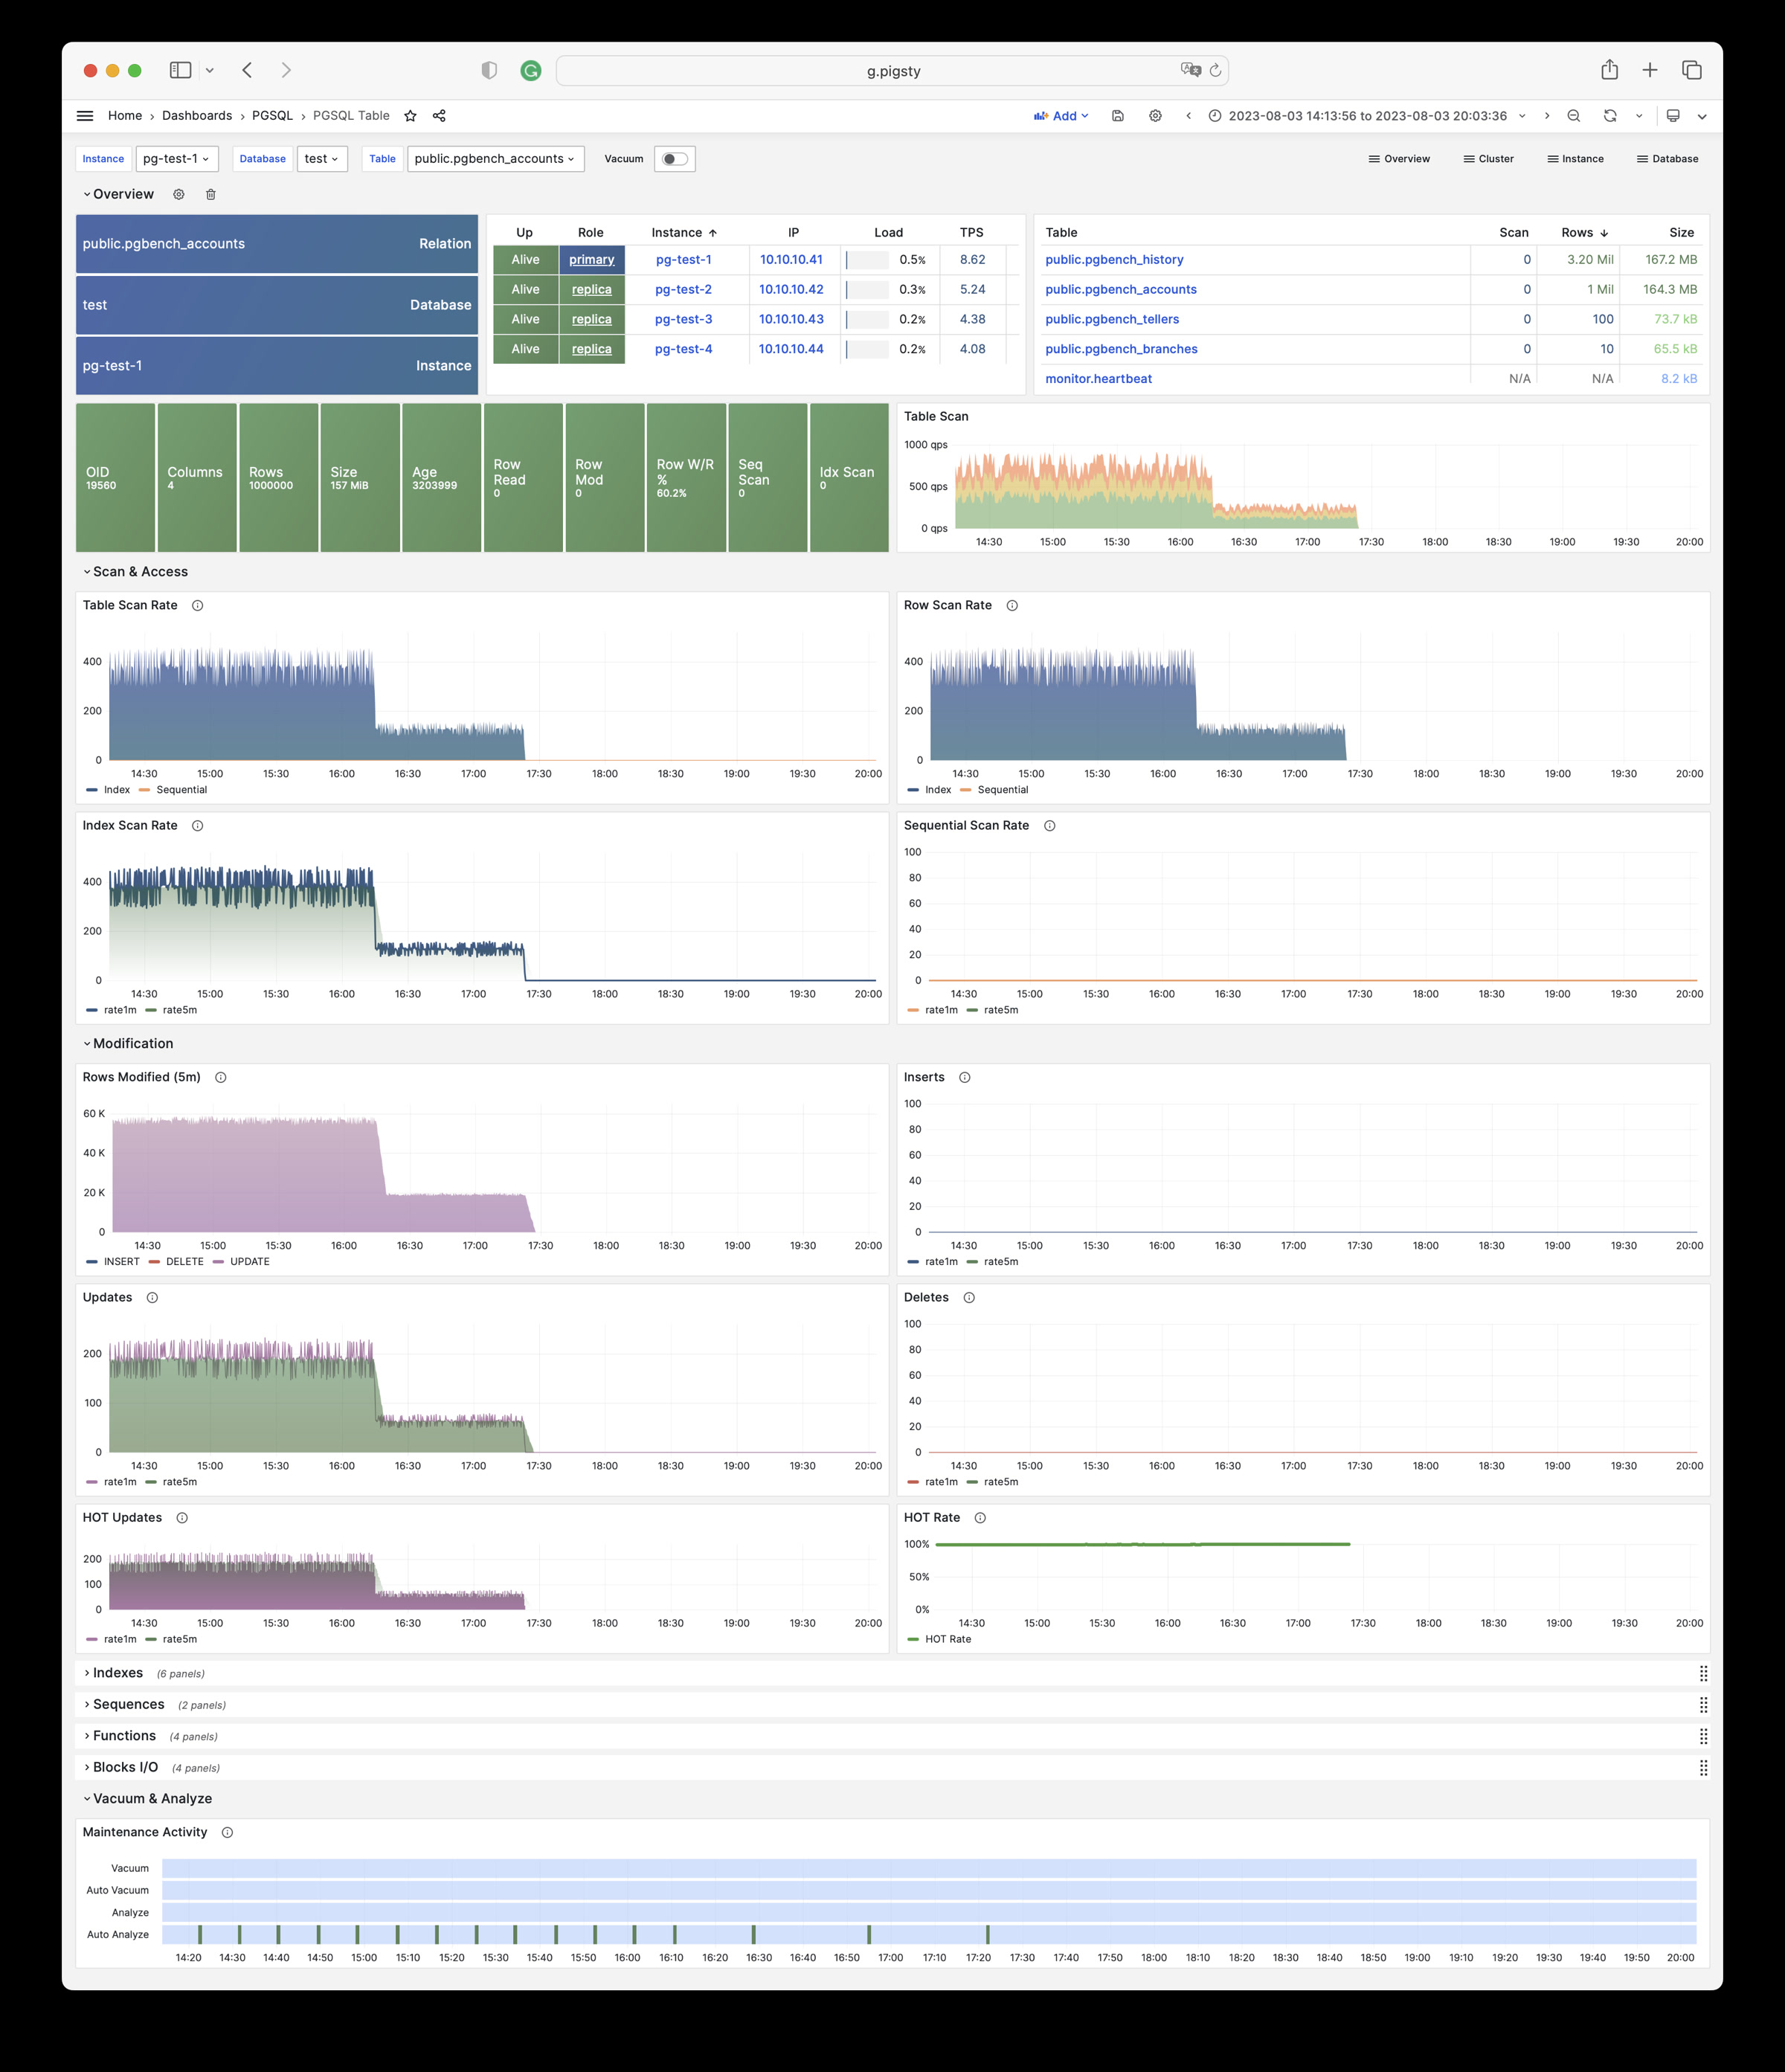
PGSQL Table: Details of a single table (QPS/RT/index/sequences…)
PGSQL Table
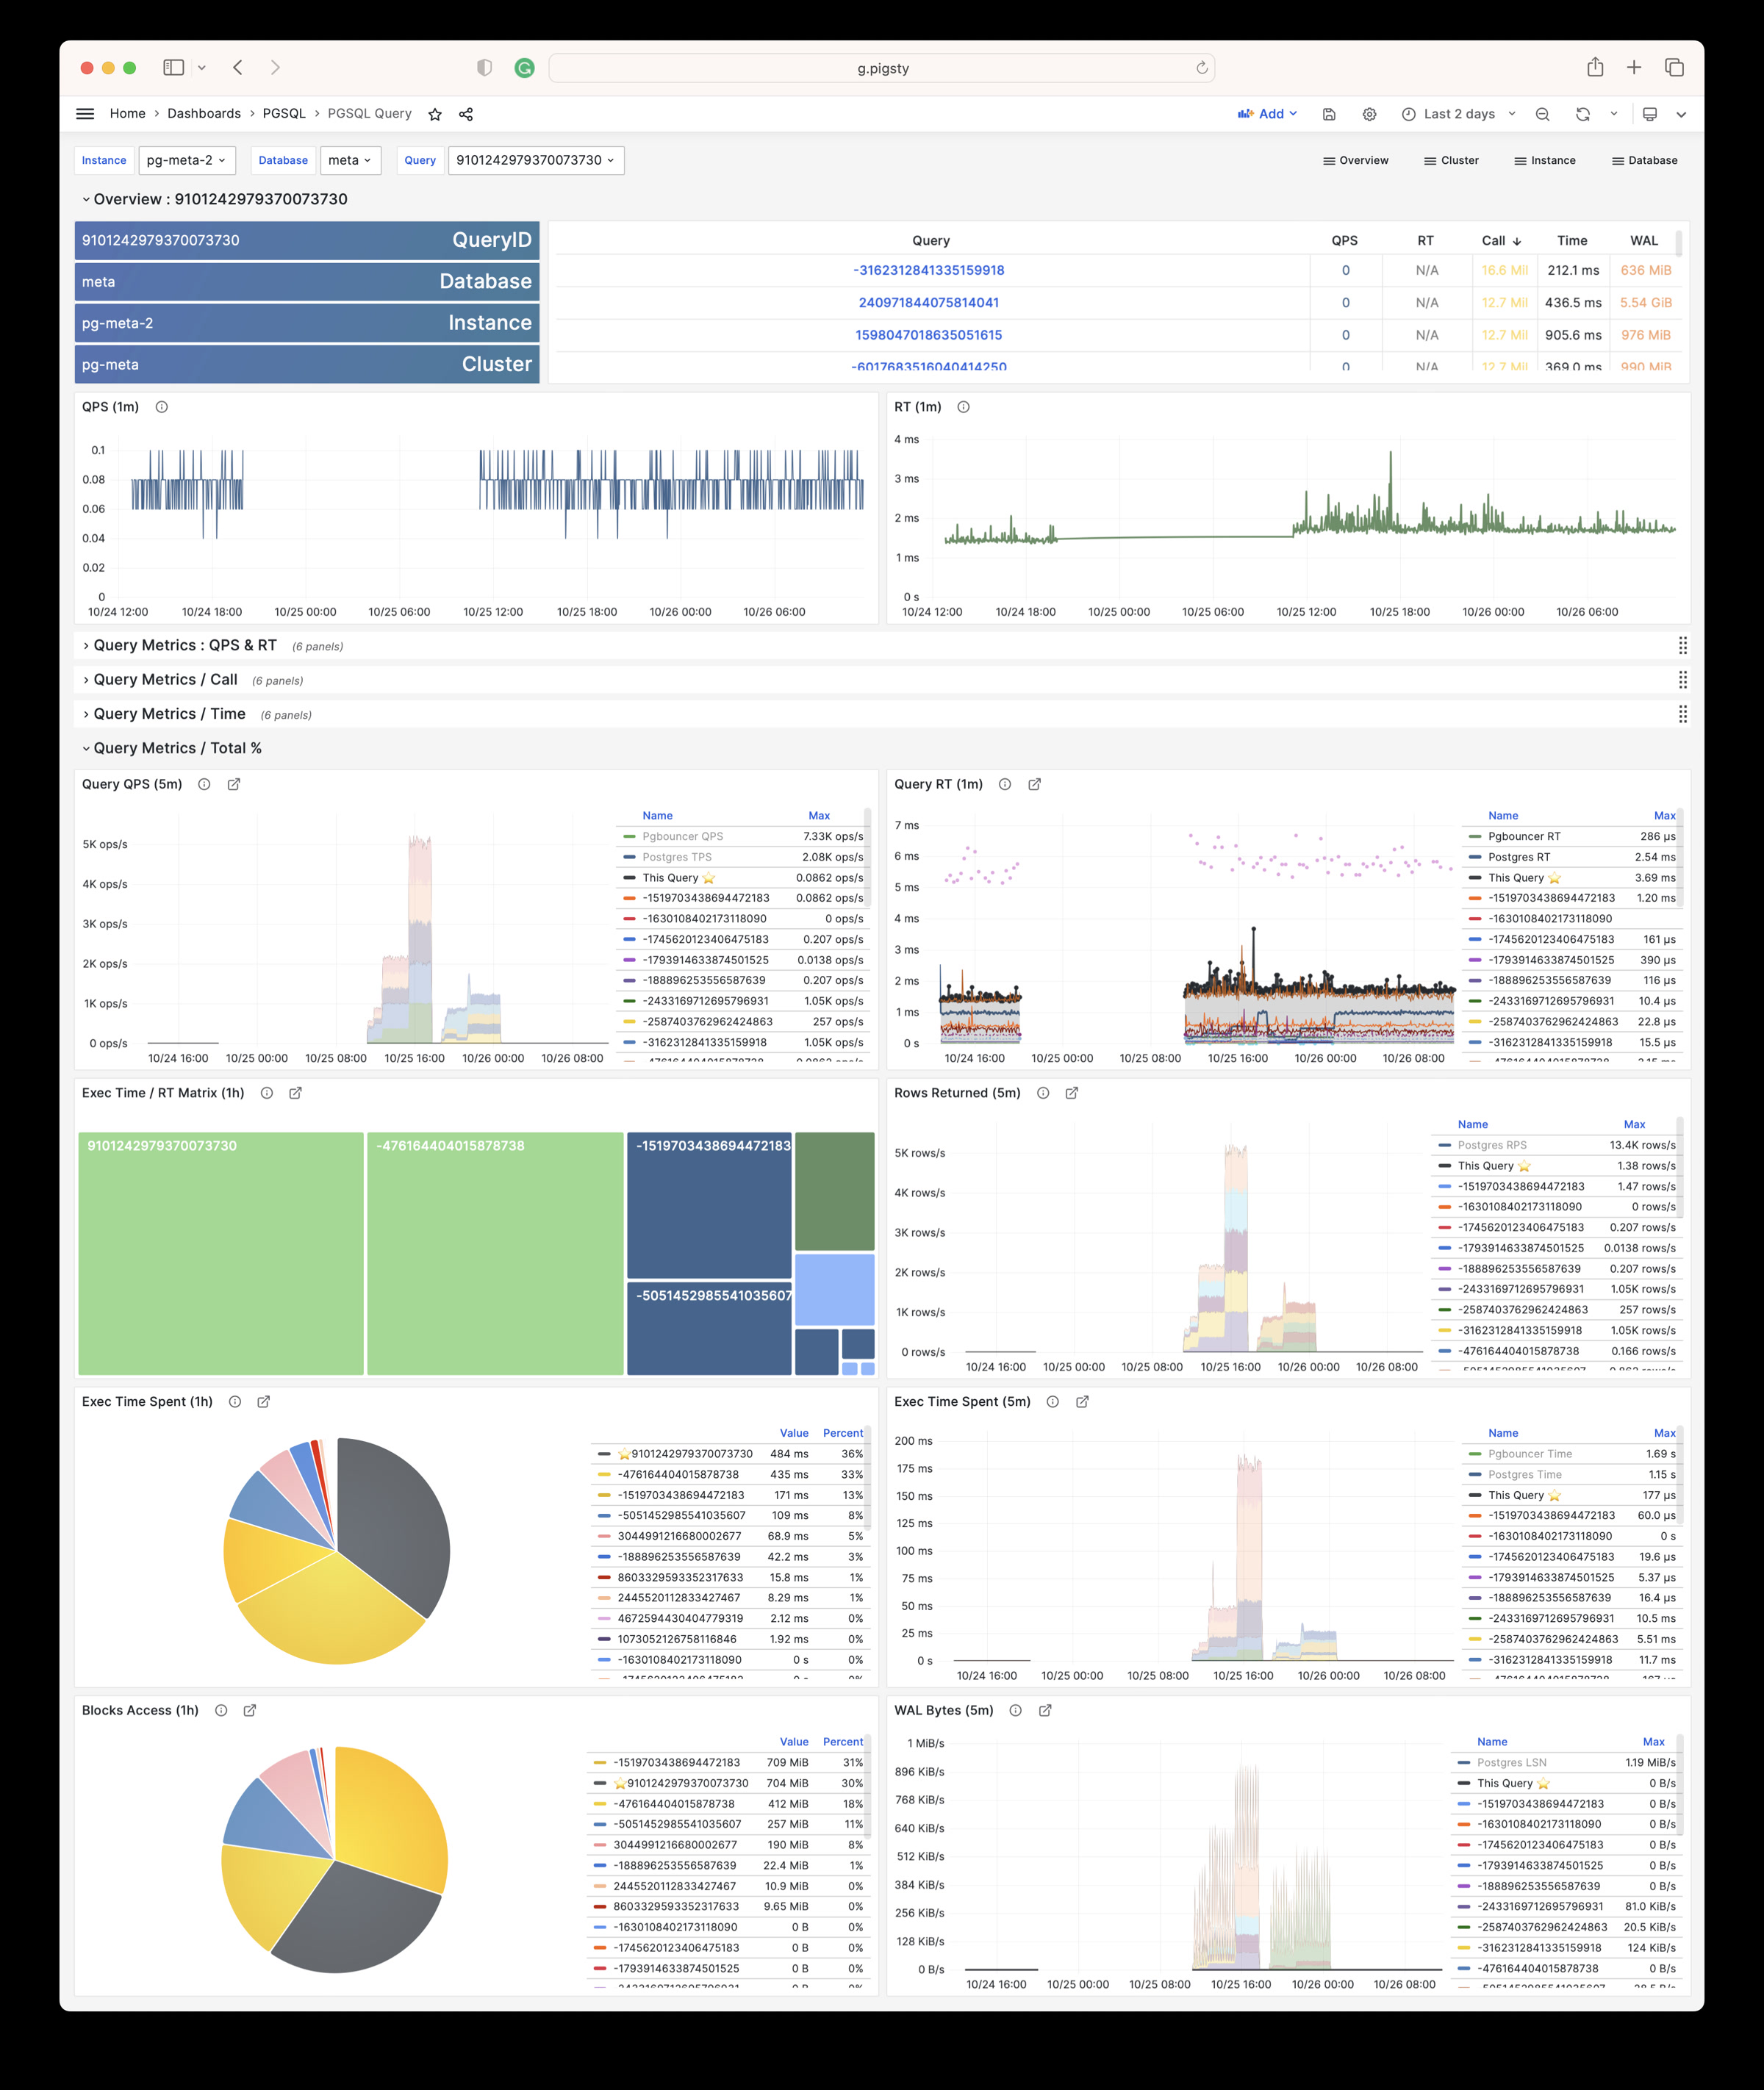
PGSQL Query: Details of a single query (QPS/RT)
PGSQL Query
PGCAT
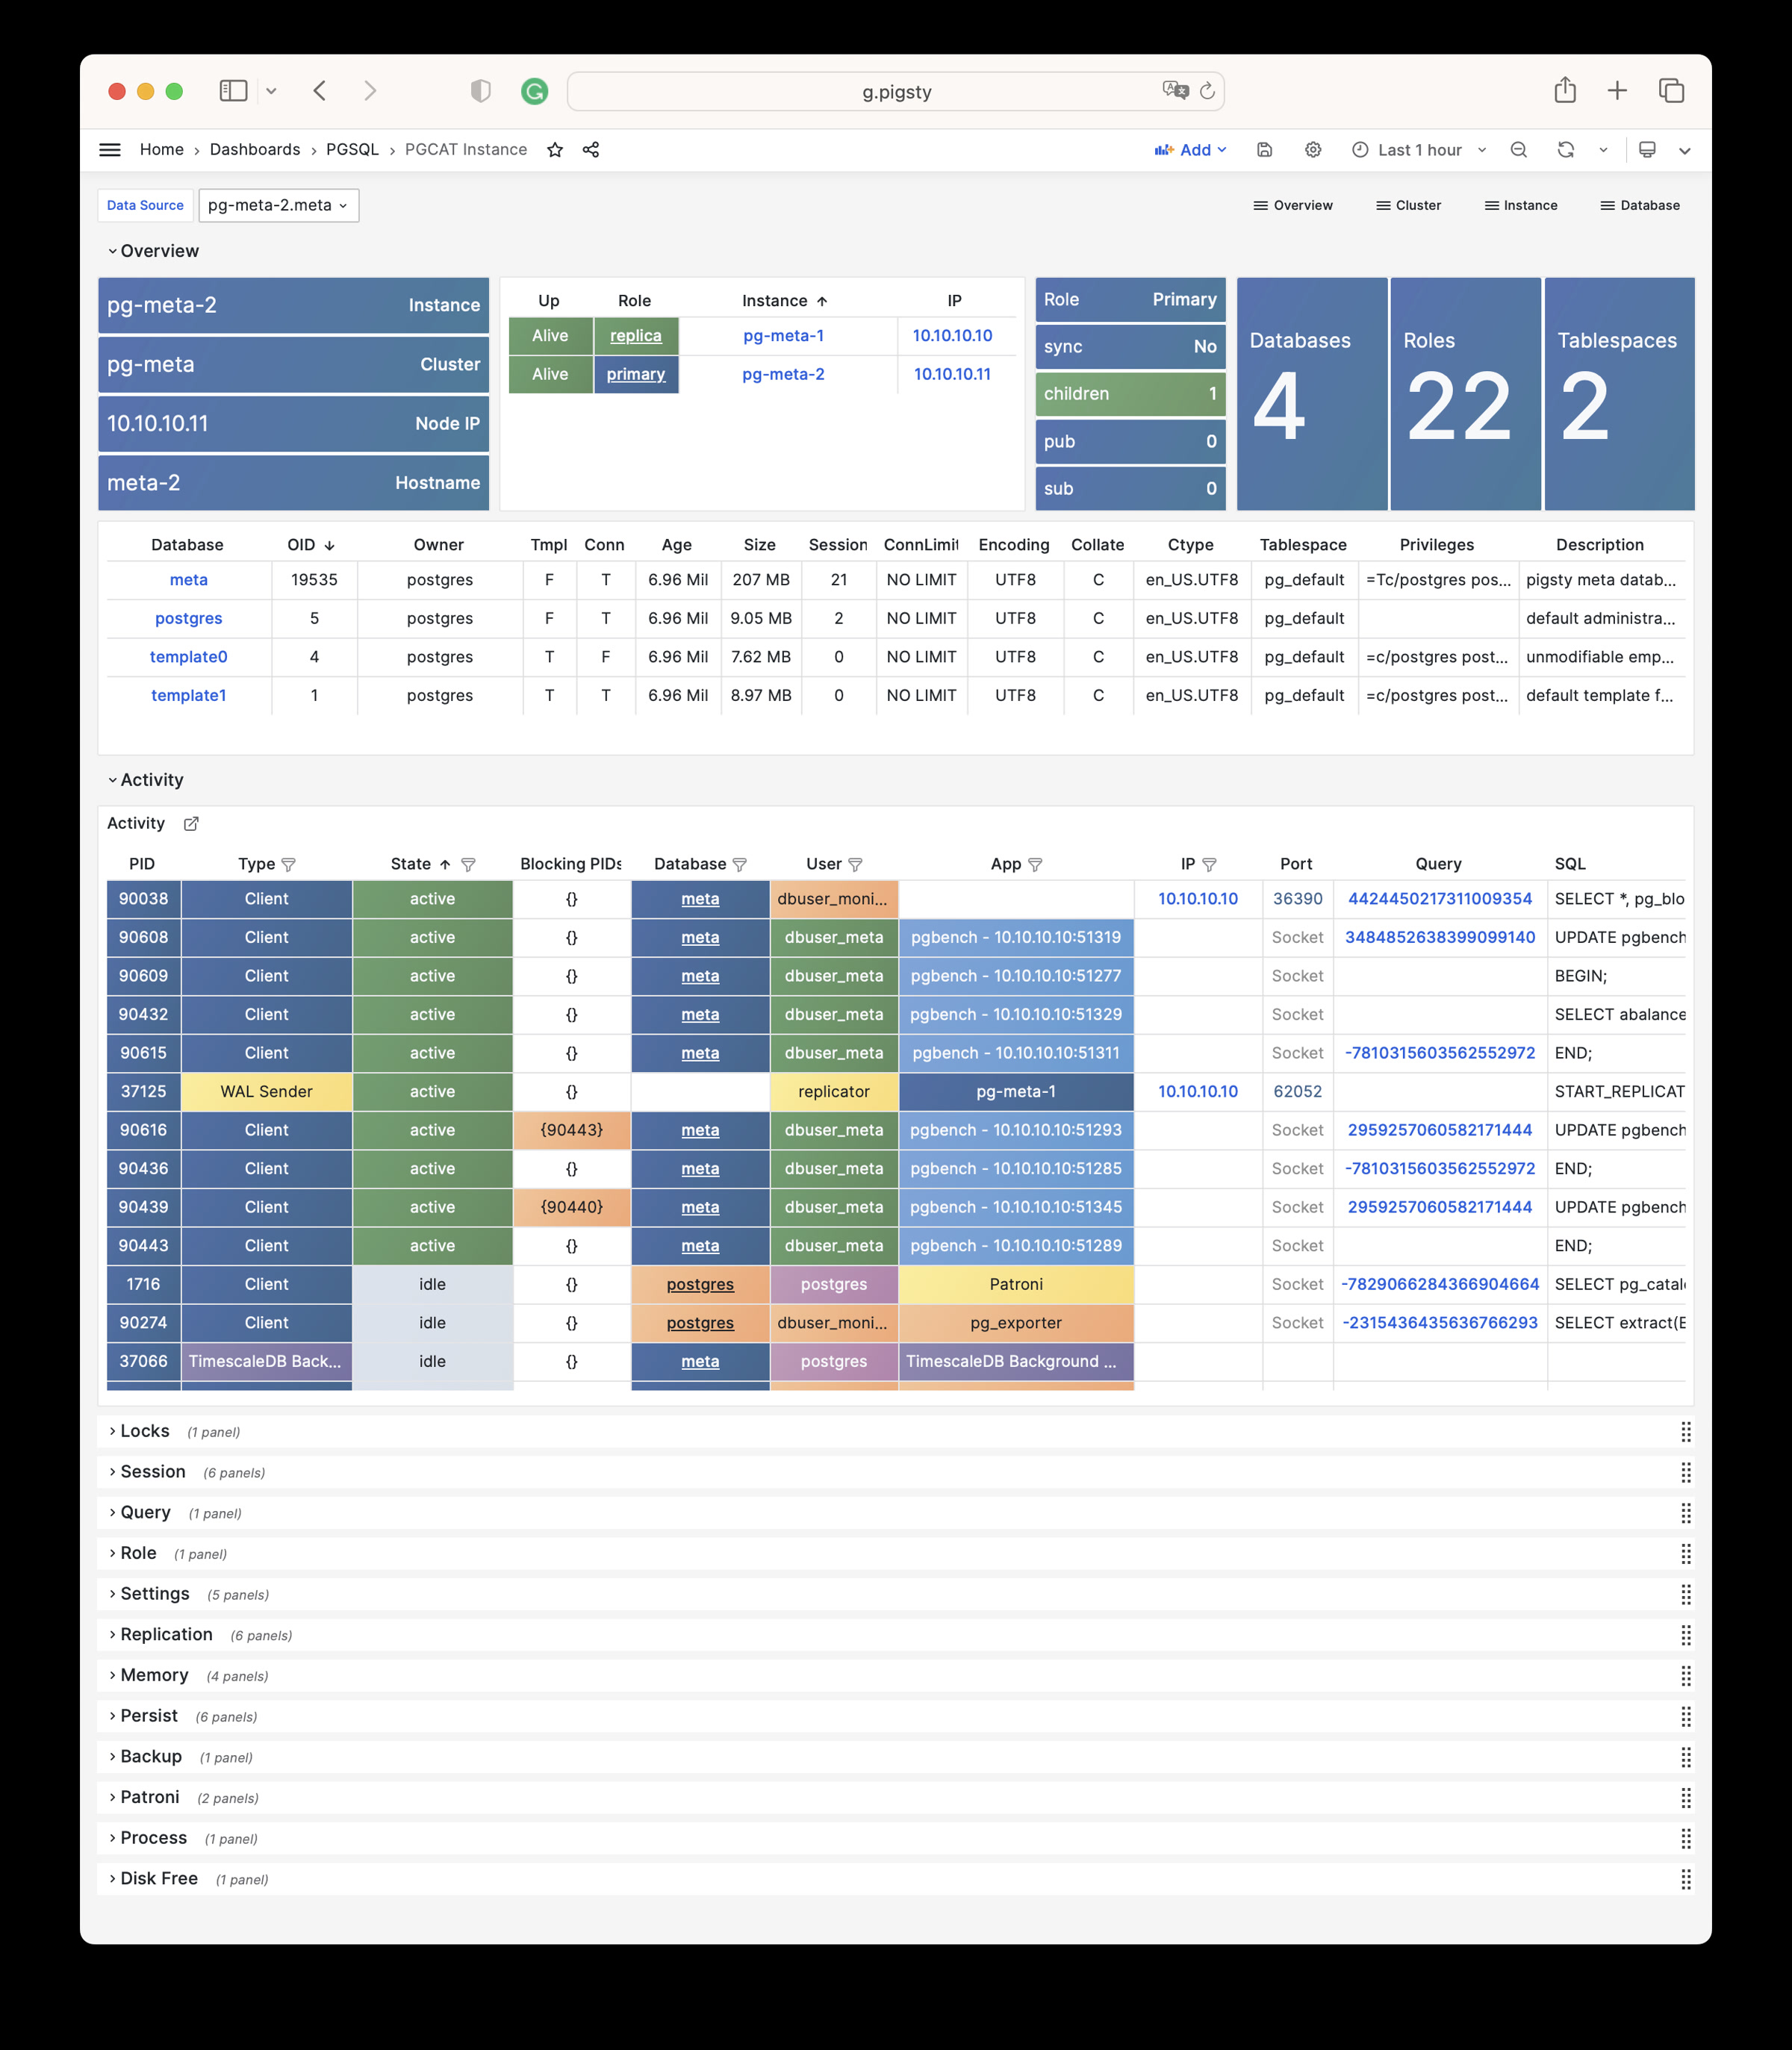
PGCAT Instance: Instance information retrieved directly from the database catalog
PGCAT Instance
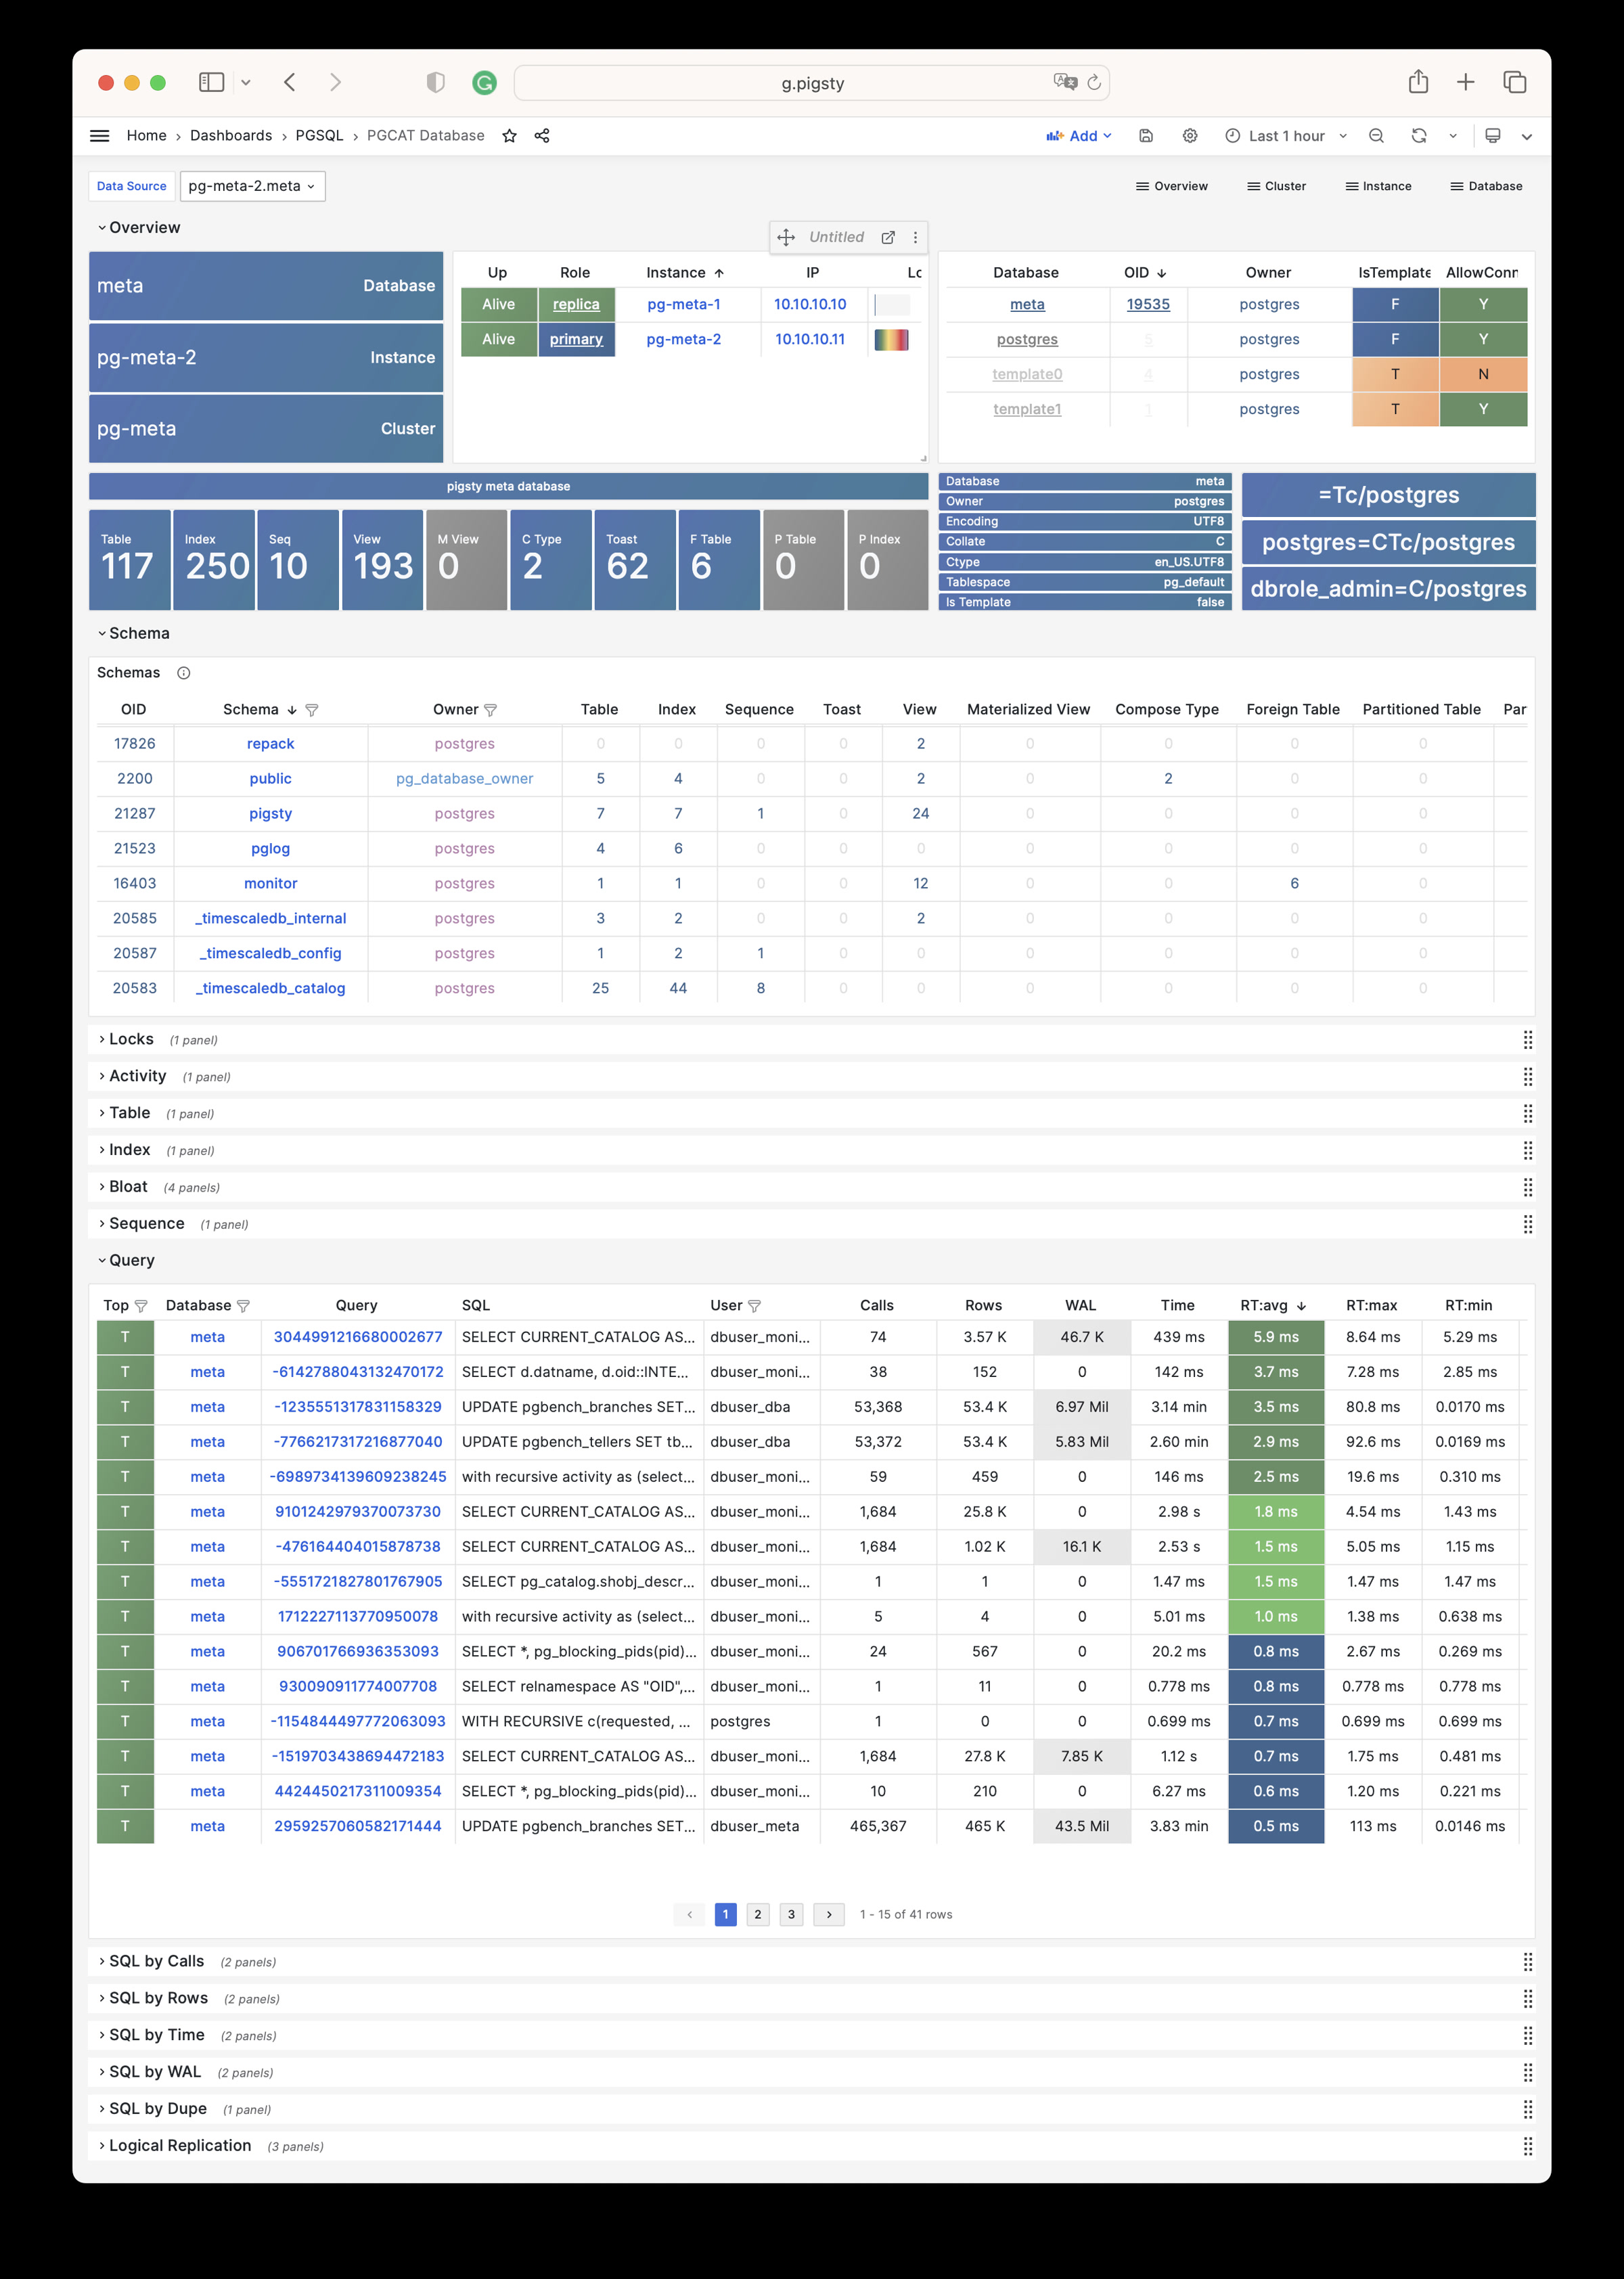
PGCAT Database: Database information retrieved directly from the database catalog
PGCAT Database
PGCAT Schema: Information about schemas retrieved directly from the database catalog (tables/indexes/sequences…)
PGCAT Schema
PGCAT Table: Details of a single table retrieved directly from the database catalog (stats/bloat…)
PGCAT Table
PGCAT Query: Details of a single query retrieved directly from the database catalog (SQL/stats)
PGCAT Query
PGCAT Locks: Information about activities and lock waits retrieved directly from the database catalog
PGCAT Locks
PGLOG
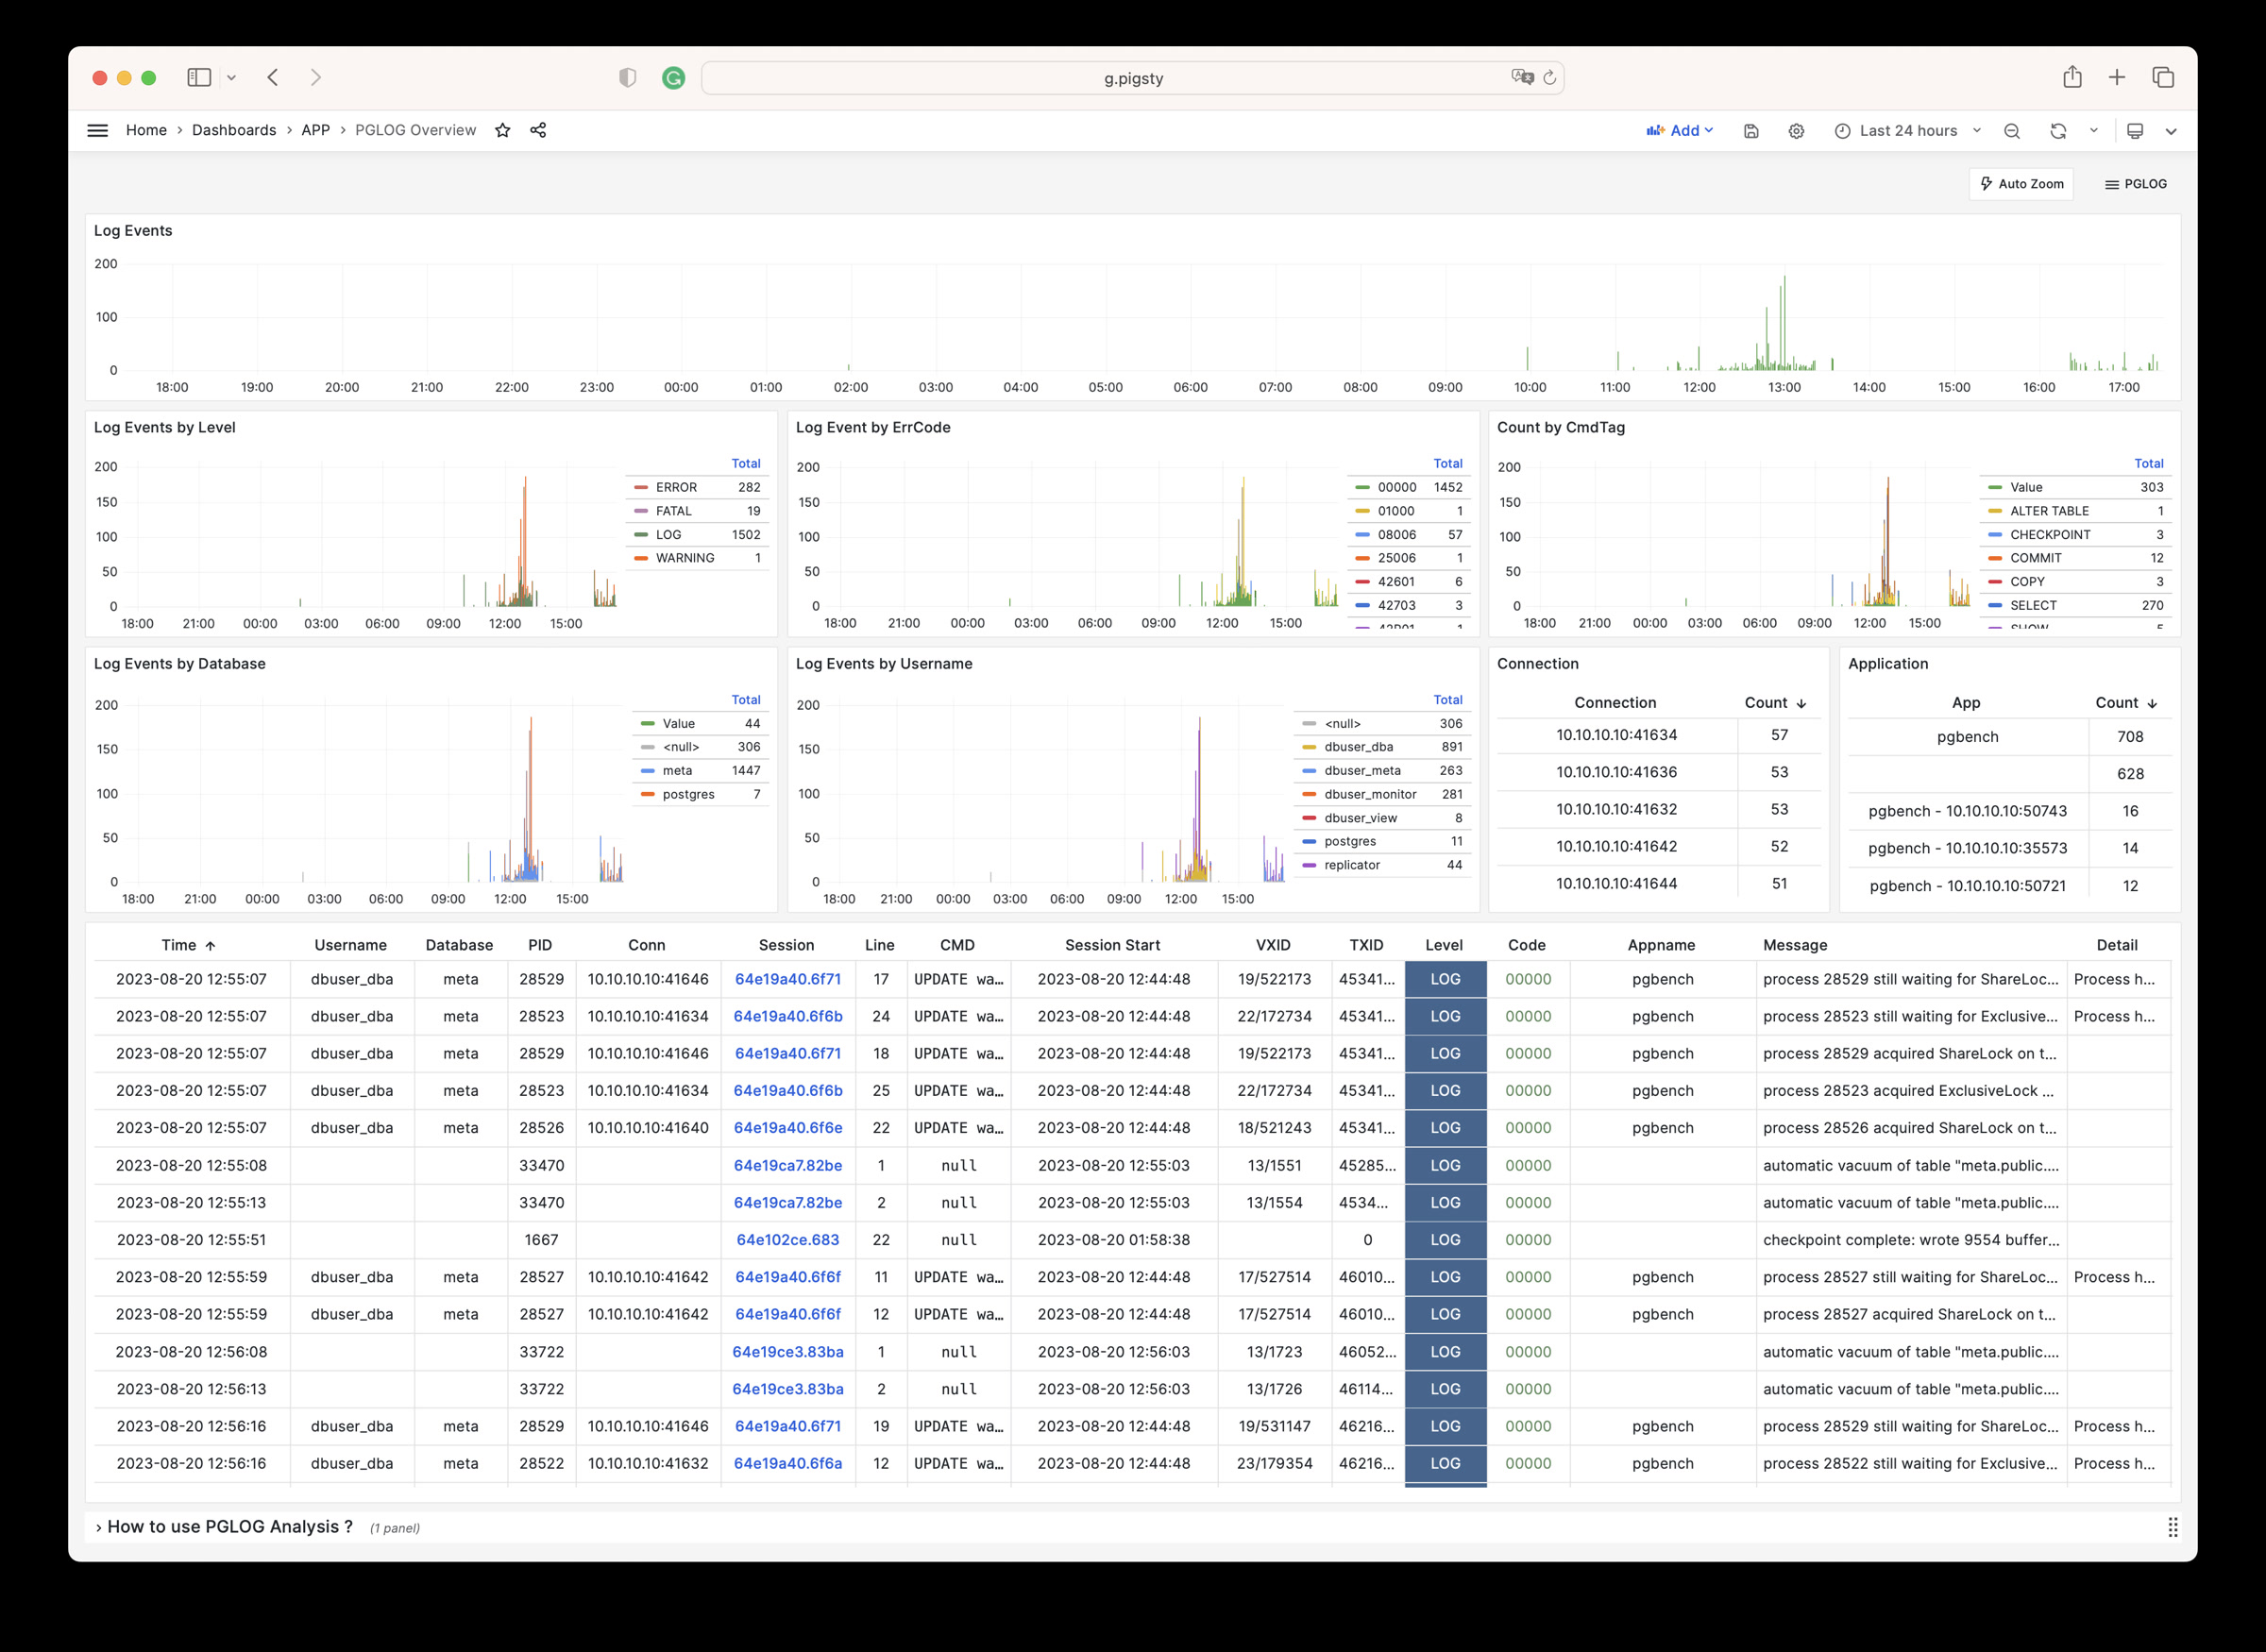
PGLOG Overview: Overview of CSV log samples in Pigsty CMDB
PGLOG Overview
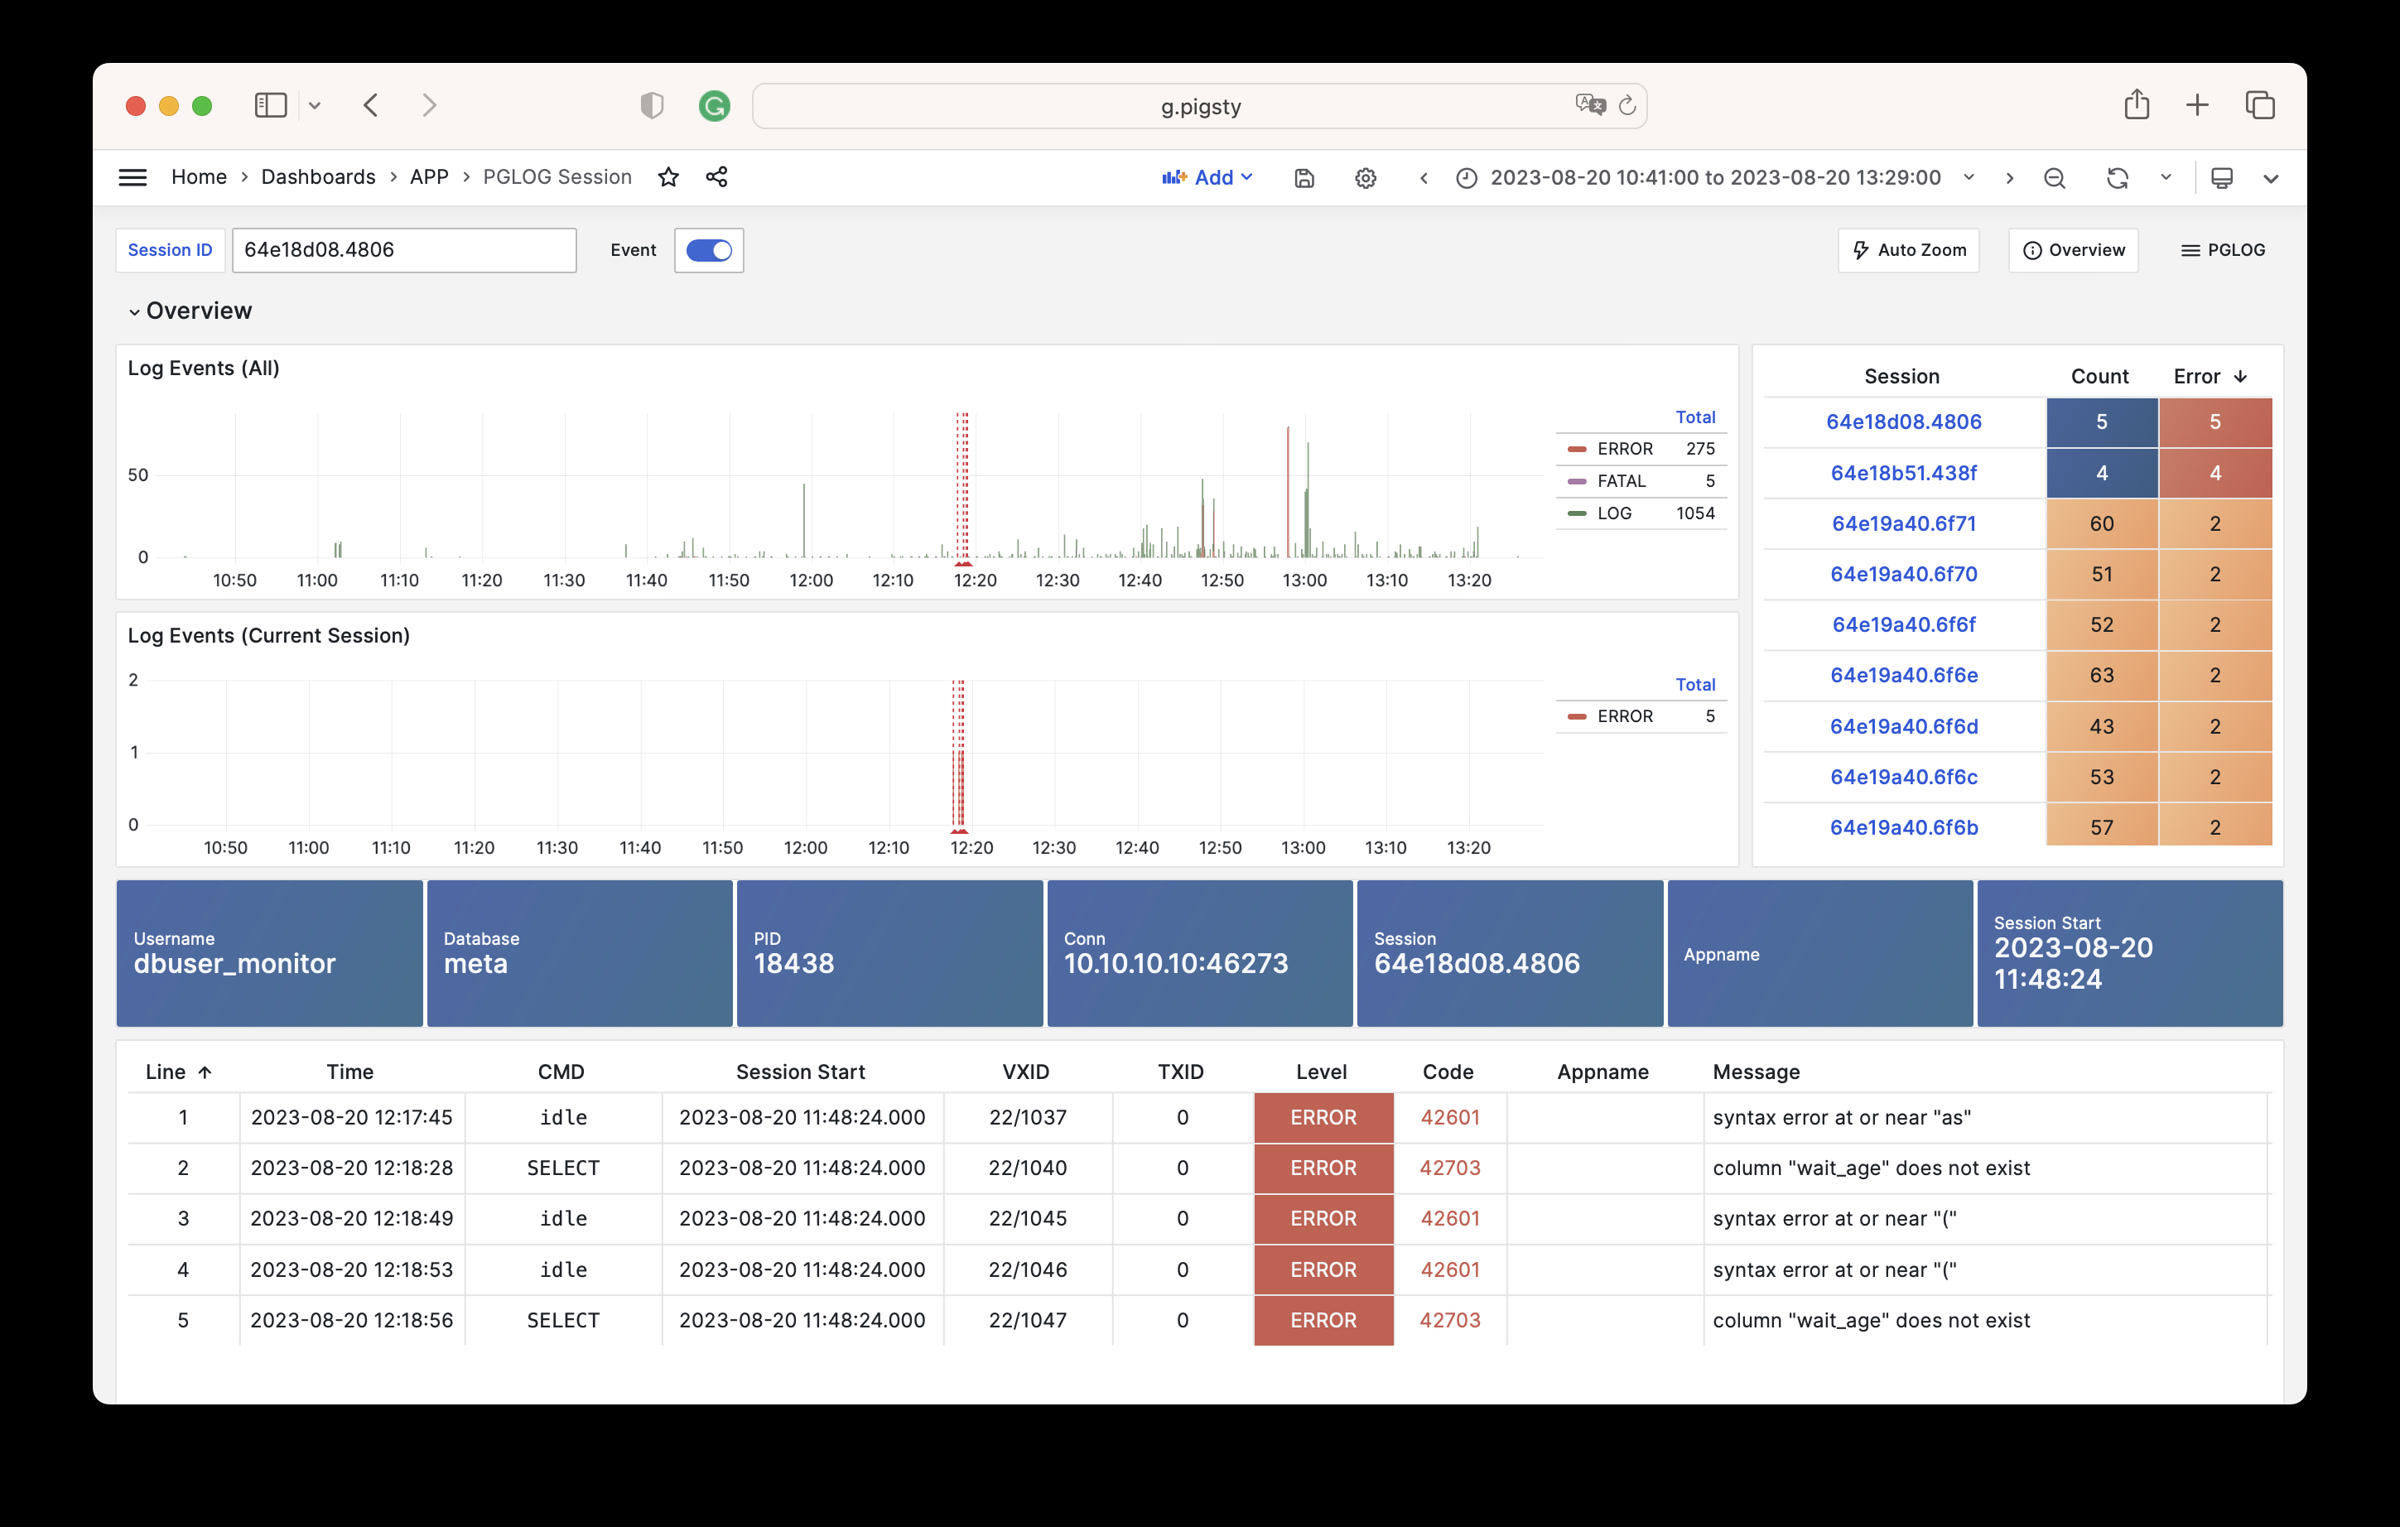
PGLOG Session: Log details of a session in CSV log samples in Pigsty CMDB
PGLOG Session
Gallery
For details, refer to pigsty/wiki/gallery.
PGSQL Overview
PGSQL Shard
PGSQL Cluster
PGSQL Service
PGSQL Activity
PGSQL Replication
PGSQL Databases
PGSQL Instance
PGSQL Proxy
PGSQL Pgbouncer
PGSQL Session
PGSQL Xacts
PGSQL Persist
PGSQL Database
PGSQL Tables
PGSQL Table
PGSQL Query
PGCAT Instance
PGCAT Database
PGCAT Schema
PGCAT Table
PGCAT Lock
PGCAT Query
PGLOG Overview
PGLOG Session
Feedback
Was this page helpful?
Thanks for the feedback! Please let us know how we can improve.
Sorry to hear that. Please let us know how we can improve.