Observable Graphics: Clarity and Vision
Heaven's movement, all-seeing view, perceiving details to master the whole!
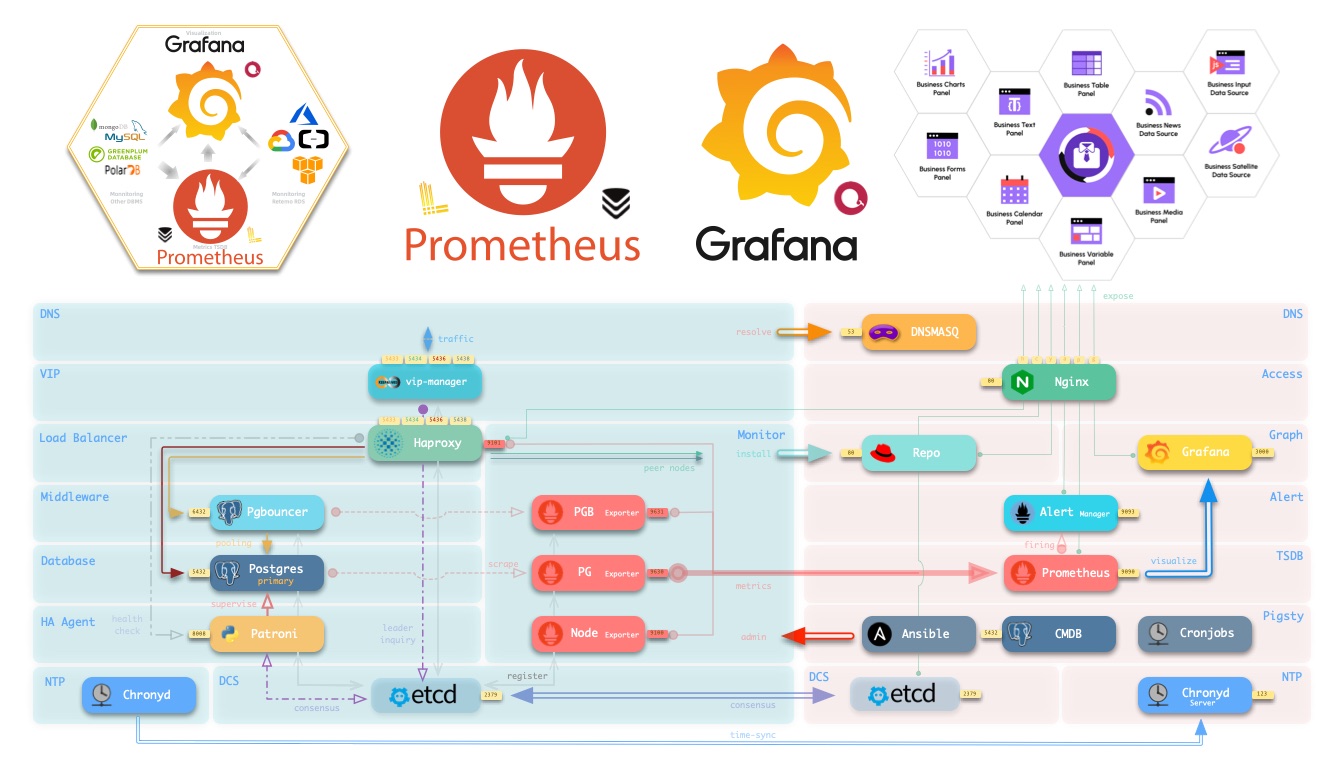
Monitoring Infra: Built-in Observability Stack
Ready-to-use Prometheus & Grafana observability tech stack
Automatic target discovery. Enterprise-grade monitoring without configure
- Time-series database: Prometheus / AlertManager / X Exporters
- Visualization: Grafana, Echarts, plus ten extra panels/data sources
- Log collection: Loki / Promtail, or VictoriaMetrics / Vector
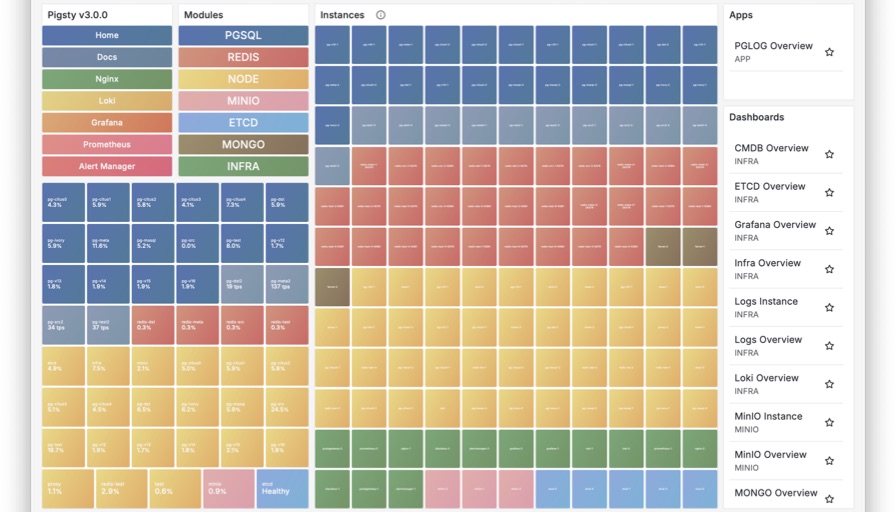
Data-Driven: Measure what you Manage
Monitoring built with data analytics and BI principles, turn metrics into insights
From macro overview to micro details, solid data support for administration
- 3000+ metrics, 666 pre-agg rules, collecting all possible observation points
- Unified labels for cross correlation, multi-level dashboard with nav links
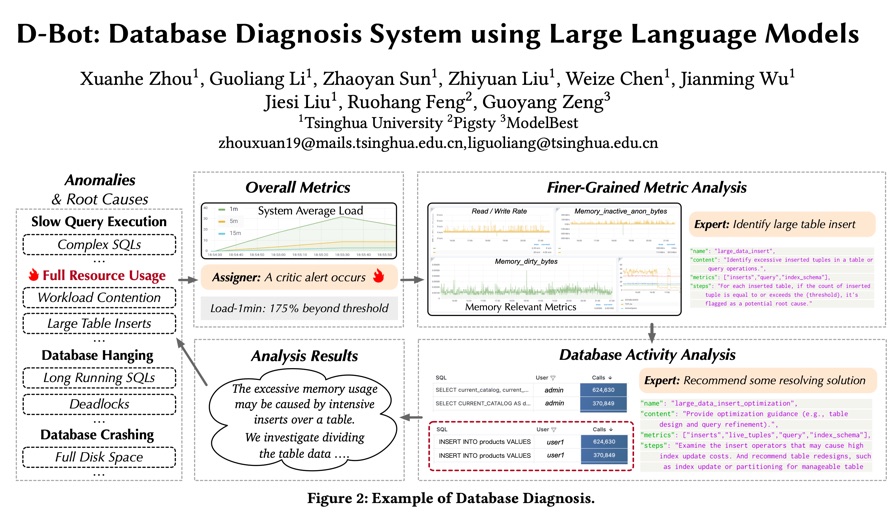
- Laying solid data context for intelligent AIOPS — 《D-Bot LLM as DBA》
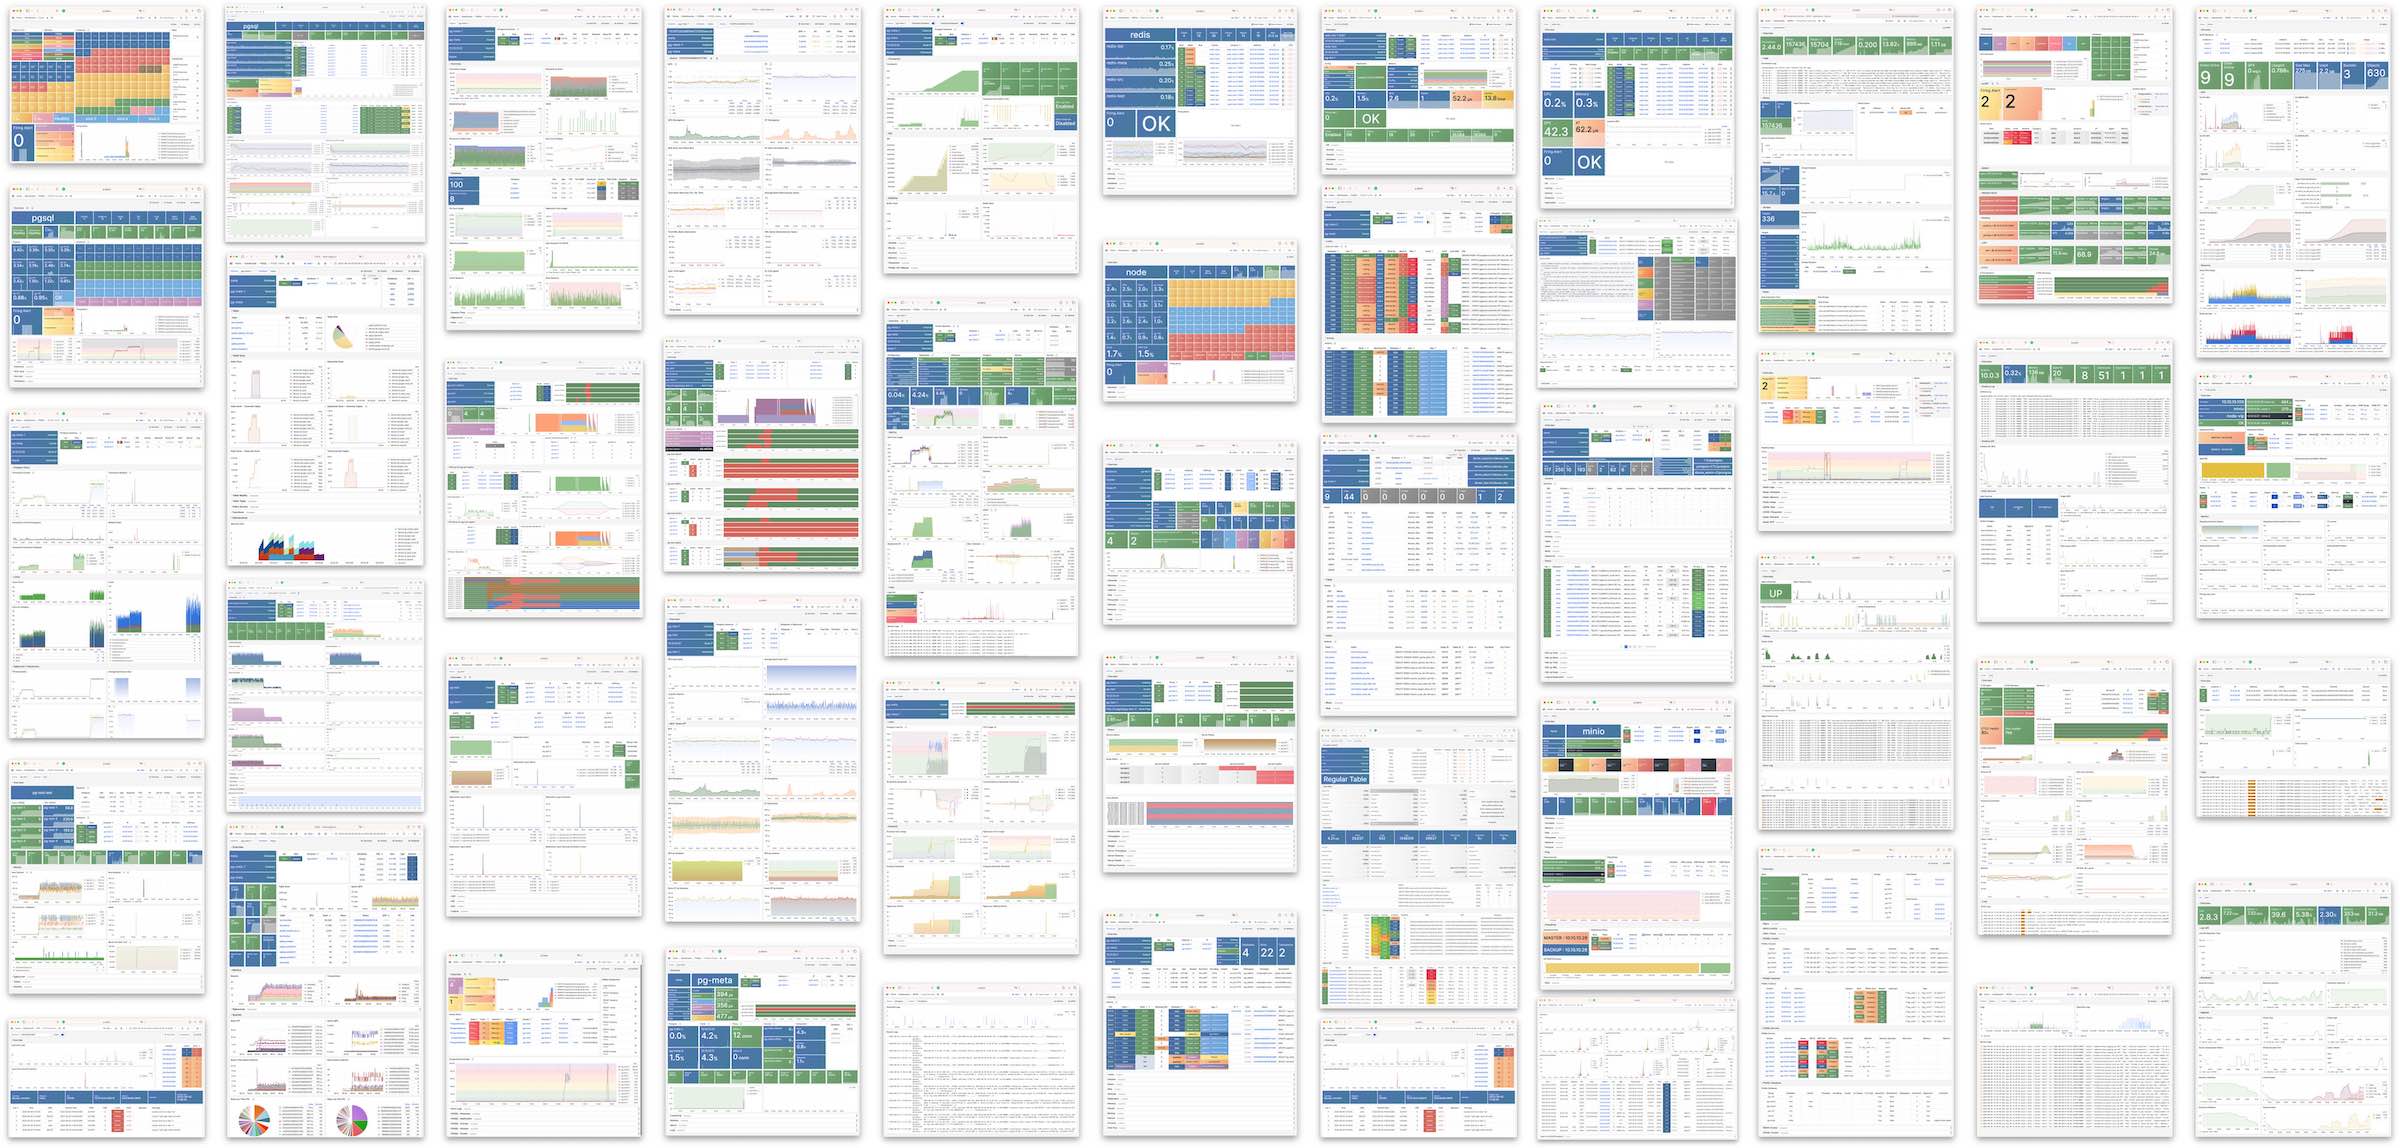
SOTA Experience: The Definitive PG monitoring
Five years of refinement for the ultimate PG monitoring experience.
Dig into tables, indexes, func, and query objects details
- Global/cluster/instance/database/object 5-levels, roll-up / drill-down easily
- Historical metrics of tables, indexes, functions, queries and other DB objects
- pg_exporter for postgres/pgbouncer metrics, fully customizable with YAML
Universal Monitoring: RDS or Compat Kernels
Monitoring cloud RDS PG or existing PG-compatible kernels
Monitoring nodes, dbms, apps, LB with correlation analysis
- Monitoring cloud vendors' RDS and PG-compatible kernel like Aurora
- Built-in support for: Node, Infra, MinIO, Etcd, Redis, Haproxy, Nginx…
- General monitoring solution for servers and other app, easy to integrate
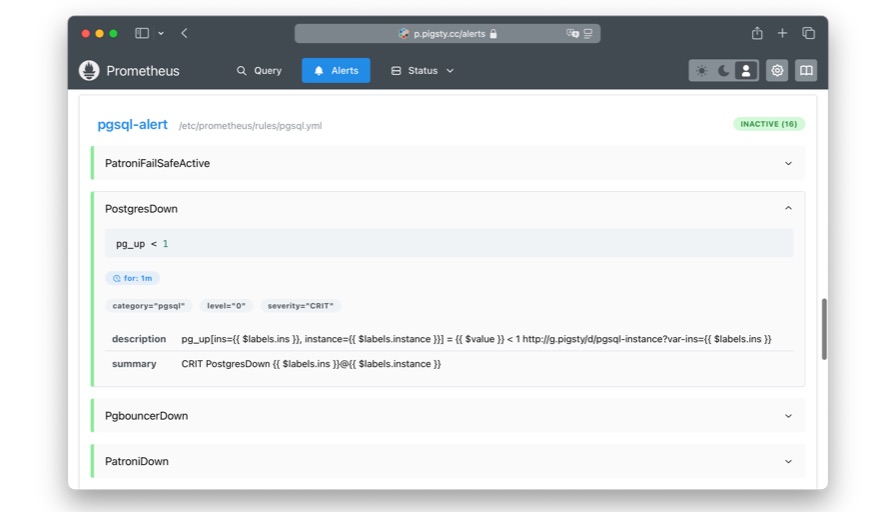
Automatic Alerts: No more manual checks
Production-tested preset alert rule sets with automatic event notification
Pre-aggregated rules, alerting dashboards, identify problem much faster
- AlertManager integration: aggregation, silencing, IM connectivity
- 56 preset alert rules covering all built-in Pigsty modules
- Alert info links to dashboards, improve fault diagnosis efficiency
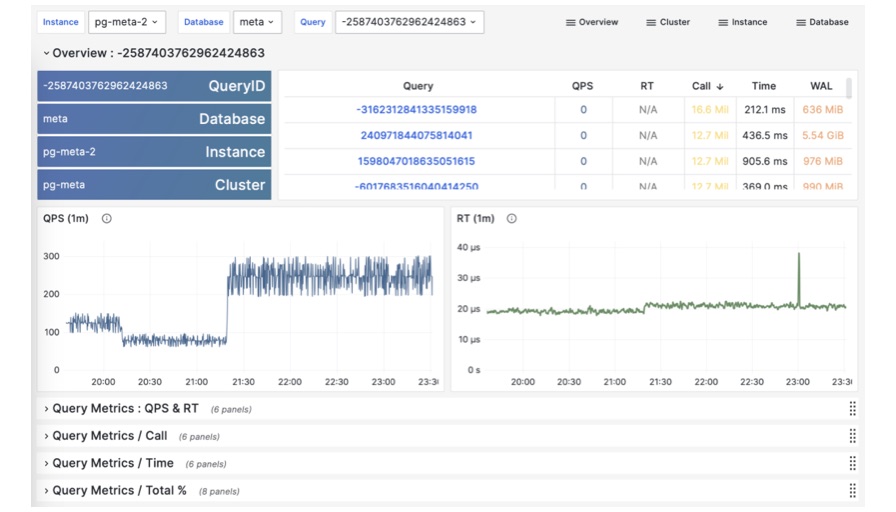
Performance Tuning: Slow-query Optimize
Combine metrics & catalogs to identify and optimize slow queries quickly
Dashboards for query details, with quantifiable comparison results
- pg_stat_statements historical records of slow query key metrics
- auto_explain records slow query execution plans and visualizes with PEV
- Use PGCAT to read and visualize PG catalog related data
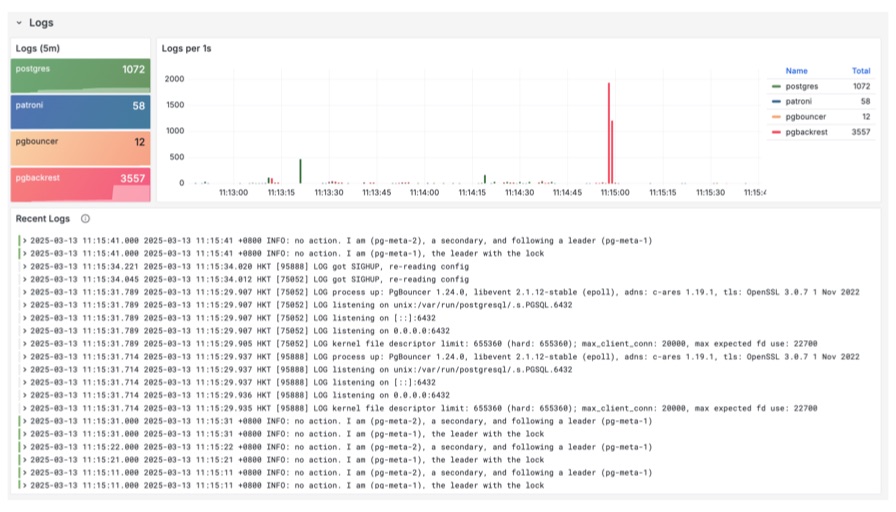
Log Analysis: Fast root-cause detection
Unified log collection system with Loki and Promtail, sys db log in one place
Search and filter logs with massive parallel grep, fast and efficient
- All log streams in one place, associated through labels, flexible search criteria
- Use PromQL to extract additional metrics from logs, such as error rates
- Use PGLOG application for interactive analysis of specific PG CSV log samples
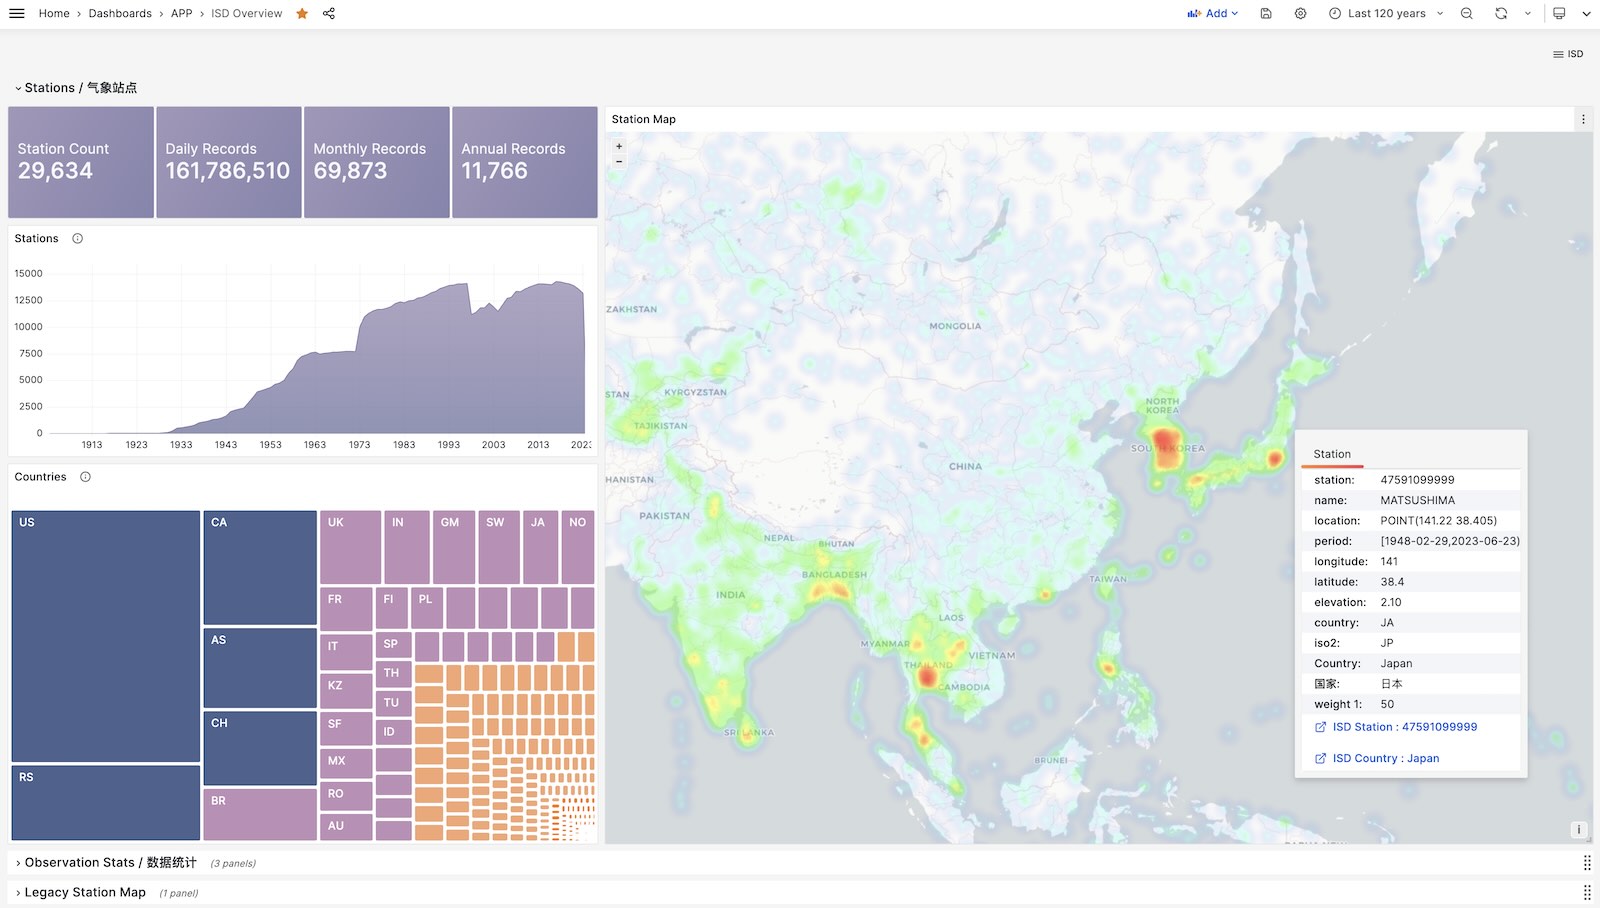
Custom Dashboards: Low-code Data App
PostgreSQL + Grafana + Echarts + VolkovLabs datasources/panels
Create interactive data app, quickly build prototypes and visualization demos
PIGSTY