Module: INFRA
Configuration | Administration | Playbooks | Monitoring | Parameters
Overview
Each Pigsty deployment includes infrastructure components that serve managed nodes and database clusters:
| Component | Port | Description |
|---|---|---|
| Nginx | 80/443 | Web service portal, local repo, and unified entry point |
| Grafana | 3000 | Visualization platform for monitoring dashboards and data apps |
| VictoriaMetrics | 8428 | Time-series database with VMUI, compatible with Prometheus API |
| VictoriaLogs | 9428 | Centralized log database, receives structured logs from Vector |
| VictoriaTraces | 10428 | Tracing and event storage for slow SQL / request tracing |
| VMAlert | 8880 | Alert rule evaluator, triggers alerts based on VictoriaMetrics metrics |
| AlertManager | 9059 | Alert aggregation and dispatch, receives notifications from VMAlert |
| BlackboxExporter | 9115 | ICMP/TCP/HTTP blackbox probing |
| DNSMASQ | 53 | DNS server for internal domain resolution |
| Chronyd | 123 | NTP time server |
| PostgreSQL | 5432 | CMDB and default database |
| Ansible | - | Runs playbooks, orchestrates all infrastructure |
In Pigsty, the PGSQL module uses some services on INFRA nodes, specifically:
- Database cluster/host node domains depend on DNSMASQ on INFRA nodes for resolution.
- Installing software on database nodes uses the local yum/apt repo hosted by Nginx on INFRA nodes.
- VictoriaMetrics on INFRA nodes collects and stores database cluster and node metrics. Access them through VMUI / PromQL.
- Vector collects database and node runtime logs and sends them to VictoriaLogs on INFRA nodes. Search these logs in Grafana.
- VMAlert evaluates alert rules based on metrics in VictoriaMetrics and forwards events to Alertmanager.
- Users initiate management of database nodes from Infra/Admin nodes using Ansible or other tools:
- Execute cluster creation, scaling, instance/cluster recycling
- Create business users, databases, modify services, HBA changes;
- Execute log collection, garbage cleanup, backup, inspections, etc.
- Database nodes sync time from the NTP server on INFRA/ADMIN nodes by default
- If no dedicated cluster exists, the HA component Patroni uses etcd on INFRA nodes as the HA DCS.
- If no dedicated cluster exists, the backup component pgbackrest uses MinIO on INFRA nodes as an optional centralized backup repository.
Nginx
Nginx provides access to all Pigsty WebUI services. It uses port 80 on the admin node by default.
Nginx exposes infrastructure WebUIs, including Grafana, VictoriaMetrics (VMUI), AlertManager, and HAProxy traffic management pages. It also serves static files, including yum/apt repositories.
Nginx exposes built-in Web services through subpaths under i.pigsty by default. The infra_portal configuration also lets Nginx route requests to upstream components by domain name.
If you use other domains or public domains, you can modify them here:
Pigsty strongly recommends using domain names to access Pigsty UI systems rather than direct IP+port access, for these reasons:
- Domains simplify HTTPS encryption and centralize access through Nginx. They also simplify request auditing and authentication integration.
- Some components only listen on 127.0.0.1 by default, so they can only be accessed through Nginx proxy.
- Domain names are easier to remember and provide additional configuration flexibility.
Without internet domains or local DNS, add static resolution records on the client. Use /etc/hosts on MacOS/Linux or C:\Windows\System32\drivers\etc\hosts on Windows.
Nginx configuration parameters are at: Configuration: INFRA - NGINX
Local Software Repository
Pigsty creates a local software repository during installation to accelerate subsequent software installation.
Nginx serves this repository. Its default directory is /www/pigsty, and its URL is http://i.pigsty/pigsty.
A Pigsty offline bundle is a compressed prebuilt RPM/APT repository directory. The current source uses SOW to create repositories. If /www/pigsty/repo_complete exists, Pigsty treats the local repository as complete and skips upstream downloads. This file contains SHA-256 checksums. It is not an empty marker.
The repo definition file is at /www/pigsty.repo, accessible by default via http://${admin_ip}/pigsty.repo
You can also use the file local repo directly without Nginx:
Local repository configuration parameters are at: Configuration: INFRA - REPO
Victoria Observability Suite
Pigsty v4 replaces Prometheus/Loki with the VictoriaMetrics family. These components provide integrated monitoring, logging, and tracing:
- VictoriaMetrics listens on port
8428by default. Access VMUI athttps://i.pigsty/vmetrics/. Its API is compatible with Prometheus. You can also configure a dedicated domain ininfra_portal. - VMAlert evaluates alert rules in
/infra/rules/*.yml, listens on port8880, and sends alert events to Alertmanager. - VictoriaLogs listens on port
9428. Query logs throughhttps://i.pigsty/vlogs/. All nodes run Vector by default to send structured system logs, PostgreSQL logs, and other logs to VictoriaLogs. - VictoriaTraces listens on port
10428for slow SQL / Trace collection. Grafana accesses it as a Jaeger datasource. - Alertmanager listens on port
9059. Manage alert notifications athttps://i.pigsty/alertmgr/. To use a dedicated domain, configurea.pigstyininfra_portal. Configure SMTP, Webhook, or another receiver to send notifications. - Blackbox Exporter listens on port
9115by default for Ping/TCP/HTTP probing, accessible viahttps://i.pigsty/blackbox/.
For more information, see: Configuration: INFRA - VICTORIA and Configuration: INFRA - PROMETHEUS.
Grafana
Grafana is the core of Pigsty’s WebUI. It listens on port 3000 by default. Access it through https://i.pigsty/ui/ or directly at IP:3000. To use a dedicated domain, configure g.pigsty in infra_portal.
Pigsty includes preconfigured VictoriaMetrics / Logs / Traces datasources: vmetrics-*, vlogs-*, and vtraces-*. It also includes many dashboards with URL-based navigation to help locate problems quickly.
Grafana also serves as a general low-code visualization platform. Pigsty installs plugins such as ECharts and victoriametrics-datasource by default. Use these plugins to build monitoring dashboards or inspection reports.
Grafana configuration parameters are at: Configuration: INFRA - GRAFANA.
Ansible
Pigsty installs Ansible on the meta node by default. Ansible uses declarative configuration and idempotent playbooks. These features reduce system maintenance complexity.
DNSMASQ
DNSMASQ provides DNS resolution services within the environment. Domain names from other modules are registered with the DNSMASQ service on INFRA nodes.
DNS records are placed by default in the /etc/dnsmasq.d/pigsty/ directory on all INFRA nodes.
DNSMASQ configuration parameters are at: Configuration: INFRA - DNS
Chronyd
NTP service synchronizes time across all nodes in the environment (optional)
NTP configuration parameters are at: Configuration: NODES - NTP
PostgreSQL
Pigsty’s metadata database (CMDB) usually runs on PostgreSQL, listening on port 5432 by default. It stores Pigsty metadata and backs several built-in applications.
For details, see the PGSQL module and Configuration: INFRA - META.
Configuration
To install INFRA on a node, add it to the infra inventory group. Assign an instance number with infra_seq.
Then use the infra.yml playbook to initialize the INFRA module on the nodes.
Administration
Here are some administration tasks related to the INFRA module:
Install/Uninstall Infra Module
infra-rm.yml has no deletion safeguard. Without tags, it removes infra_data, nginx_data, nginx_home (default: /www), and /var/lib/grafana.
If you only need to stop services or deregister targets, use tags. See Playbooks for the complete removal scope.
Manage Local Software Repository
You can use the following playbook subtasks to manage the local yum repo on Infra nodes:
The most commonly used commands are:
Manage Infrastructure Components
You can use the following playbook subtasks to manage various infrastructure components on Infra nodes:
Other commonly used tasks include:
Playbooks
Pigsty provides three playbooks related to the INFRA module:
infra.yml: Initialize pigsty infrastructure on infra nodesinfra-rm.yml: Remove infrastructure components from infra nodesdeploy.yml: Deploy the NODE, INFRA, ETCD, MINIO, and PGSQL core chain in one pass
infra.yml
The INFRA module playbook infra.yml initializes pigsty infrastructure on INFRA nodes
Executing this playbook completes the following tasks
- Configure meta node directories and environment variables
- Download and build a local software repository to accelerate subsequent installation. (If using offline package, skip download phase)
- Add the current meta node as a regular node under Pigsty management
- Deploy infrastructure components including VictoriaMetrics/Logs/Traces, VMAlert, Grafana, Alertmanager, Blackbox Exporter, etc.
This playbook executes on INFRA nodes by default
- Pigsty uses the current node executing this playbook as Pigsty’s INFRA node and ADMIN node by default.
- During configuration, Pigsty marks the current node as the Infra/Admin node. It replaces
10.10.10.10in templates with the current node’s primary IP address. - Besides initiating management and hosting infrastructure, this node is no different from a regular managed node.
- In single-node installation, ETCD is also installed on this node to provide DCS service
Notes about this playbook
- This playbook is idempotent. Repeated execution wipes infrastructure components on meta nodes.
- To preserve historical monitoring data, first set
vmetrics_clean,vlogs_clean,vtraces_cleantofalse. - If
/www/pigsty/repo_completeexists, the playbook skips internet downloads. Full execution takes about 5-8 minutes, depending on machine configuration. - Downloading directly from upstream internet sources without offline package may take 10-20 minutes depending on your network conditions.

infra-rm.yml
The INFRA module playbook infra-rm.yml removes pigsty infrastructure from INFRA nodes
Common subtasks include:
Full execution has no deletion safeguard and removes infra_data, nginx_data, nginx_home (default: /www), and /var/lib/grafana. Back up any data you need before running it.
deploy.yml
The deploy.yml playbook deploys the NODE, INFRA, ETCD, MINIO, and PGSQL core chain on all nodes in one pass. Optional modules such as Docker, Redis, Kafka, native MySQL, JUICE, and VIBE require their own playbooks.
This playbook is described in more detail in Playbook: One-Time Installation.
Monitoring
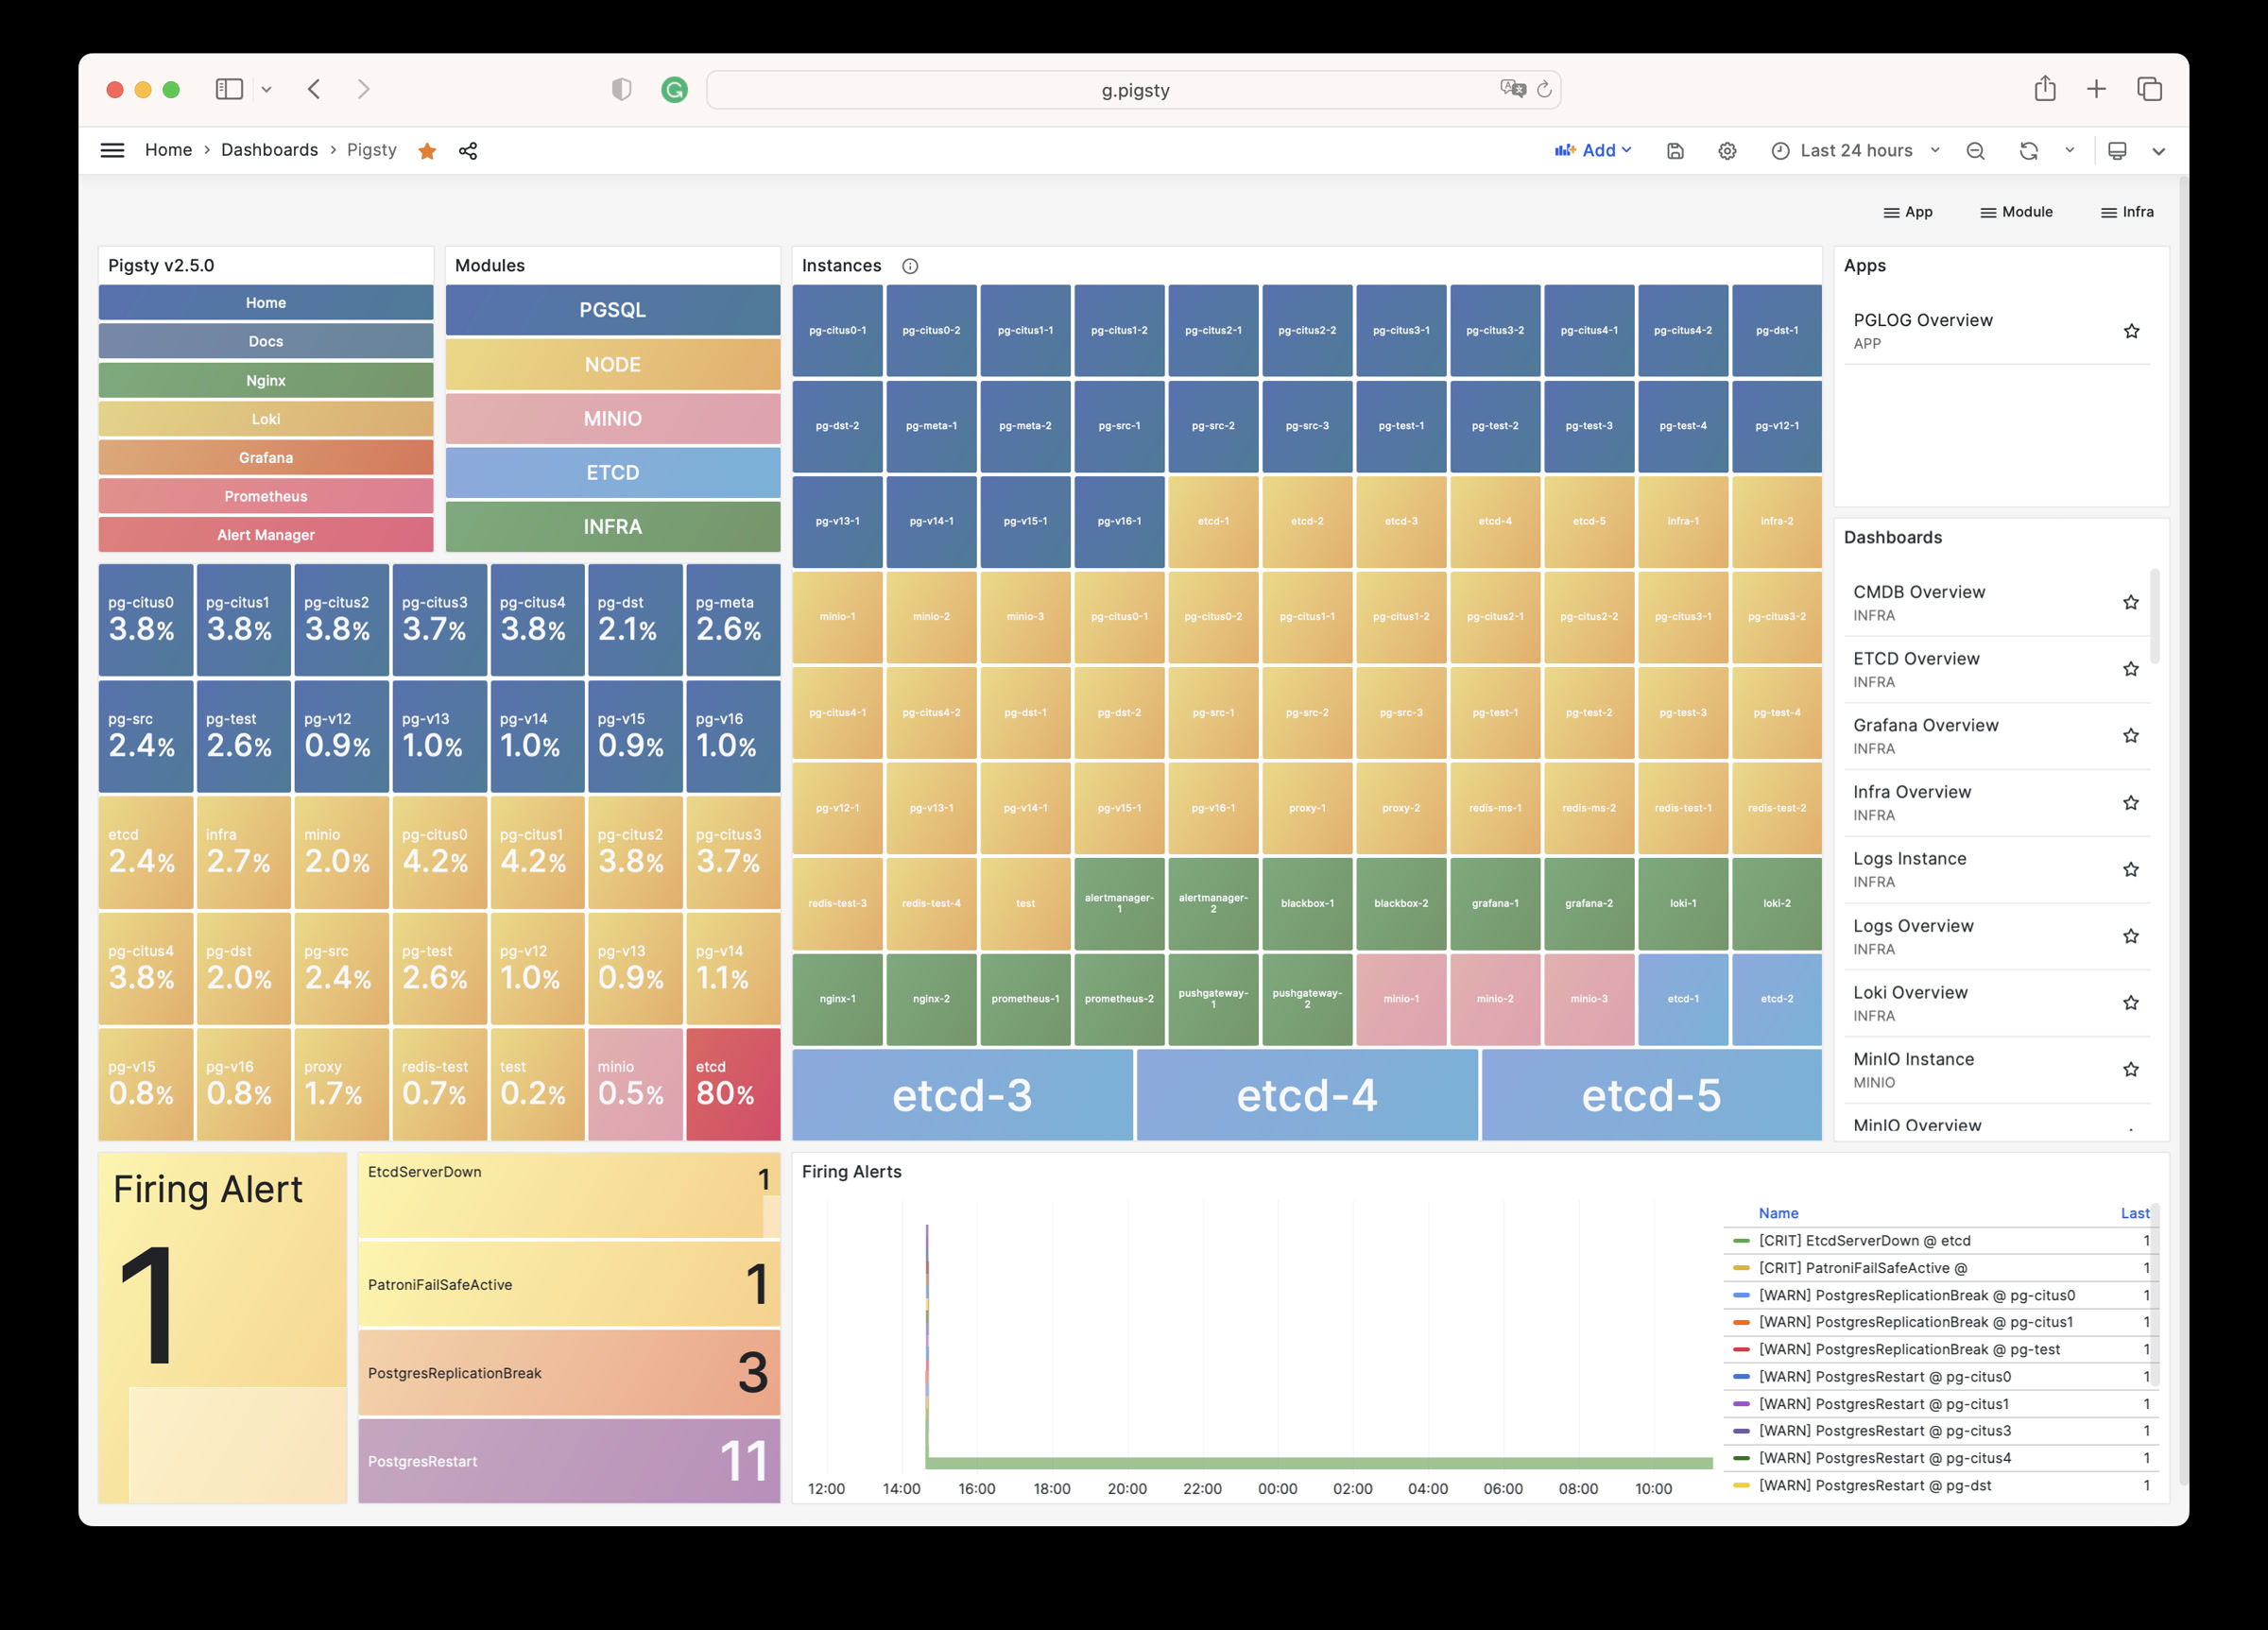
Pigsty Home: Pigsty monitoring system homepage
Pigsty Home Dashboard
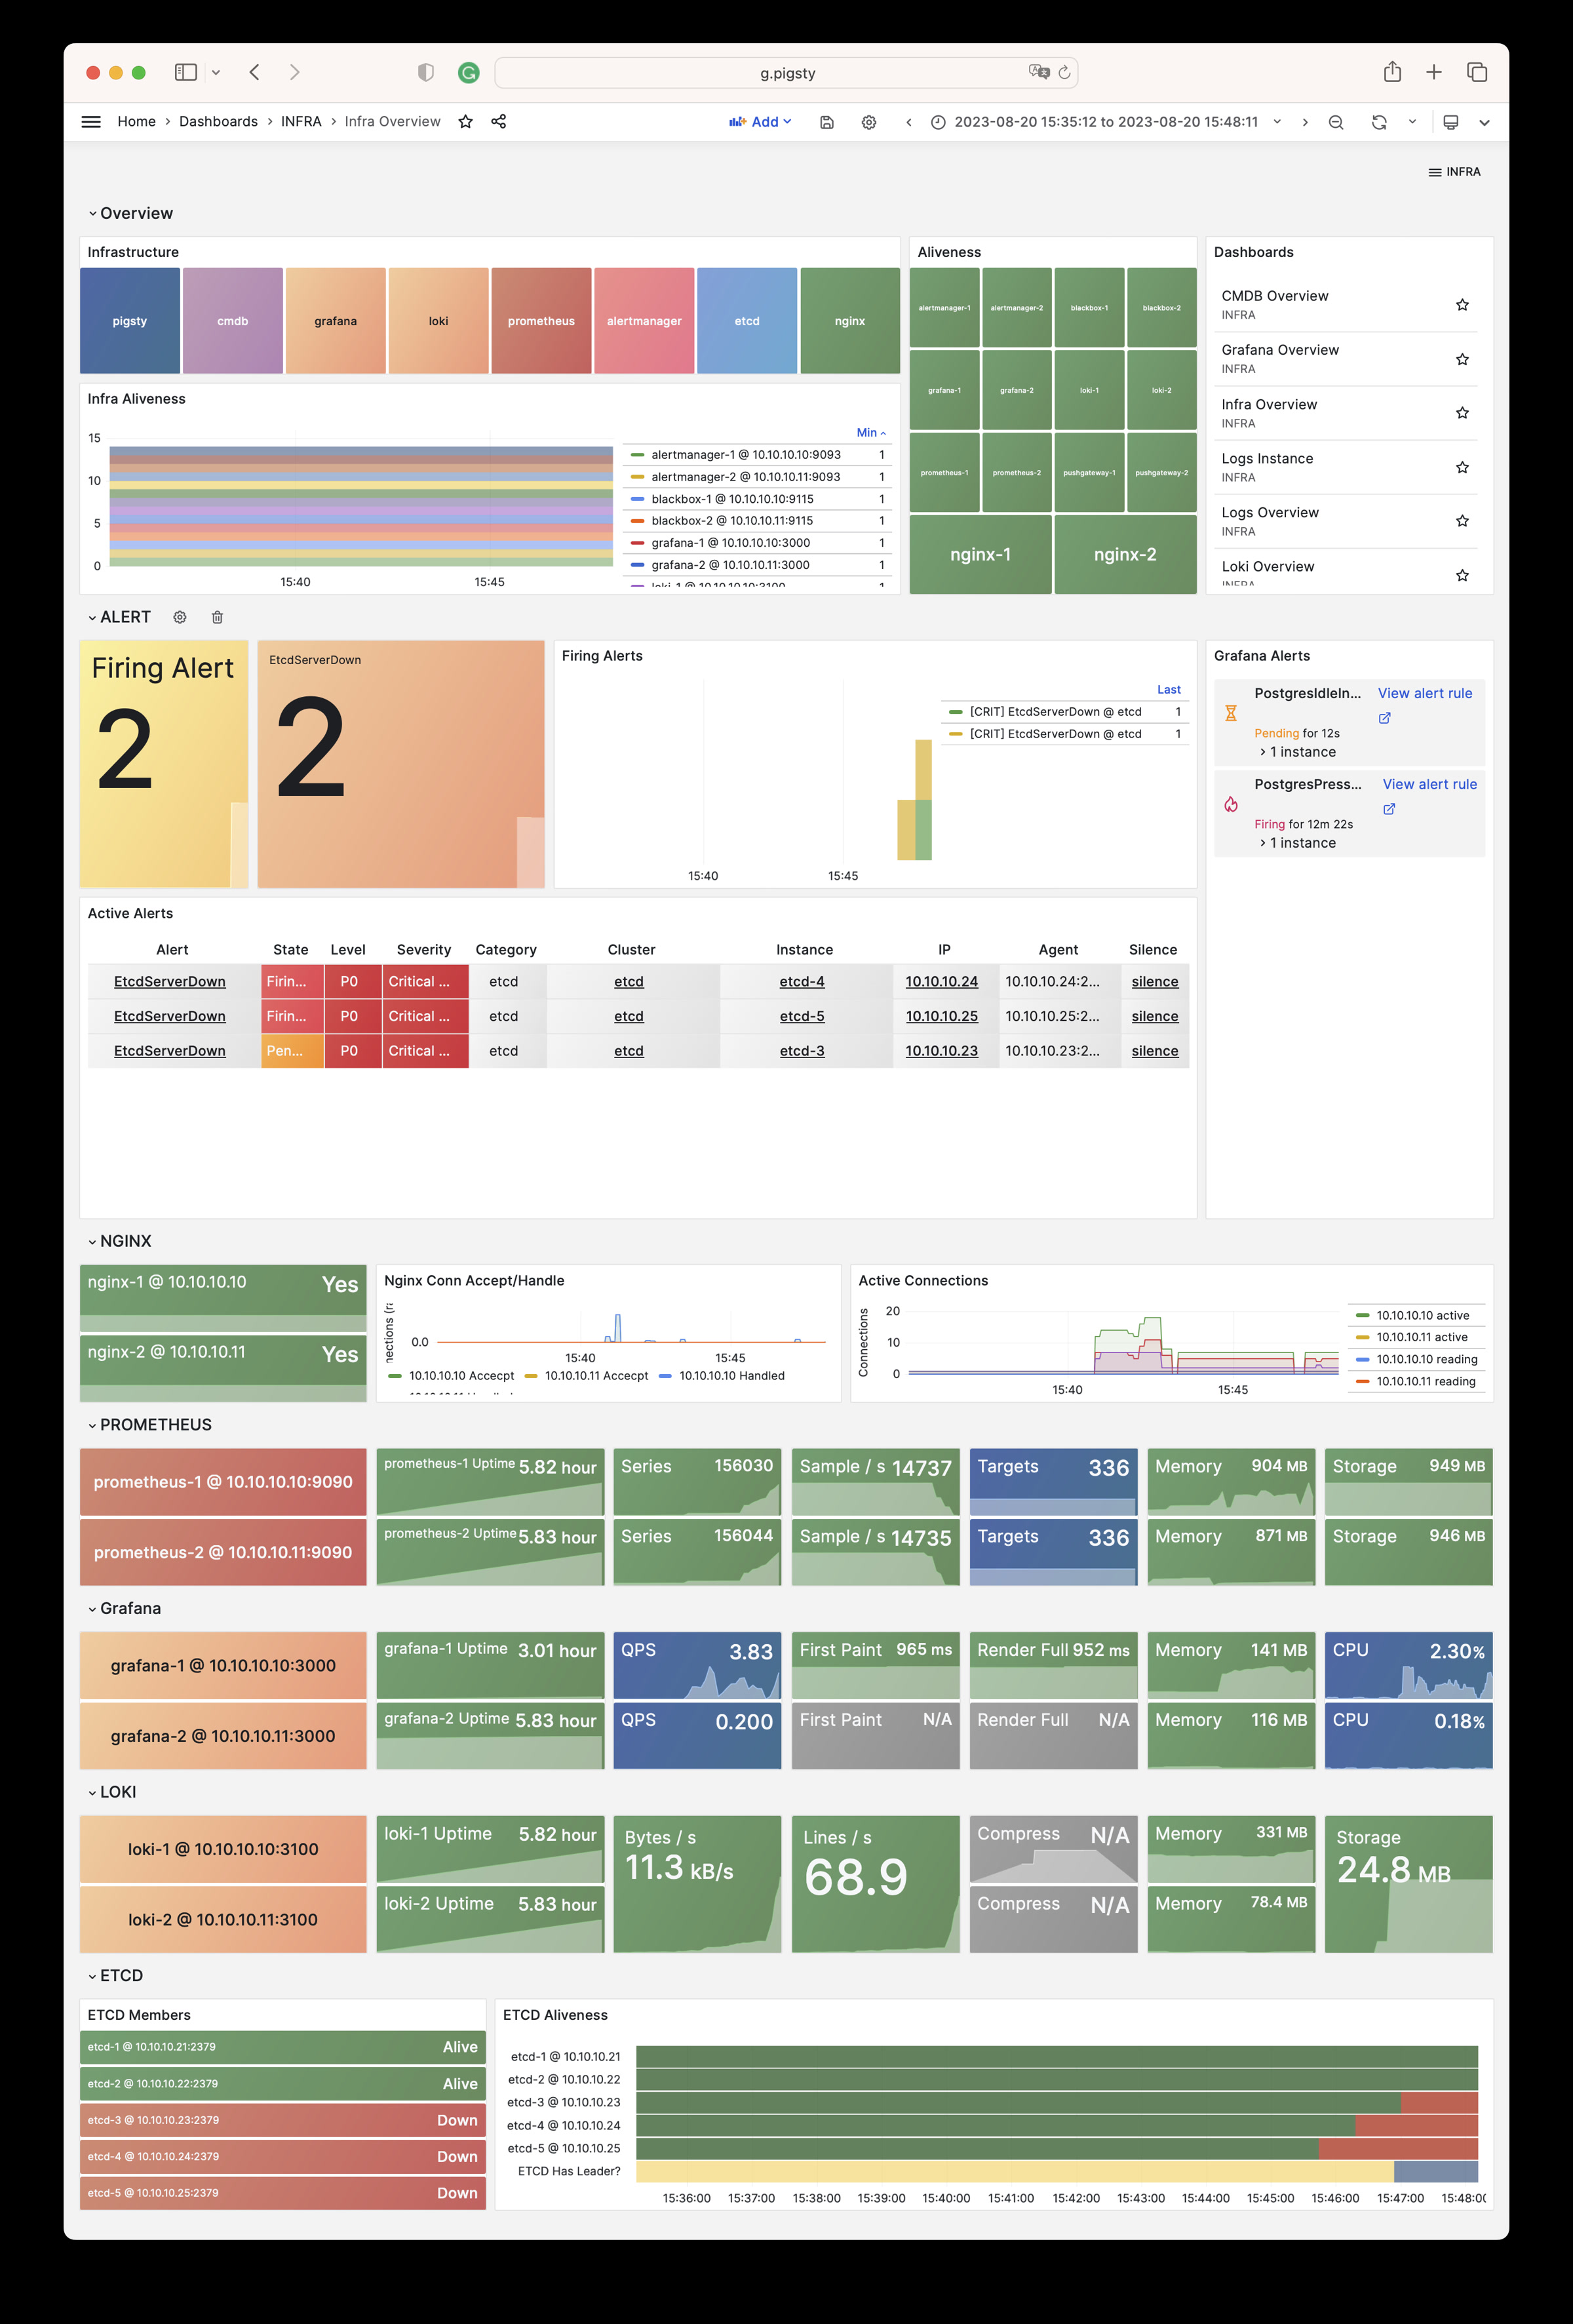
INFRA Overview: Pigsty infrastructure self-monitoring overview
INFRA Overview Dashboard
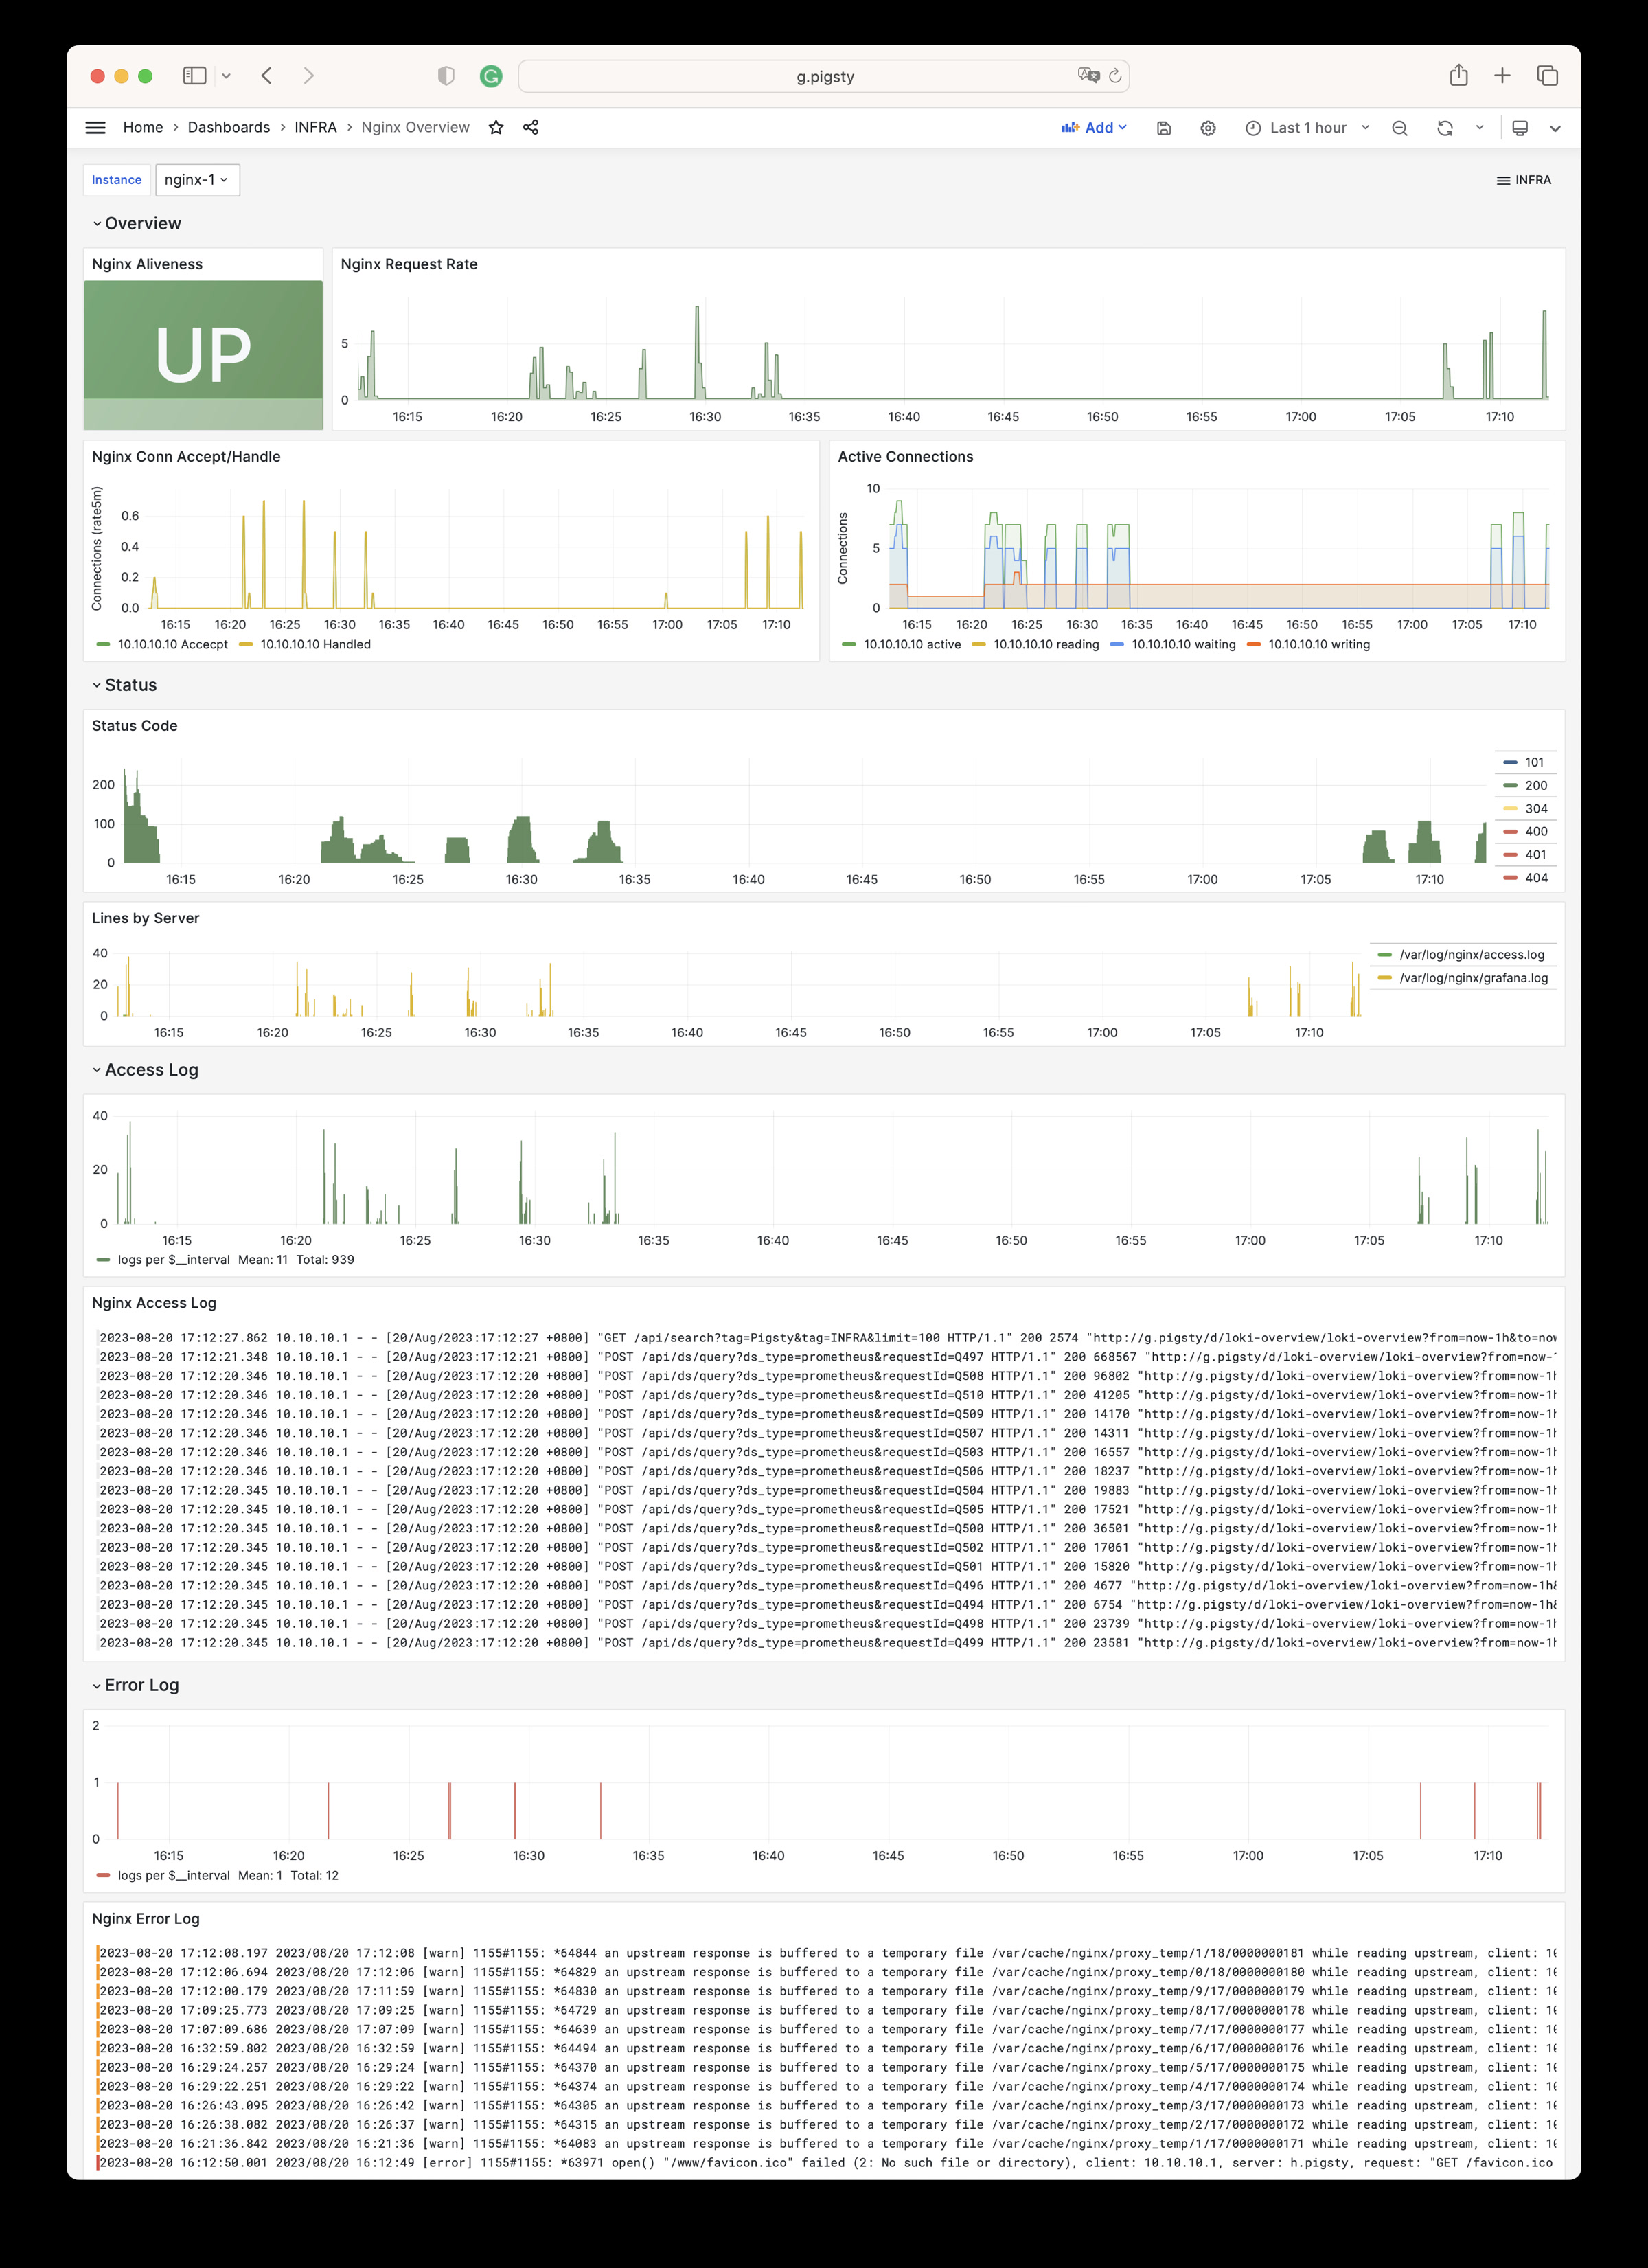
Nginx Instance: Nginx metrics and logs
Nginx Overview Dashboard
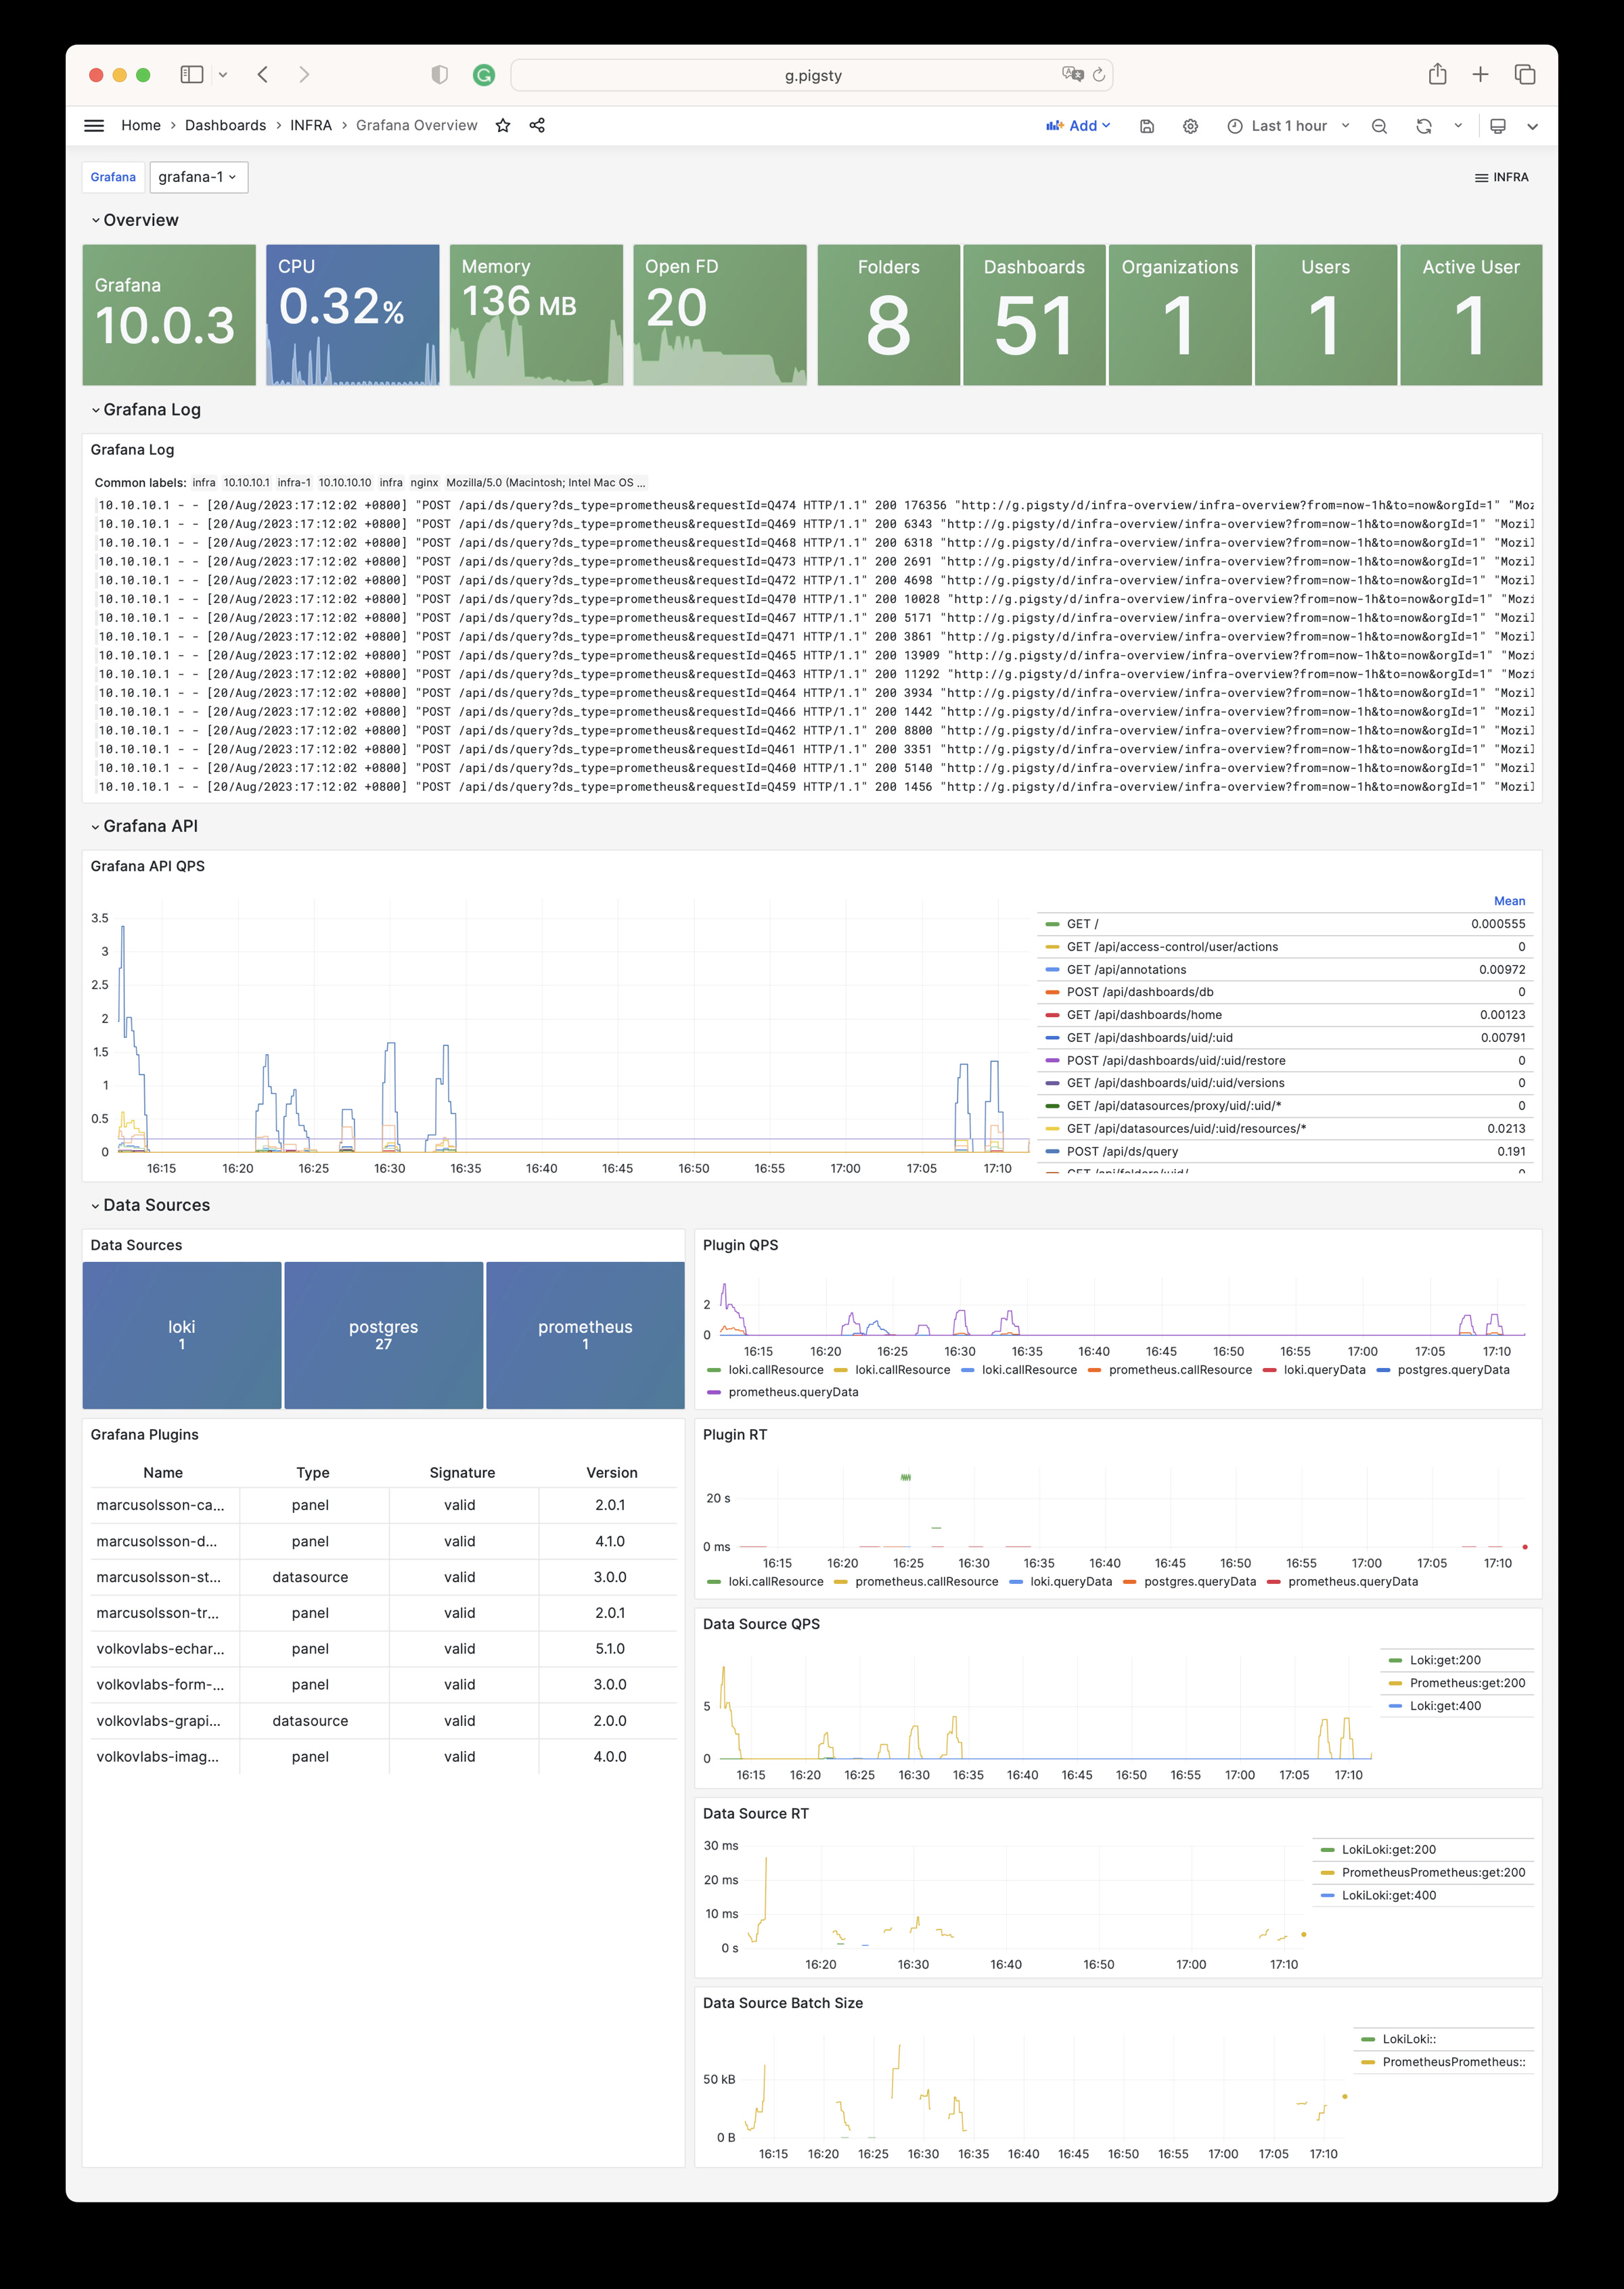
Grafana Instance: Grafana metrics and logs
Grafana Overview Dashboard
VictoriaMetrics Instance: VictoriaMetrics scraping, querying, and storage metrics
VMAlert Instance: Alert rule evaluation and queue status
Alertmanager Instance: Alert aggregation, notification pipelines, and Silences
VictoriaLogs Instance: Log ingestion rate, query load, and index hits
VictoriaTraces Instance: Trace/KV storage and Jaeger interface
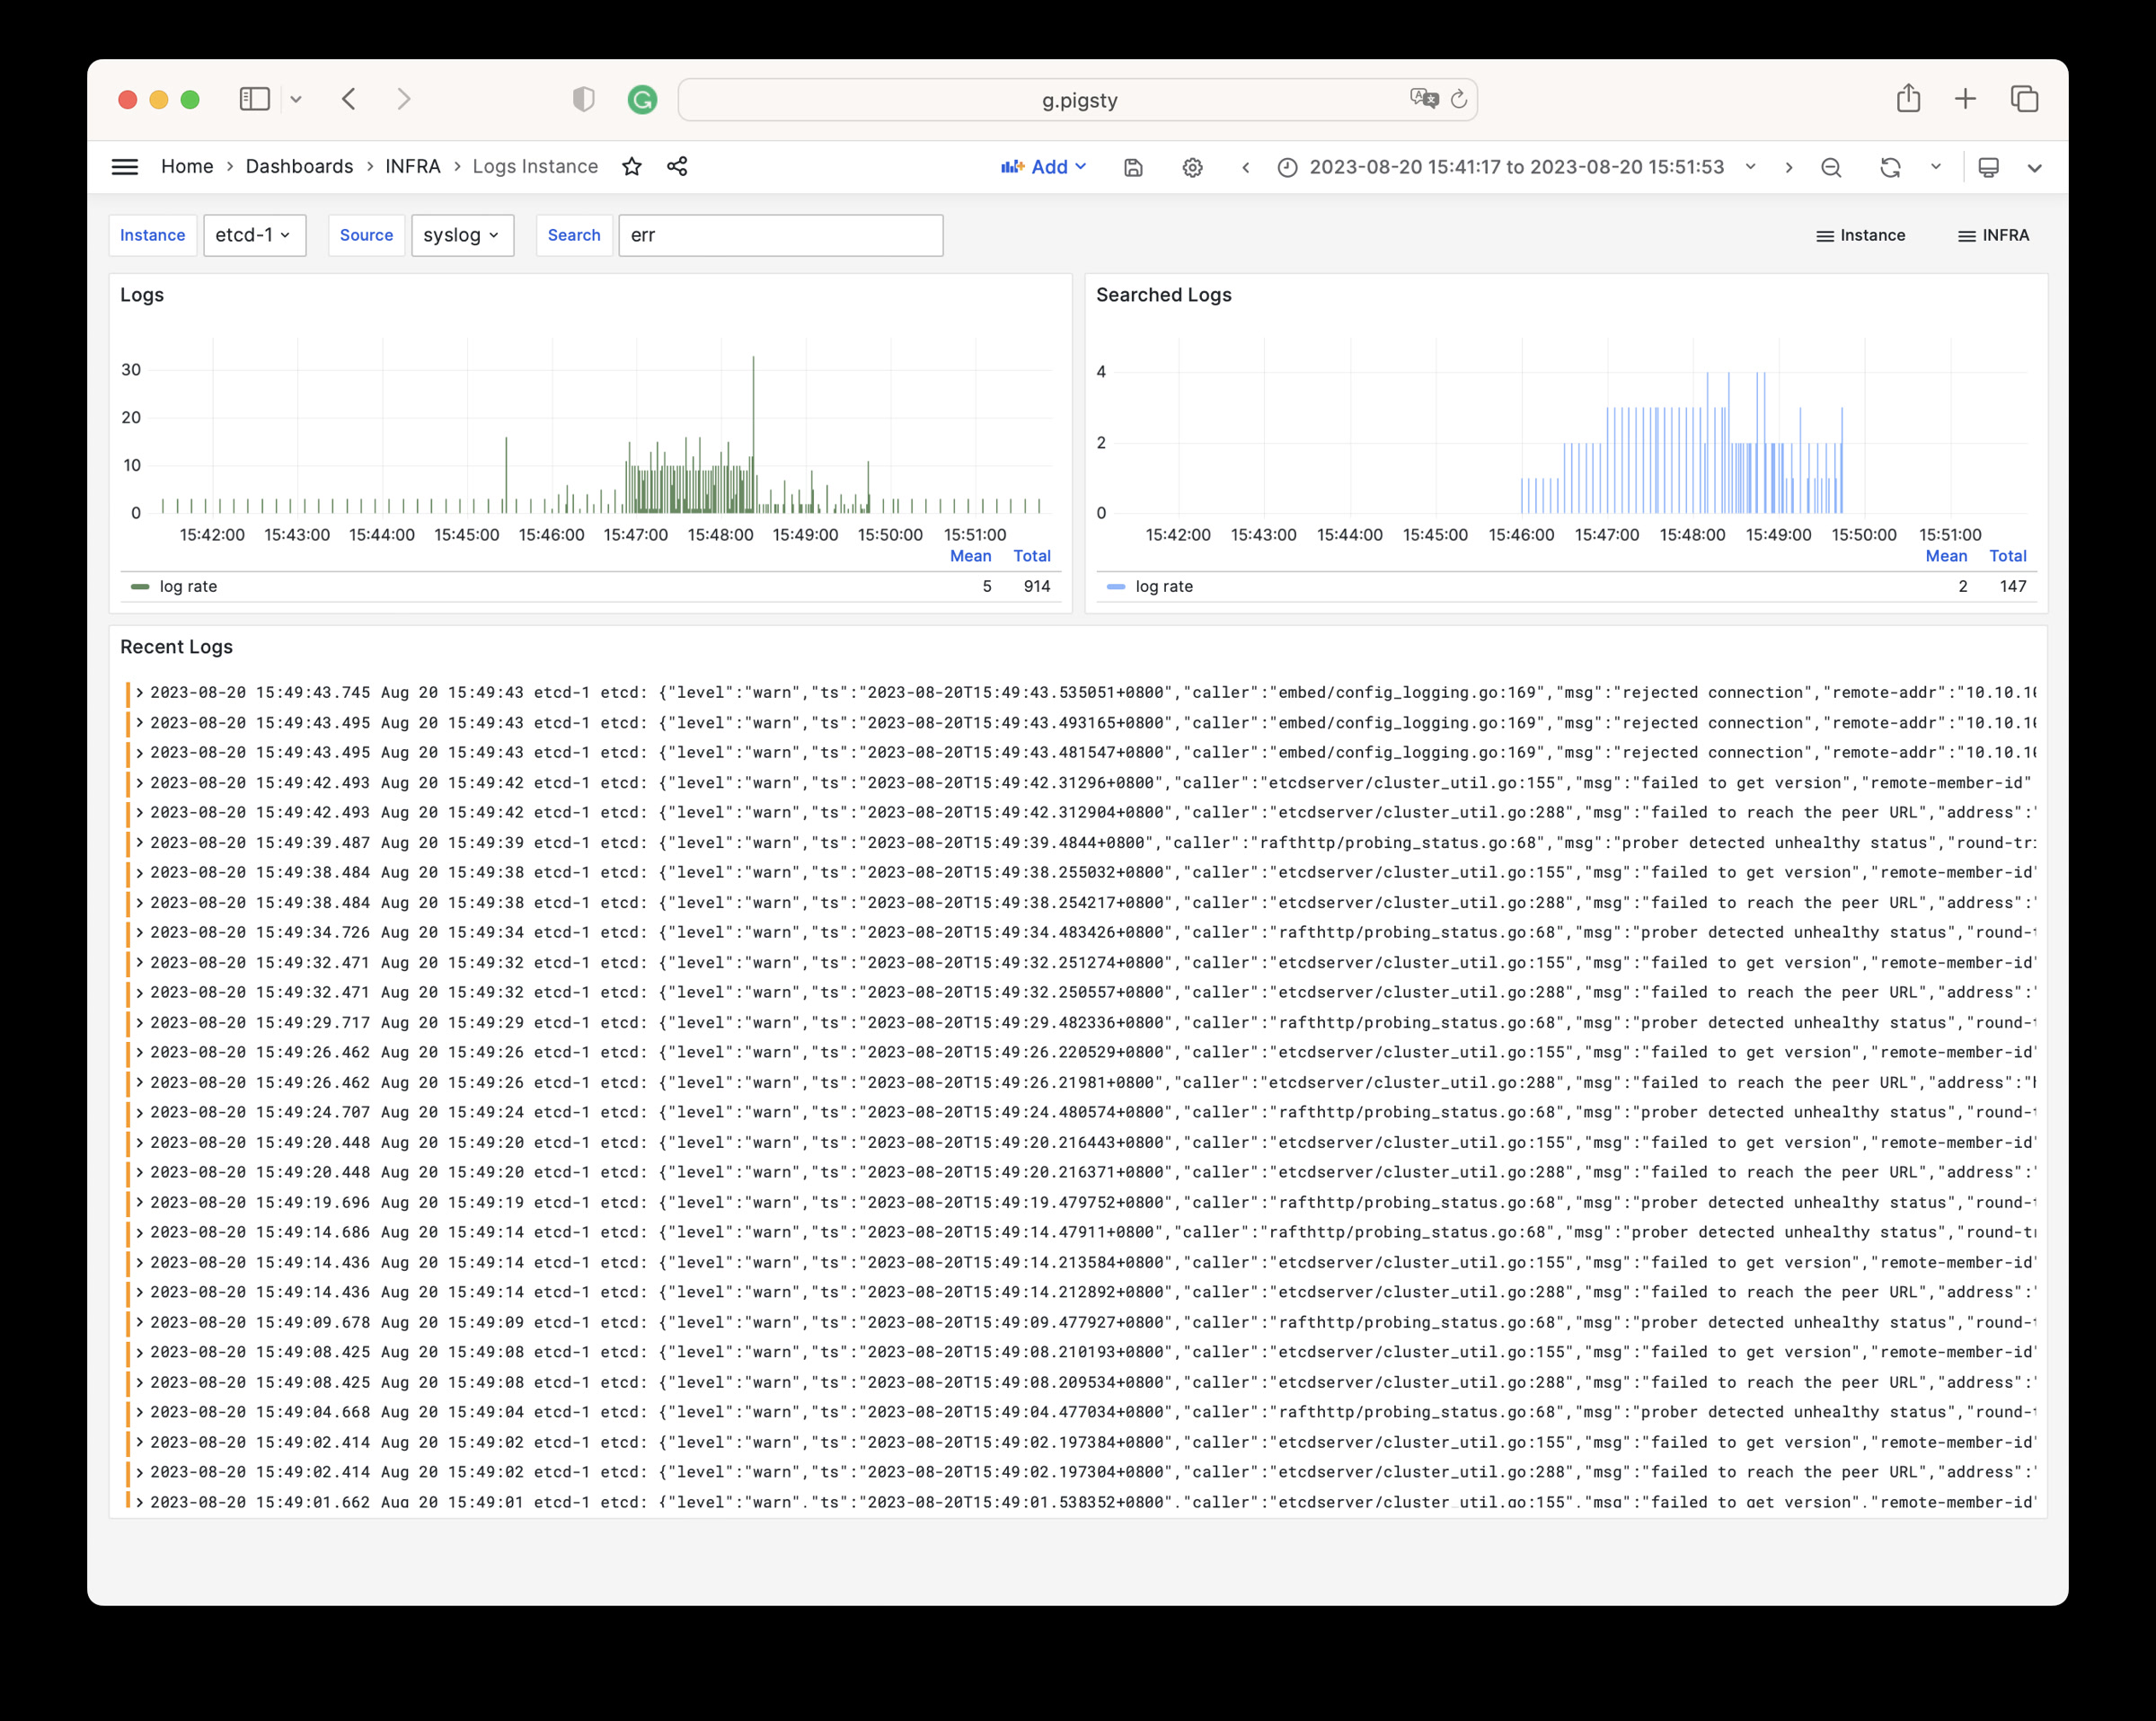
Logs Instance: Node log search based on Vector + VictoriaLogs
Logs Instance Dashboard
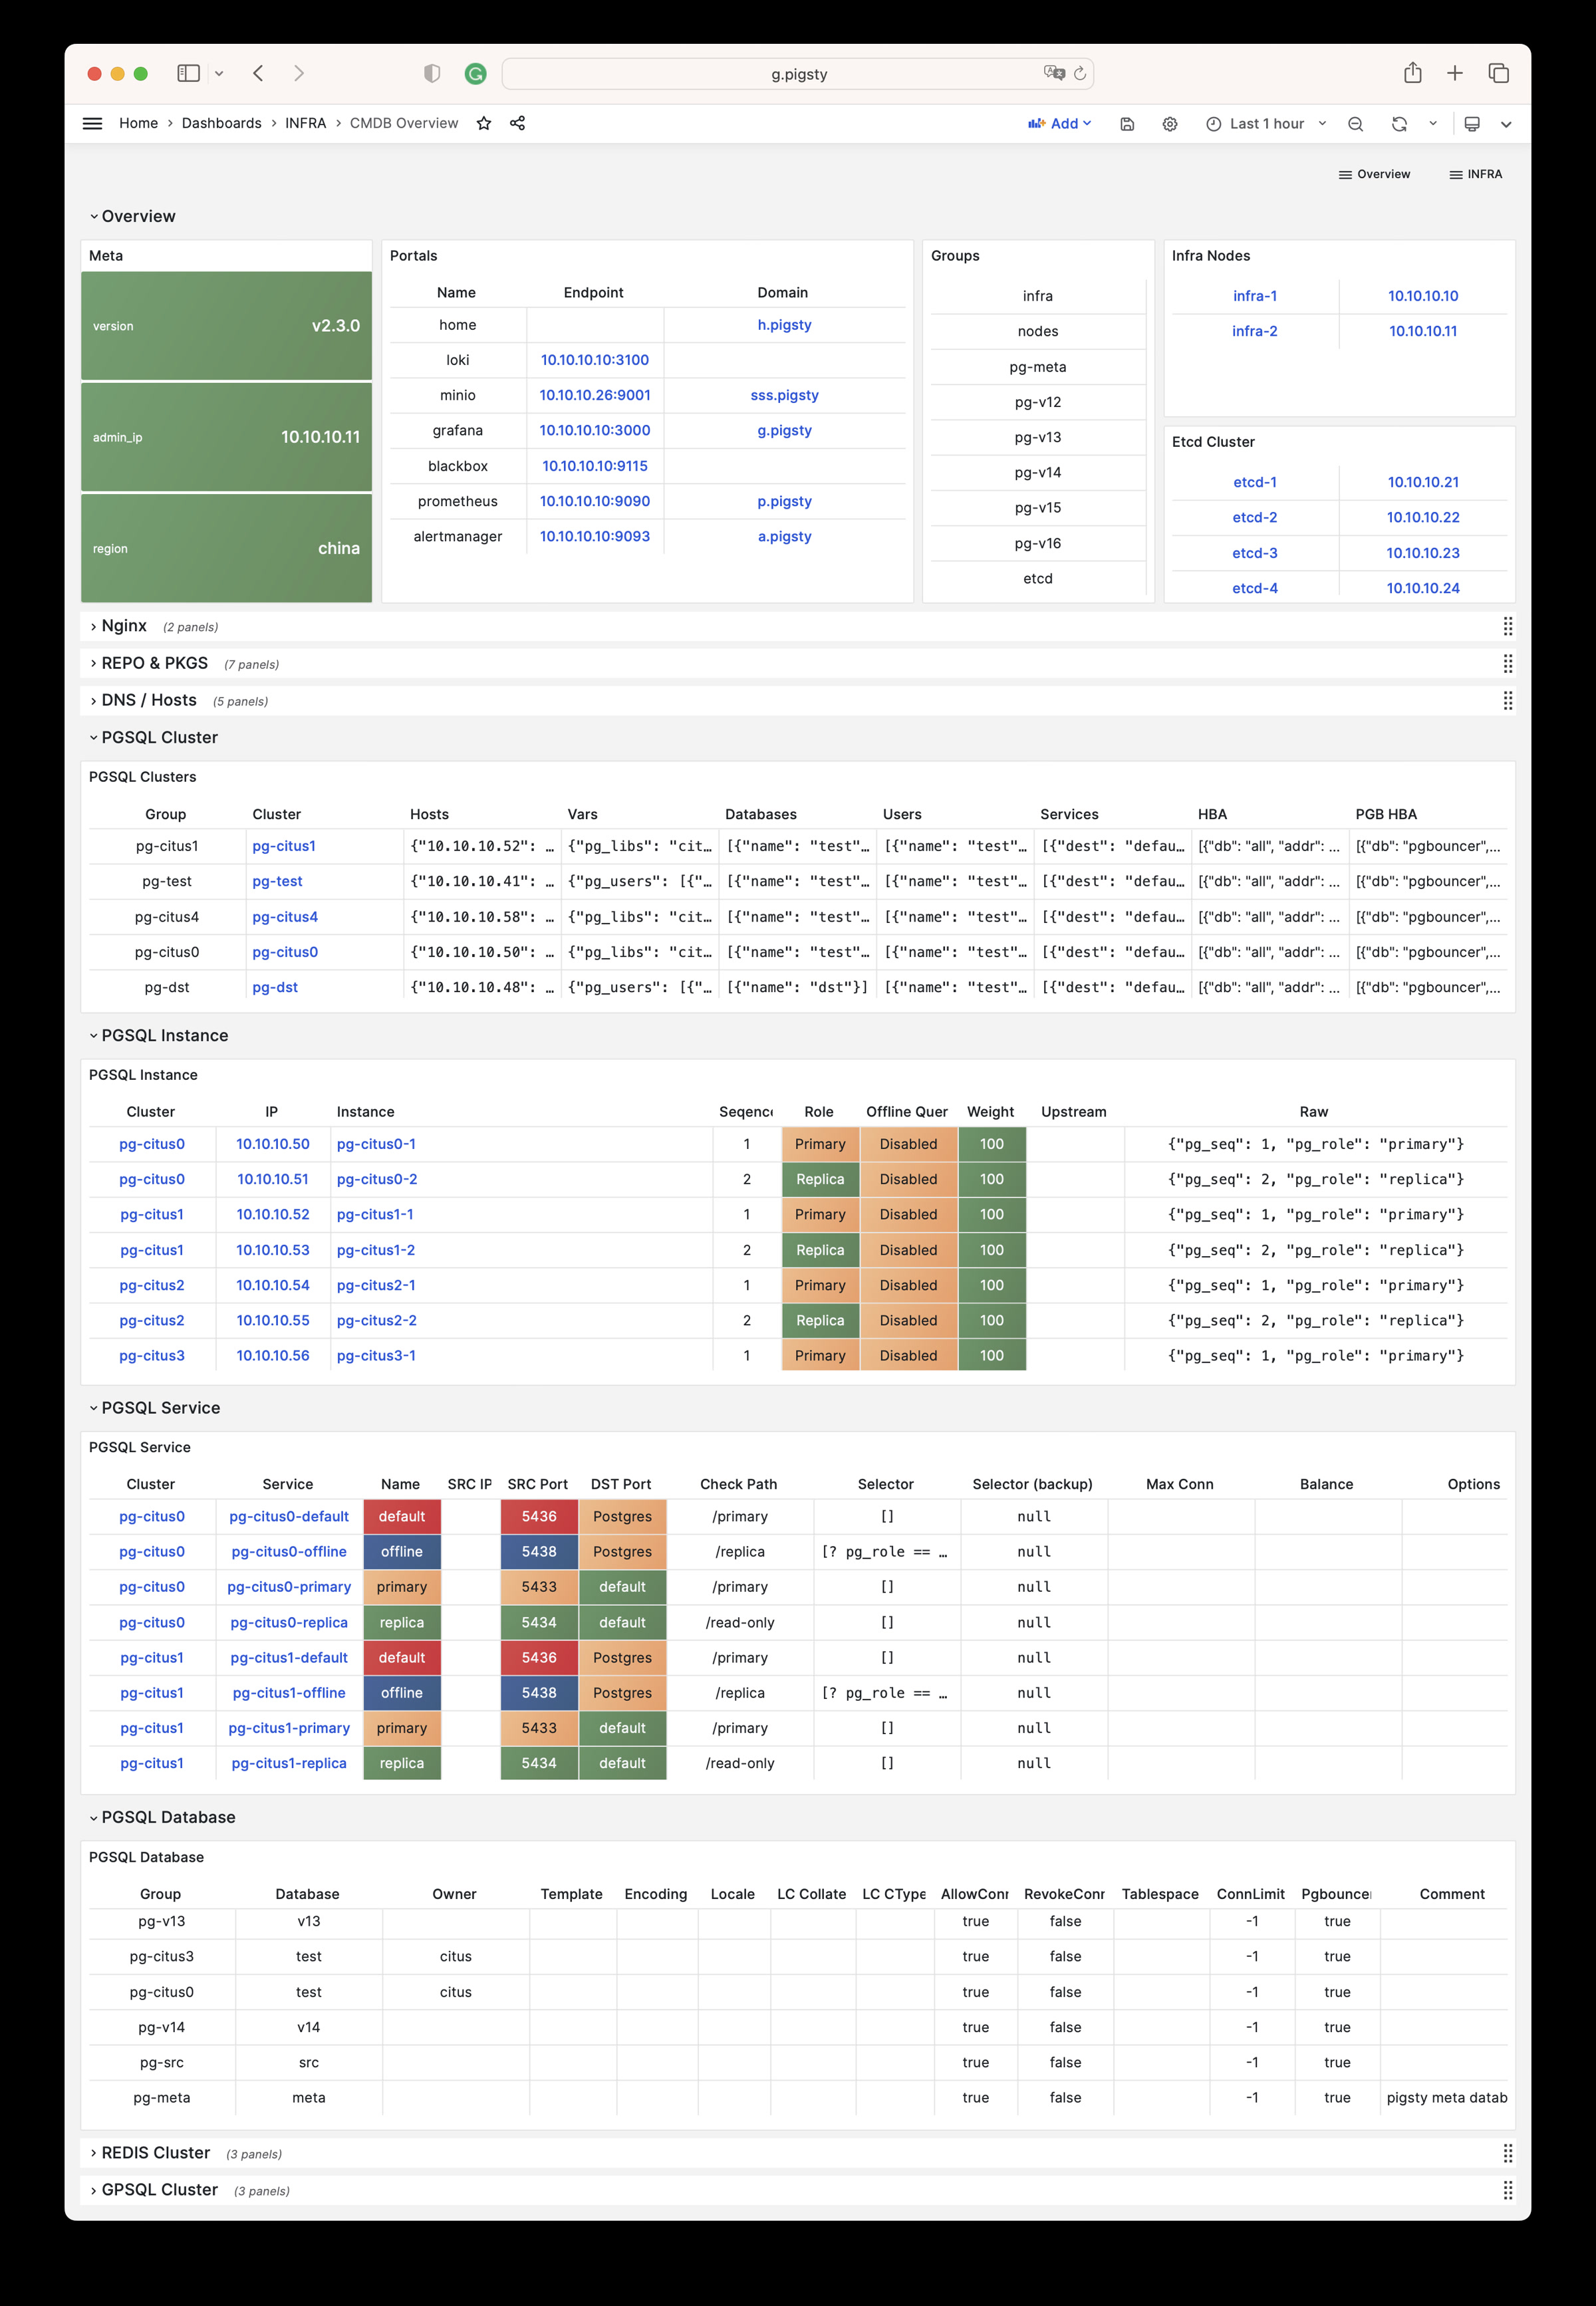
CMDB Overview: CMDB visualization
CMDB Overview Dashboard
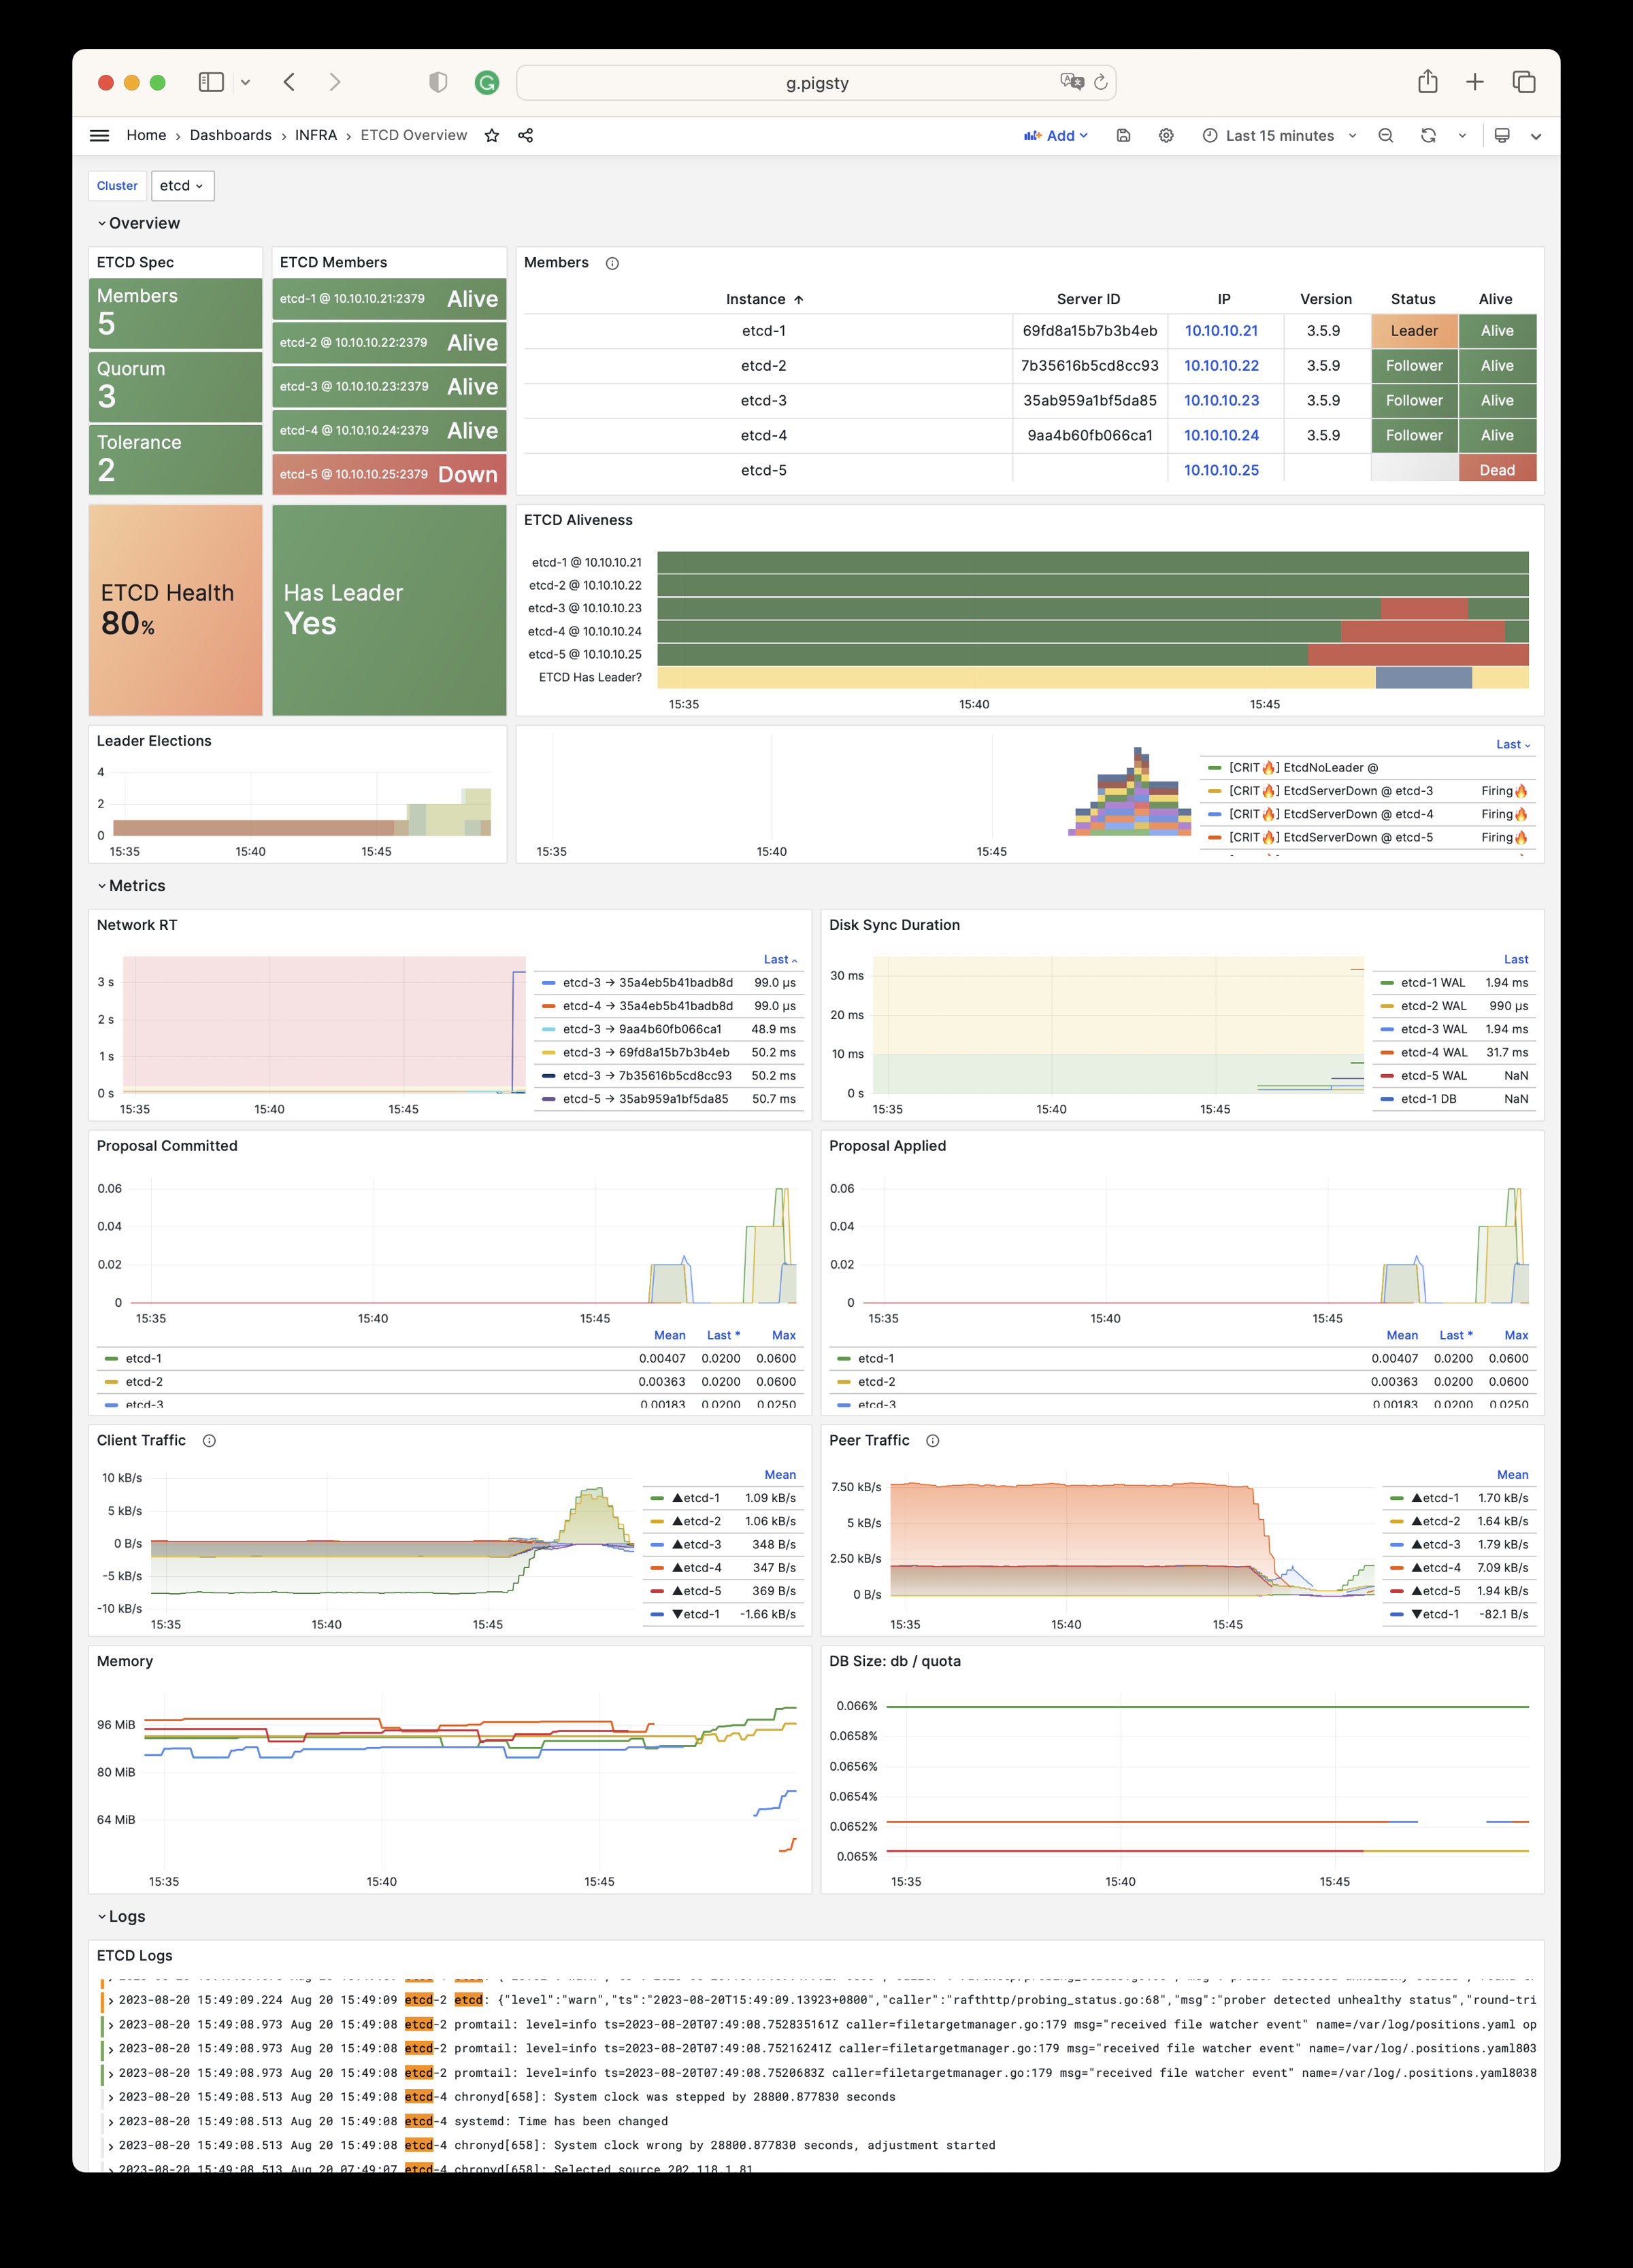
ETCD Overview: etcd metrics and logs
ETCD Overview Dashboard
Parameters
The INFRA module has the following 10 parameter groups.
META: Pigsty metadataCA: Self-signed PKI/CA infrastructureINFRA_ID: Infrastructure portal, Nginx domainsREPO: Local software repositoryINFRA_PACKAGE: Infrastructure software packagesNGINX: Nginx web serverDNS: DNSMASQ domain serverVICTORIA: VictoriaMetrics / Logs / Traces suitePROMETHEUS: Alertmanager and Blackbox ExporterGRAFANA: Grafana observability suite
Parameter Overview
For the latest default values, types, and hierarchy, please refer to the Parameter Reference to stay consistent with the Pigsty version.
How to configure INFRA nodes? Customize Nginx, local repo, DNS, NTP, monitoring components.
INFRA module provides 10 sections with 70+ configurable parameters
How to use built-in Ansible playbooks to manage the INFRA module, with a quick reference for common commands.
How to perform self-monitoring of infrastructure in Pigsty?
Metric endpoints, labels, recording rules, and queries for INFRA Victoria observability components.
Frequently asked questions about the Pigsty INFRA infrastructure module
Infrastructure components and INFRA cluster administration procedures.
Was this page helpful?
Thanks—your feedback helps us improve this page.
What got in the way? (optional)