Architecture
Module:
Categories:
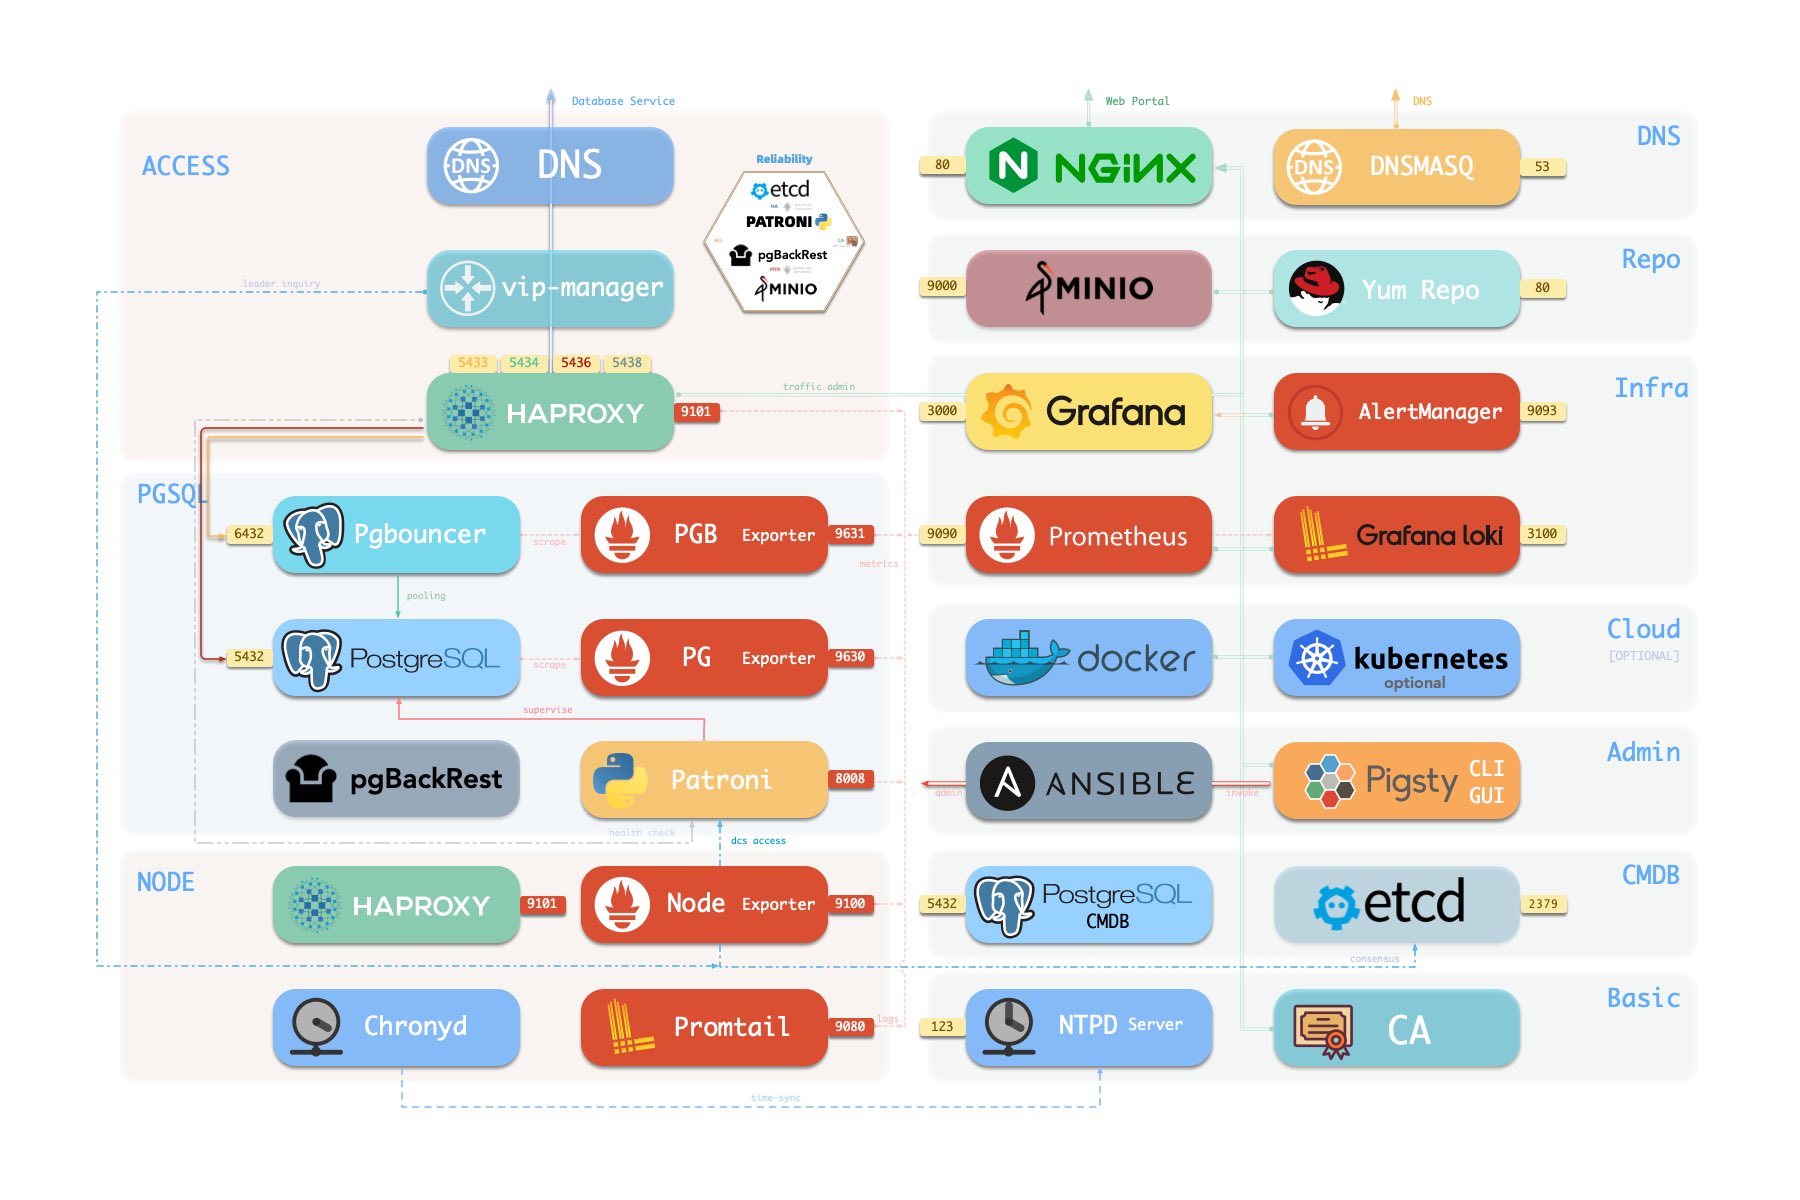
A standard Pigsty deployment comes with an INFRA module that provides essential services for managed nodes and database clusters:
- Nginx: Acts as a web server for local package repositories and a reverse proxy for other web UI services
- Grafana: Visualization platform for metrics, dashboards, and data analytics
- Loki: Centralized log aggregation and querying via Grafana
- Prometheus: Time-series monitoring database for metrics collection, storage, and alert evaluation
- AlertManager: Alert aggregation, notification dispatch, and silencing
- PushGateway: Collects metrics from one-off and batch jobs
- BlackboxExporter: Probes node IP and VIP reachability
- DNSMASQ: DNS resolution for Pigsty’s internal domains
- Chronyd: NTP time synchronization to keep all nodes in sync
The INFRA module isn’t mandatory for HA PostgreSQL - for instance, it’s omitted in Slim Install mode.
However, since INFRA provides essential supporting services for production-grade HA PostgreSQL clusters, it’s strongly recommended for most deployments.
If you already have your own infrastructure (Nginx, local repos, monitoring, DNS, NTP), you can disable INFRA and configure Pigsty to use your existing stack instead.
Architecture Overview
INFRA module includes these components with default ports and domains:
| Component | Port | Default Domain | Description |
|---|---|---|---|
| Nginx | 80/443 |
h.pigsty |
Web Portal & Package Repos |
| Grafana | 3000 |
g.pigsty |
Visualization Platform |
| Prometheus | 9090 |
p.pigsty |
TSDB for Metrics |
| AlertManager | 9093 |
a.pigsty |
Alert Management |
| Loki | 3100 |
- | Log Aggregation |
| PushGateway | 9091 |
- | One-off Metrics Collector |
| BlackboxExporter | 9115 |
- | Blackbox Monitoring |
| DNSMasq | 53 |
- | DNS Server |
| Chronyd | 123 |
- | NTP Server |
Here’s how components look in a full single-node Pigsty installation:
By design, INFRA module failures typically won’t impact existing PostgreSQL clusters’ operations.
The PGSQL module relies on several INFRA services:
-
DNS resolution via DNSMASQ for cluster/host domains
- Pigsty itself uses direct IP connections to avoid DNS dependency
-
Software installation via Nginx’s local yum/apt repos
- Users can specify
repo_upstream&node_repo_modulesto use internet/other repos
- Users can specify
-
Metrics collection by Prometheus
- Disabled when
prometheus_enabledisfalse
- Disabled when
-
Log shipping to Loki via Promtail (only to
infra_portalendpoint)- Disabled when
loki_enabledisfalse
- Disabled when
-
Time sync from INFRA/ADMIN’s NTP/Chronyd
- INFRA nodes use public NTP servers
- Other nodes sync from INFRA/ADMIN
- Custom NTP servers configurable via
node_ntp_servers
-
Patroni uses INFRA’s etcd as DCS (if no dedicated cluster)
-
pgBackRest uses INFRA’s MinIO as optional backup repo (if no dedicated cluster)
-
Admins manage database nodes from INFRA/ADMIN via Ansible or other tools:
- Cluster creation, scaling, instance/cluster recycling
- Business user/database creation, service/HBA modifications
- Log collection, vacuum, backup, health checks
Nginx
Nginx is the gateway for all WebUI services in Pigsty, serving HTTP/HTTPS on ports 80/443.
It exposes web UIs like Grafana, Prometheus, AlertManager, and HAProxy console, while also serving static resources like local yum/apt repos.
Nginx configuration follows infra_portal definitions, for example:
infra_portal:
  home         : { domain: h.pigsty }
  grafana      : { domain: g.pigsty ,endpoint: "${admin_ip}:3000" ,websocket: true }
  prometheus   : { domain: p.pigsty ,endpoint: "${admin_ip}:9090" }
  alertmanager : { domain: a.pigsty ,endpoint: "${admin_ip}:9093" }
  blackbox     : { endpoint: "${admin_ip}:9115" }
  loki         : { endpoint: "${admin_ip}:3100" }
  #minio        : { domain: sss.pigsty  ,endpoint: "${admin_ip}:9001" ,scheme: https ,websocket: true }
These endpoint definitions are referenced by other services - logs go to loki endpoint, Grafana datasources register to grafana endpoint, alerts route to alertmanager endpoint.
Pigsty allows rich Nginx customization as a local file server or reverse proxy, with self-signed or real HTTPS certs.
Sample Nginx Config from Pigsty Demo Site
infra_portal:                     # domain names and upstream servers
  home         : { domain: home.pigsty.cc                                                 ,certbot: pigsty.demo }
  grafana      : { domain: demo.pigsty.cc ,endpoint: "${admin_ip}:3000", websocket: true  ,certbot: pigsty.demo }
  prometheus   : { domain: p.pigsty.cc    ,endpoint: "${admin_ip}:9090"                   ,certbot: pigsty.demo }
  alertmanager : { domain: a.pigsty.cc    ,endpoint: "${admin_ip}:9093"                   ,certbot: pigsty.demo }
  blackbox     : { endpoint: "${admin_ip}:9115"                                                               }
  loki         : { endpoint: "${admin_ip}:3100"                                                               }
  postgrest    : { domain: api.pigsty.cc  ,endpoint: "127.0.0.1:8884"                                         }
  pgadmin      : { domain: adm.pigsty.cc  ,endpoint: "127.0.0.1:8885"                                         }
  pgweb        : { domain: cli.pigsty.cc  ,endpoint: "127.0.0.1:8886"                                         }
  bytebase     : { domain: ddl.pigsty.cc  ,endpoint: "127.0.0.1:8887"                                         }
  jupyter      : { domain: lab.pigsty.cc  ,endpoint: "127.0.0.1:8888"   ,websocket: true                      }
  gitea        : { domain: git.pigsty.cc  ,endpoint: "127.0.0.1:8889"                     ,certbot: pigsty.cc }
  wiki         : { domain: wiki.pigsty.cc ,endpoint: "127.0.0.1:9002"                     ,certbot: pigsty.cc }
  noco         : { domain: noco.pigsty.cc ,endpoint: "127.0.0.1:9003"                     ,certbot: pigsty.cc }
  supa         : { domain: supa.pigsty.cc ,endpoint: "10.2.82.163:8000" ,websocket: true  ,certbot: pigsty.cc }
  dify         : { domain: dify.pigsty.cc ,endpoint: "10.2.82.163:8001" ,websocket: true  ,certbot: pigsty.cc }
  odoo         : { domain: odoo.pigsty.cc ,endpoint: "127.0.0.1:8069"   ,websocket: true  ,certbot: pigsty.cc }
  mm           : { domain: mm.pigsty.cc   ,endpoint: "10.2.82.163:8065" ,websocket: true                      }
  web.io:
    domain: en.pigsty.cc
    path: "/www/web.io"
    certbot: pigsty.doc
    enforce_https: true
    config: |
      # rewrite /zh/ to /
          location /zh/ {
              rewrite ^/zh/(.*)$ /$1 permanent;
          }
  web.cc:
    domain: pigsty.cc
    path: "/www/web.cc"
    domains: [ zh.pigsty.cc ]
    certbot: pigsty.doc
    config: |
      # rewrite /zh/ to /
          location /zh/ {
              rewrite ^/zh/(.*)$ /$1 permanent;
          }
  repo:
    domain: pro.pigsty.cc
    path: "/www/repo"
    index: true
    certbot: pigsty.doc
For more details, check these tutorials:
- Tutorial: DNS Configuration
- Tutorial: Nginx Service Exposure
- Tutorial: Certbot HTTPS Certificate Management
Local Package Repository
During installation, Pigsty creates a local package repo on the INFRA node to speed up subsequent software installations.
Located at /www/pigsty and served by Nginx, it’s accessible via http://h.pigsty/pigsty.
Pigsty’s offline package is a tarball of a pre-built repo directory. If /www/pigsty exists with a /www/pigsty/repo_complete marker, Pigsty skips downloading from upstream - perfect for air-gapped environments!
Repo definition lives in /www/pigsty.repo, fetchable via http://${admin_ip}/pigsty.repo:
curl -L http://h.pigsty/pigsty.repo -o /etc/yum.repos.d/pigsty.repo
You can also use the file repo directly without Nginx:
[pigsty-local]
name=Pigsty local $releasever - $basearch
baseurl=file:///www/pigsty/
enabled=1
gpgcheck=0
Local repo configs are in: Config: INFRA - REPO
Prometheus
Prometheus, our TSDB for monitoring, listens on port 9090 (access via IP:9090 or http://p.pigsty).
Key features:
- Service discovery via local static files with identity info
- Metric scraping, pre-processing, and TSDB storage
- Alert rule evaluation and forwarding to AlertManager
AlertManager handles alerts on port 9093 (IP:9093 or http://a.pigsty).
While it receives Prometheus alerts, you’ll need extra config (e.g., SMTP) for notifications.
Configs for Prometheus, AlertManager, PushGateway, and BlackboxExporter are in: Config: INFRA - PROMETHEUS
Grafana
Grafana, our visualization powerhouse, runs on port 3000 (IP:3000 or http://g.pigsty).
Pigsty’s monitoring is dashboard-based with URL-driven navigation. Drill down or up quickly to pinpoint issues.
Fun fact: We’ve supercharged Grafana with extra viz plugins like ECharts - it’s not just monitoring, it’s a low-code data app platform!
Loki handles logs on port 3100, with Promtail shipping logs from nodes to the mothership.
Configs live in: Config: INFRA - GRAFANA and Config: INFRA - Loki
Ansible
Pigsty installs Ansible on meta-nodes because… who doesn’t love declarative, idempotent infrastructure as code? 🎭
DNSMASQ
DNSMASQ handles DNS resolution, with other modules registering their domains to INFRA’s DNSMASQ service.
DNS records live in /etc/hosts.d/ on all INFRA nodes.
Configs: Config: INFRA - DNS
Chronyd
Time waits for no one, but Chronyd helps keep all nodes in sync! (Optional)
NTP configs: Config: NODES - NTP
Feedback
Was this page helpful?
Glad to hear it! Please tell us how we can improve.
Sorry to hear that. Please tell us how we can improve.